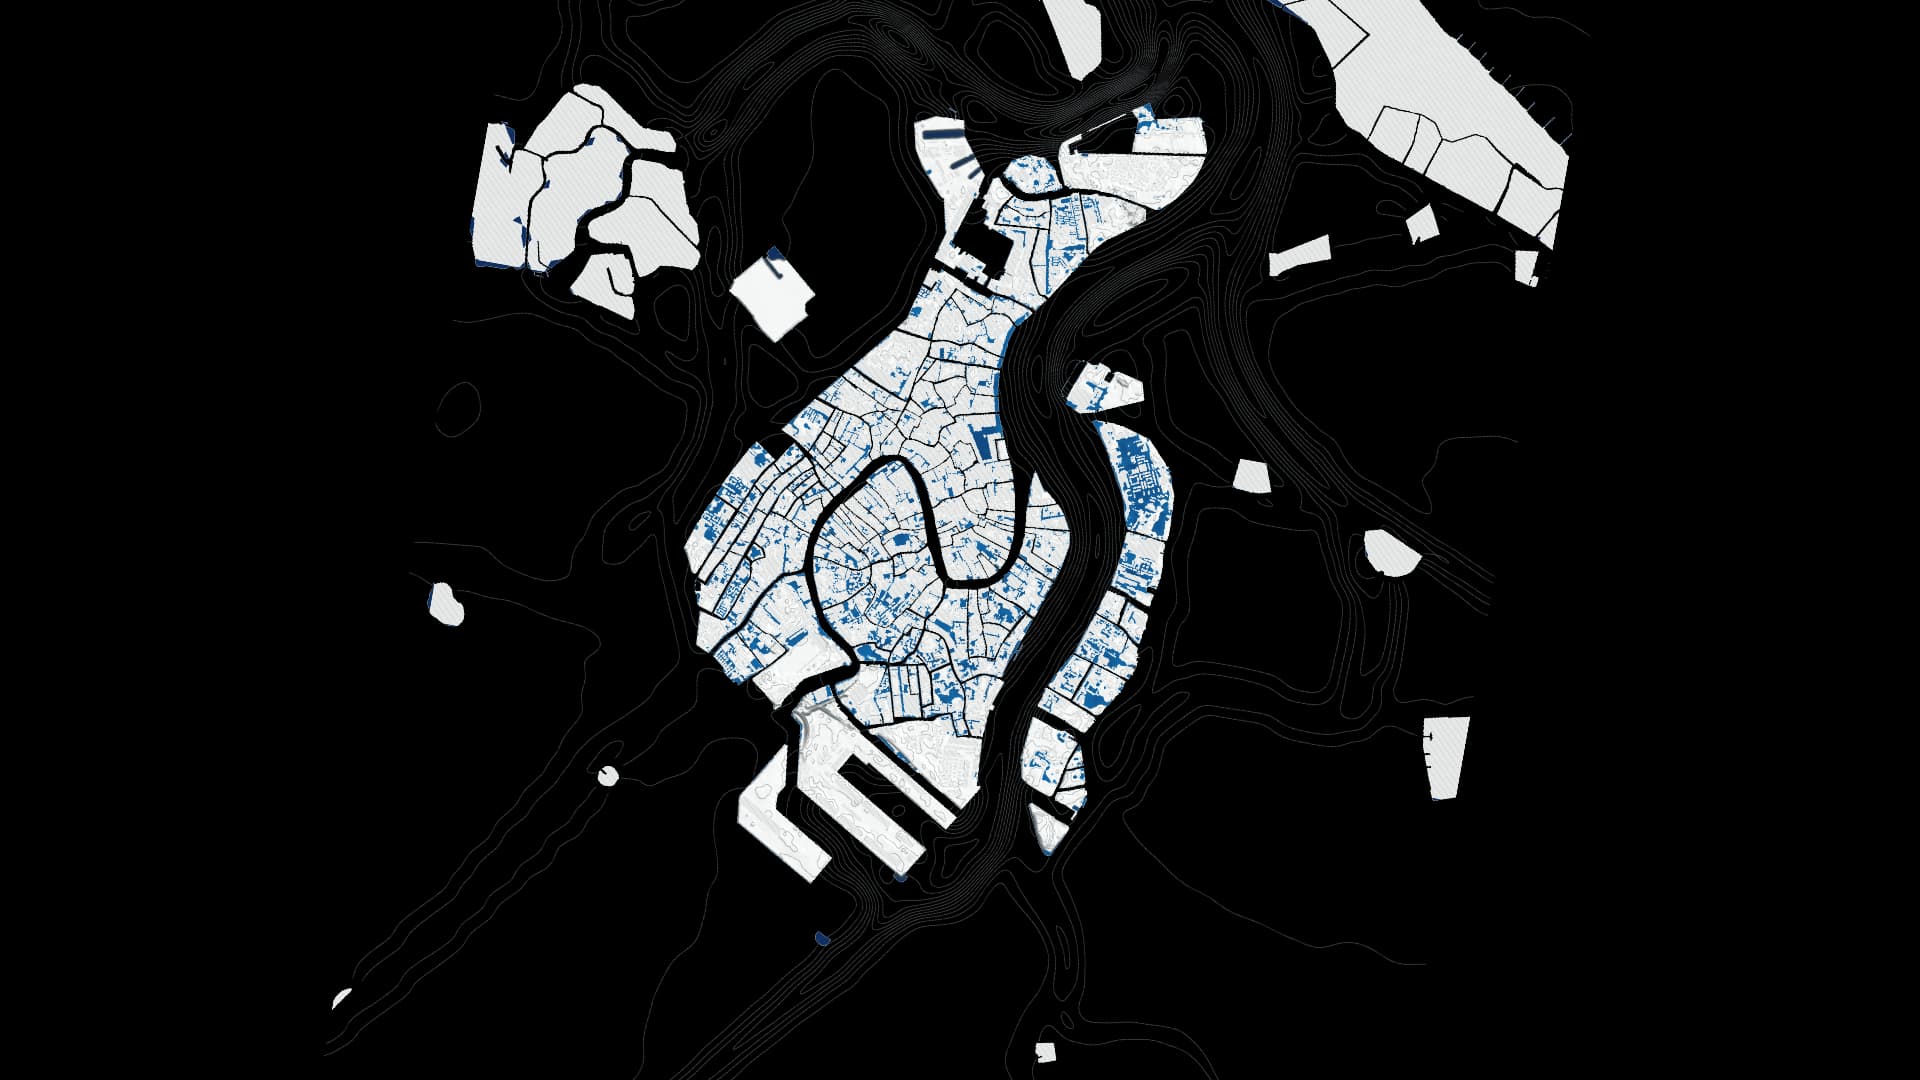
Venice’s floods: caring for a city after the water recedes
Follow changing flood depth and the city’s relief through 109 outputs of a 2019 reconstruction.

Stories from the boundary between art and data.
Follow changing flood depth and the city’s relief through 109 outputs of a 2019 reconstruction.
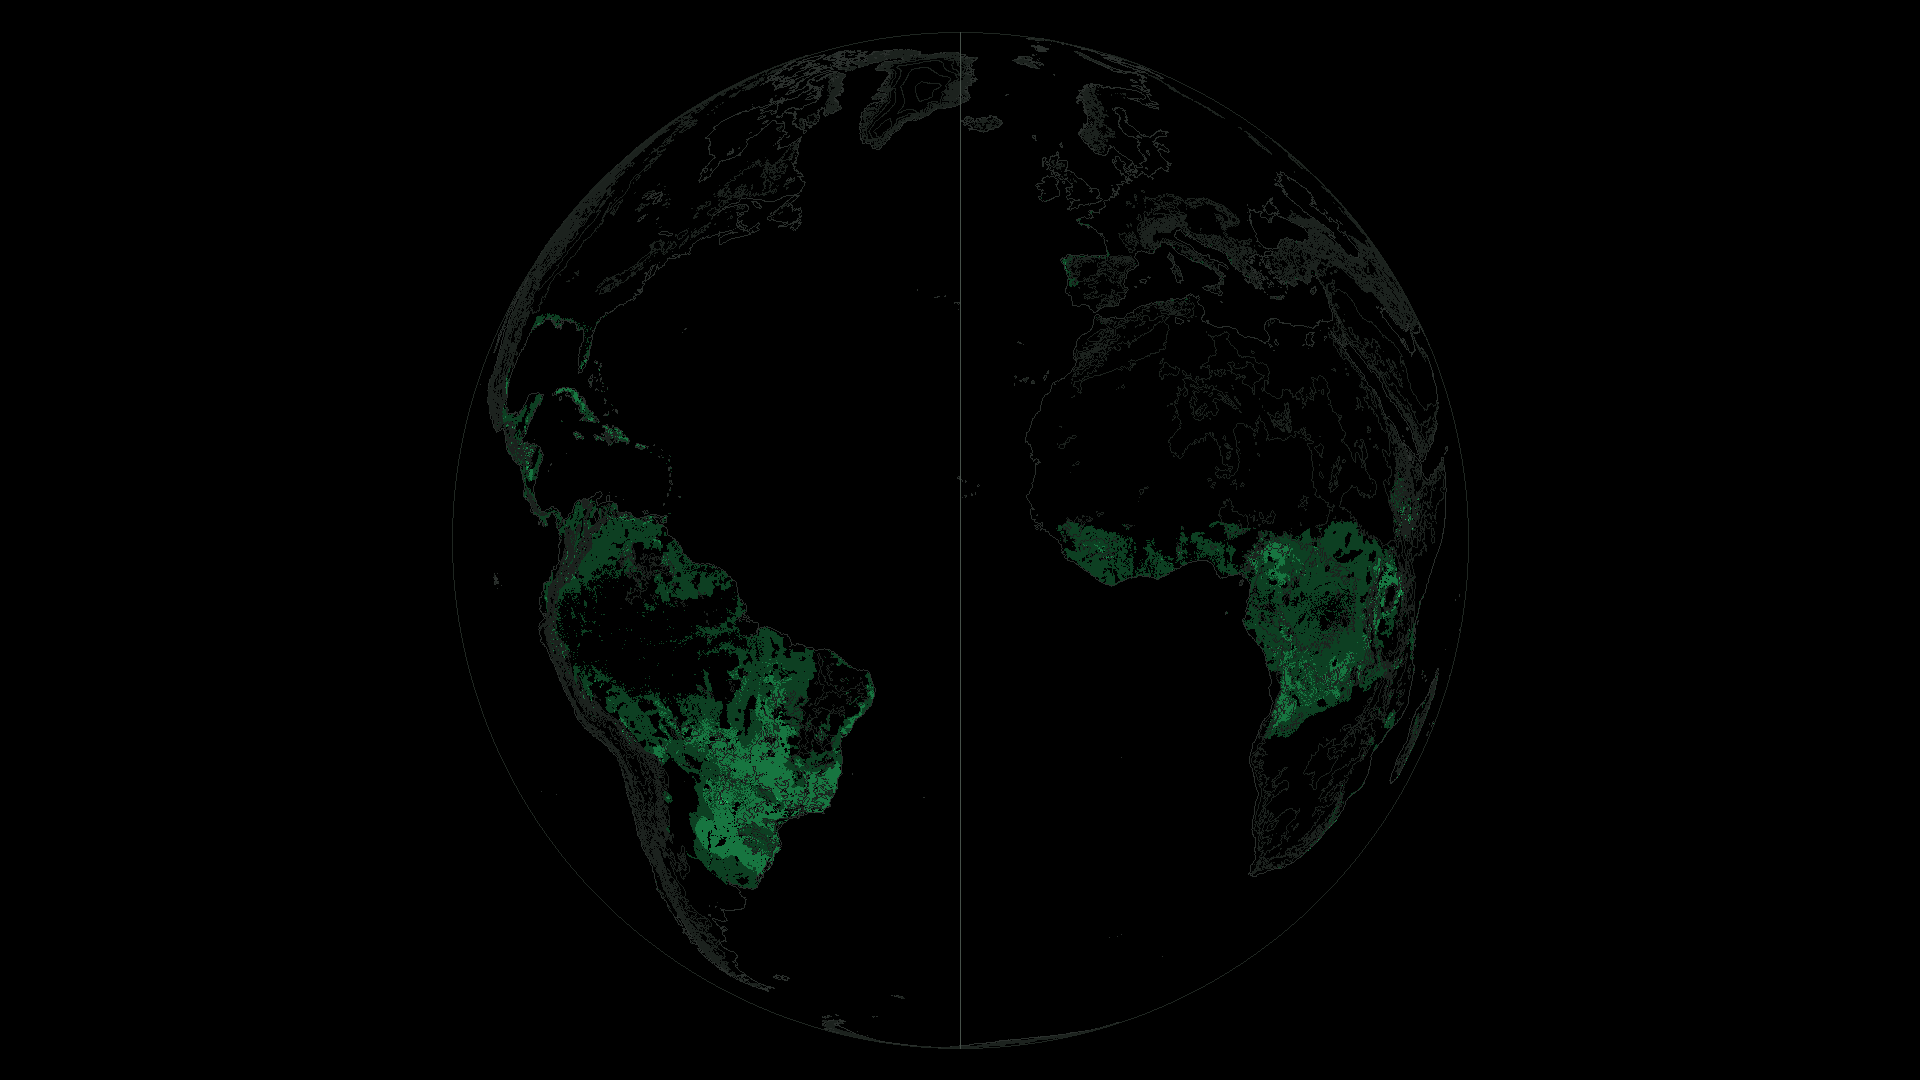
Land in the highest suitability class for rainfed Arabica could shrink by 53.7% worldwide around 2050. One climate scenario puts a number on a change facing both coffee trees and the people who grow them.
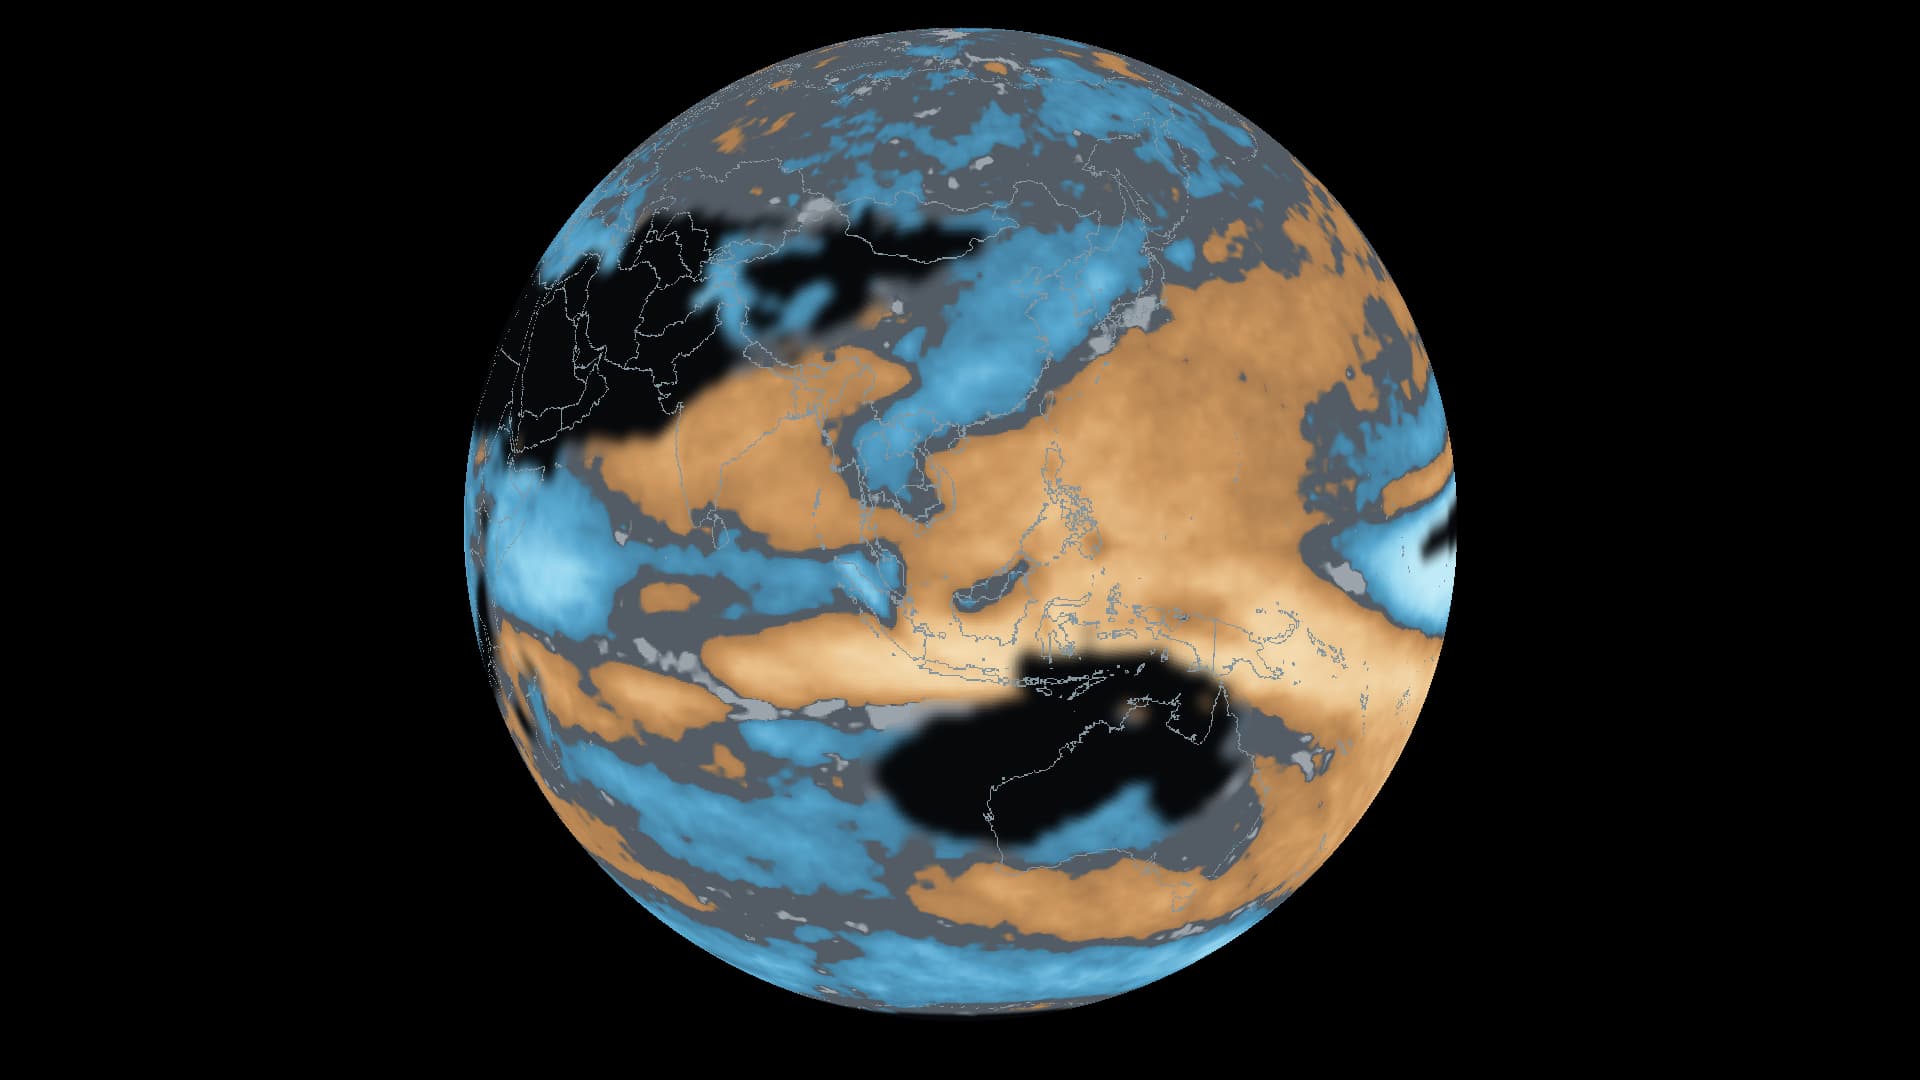
Watch the same globe across six forecast months, from autumn 2026 to spring 2027. The places leaning wetter or drier change with the season.
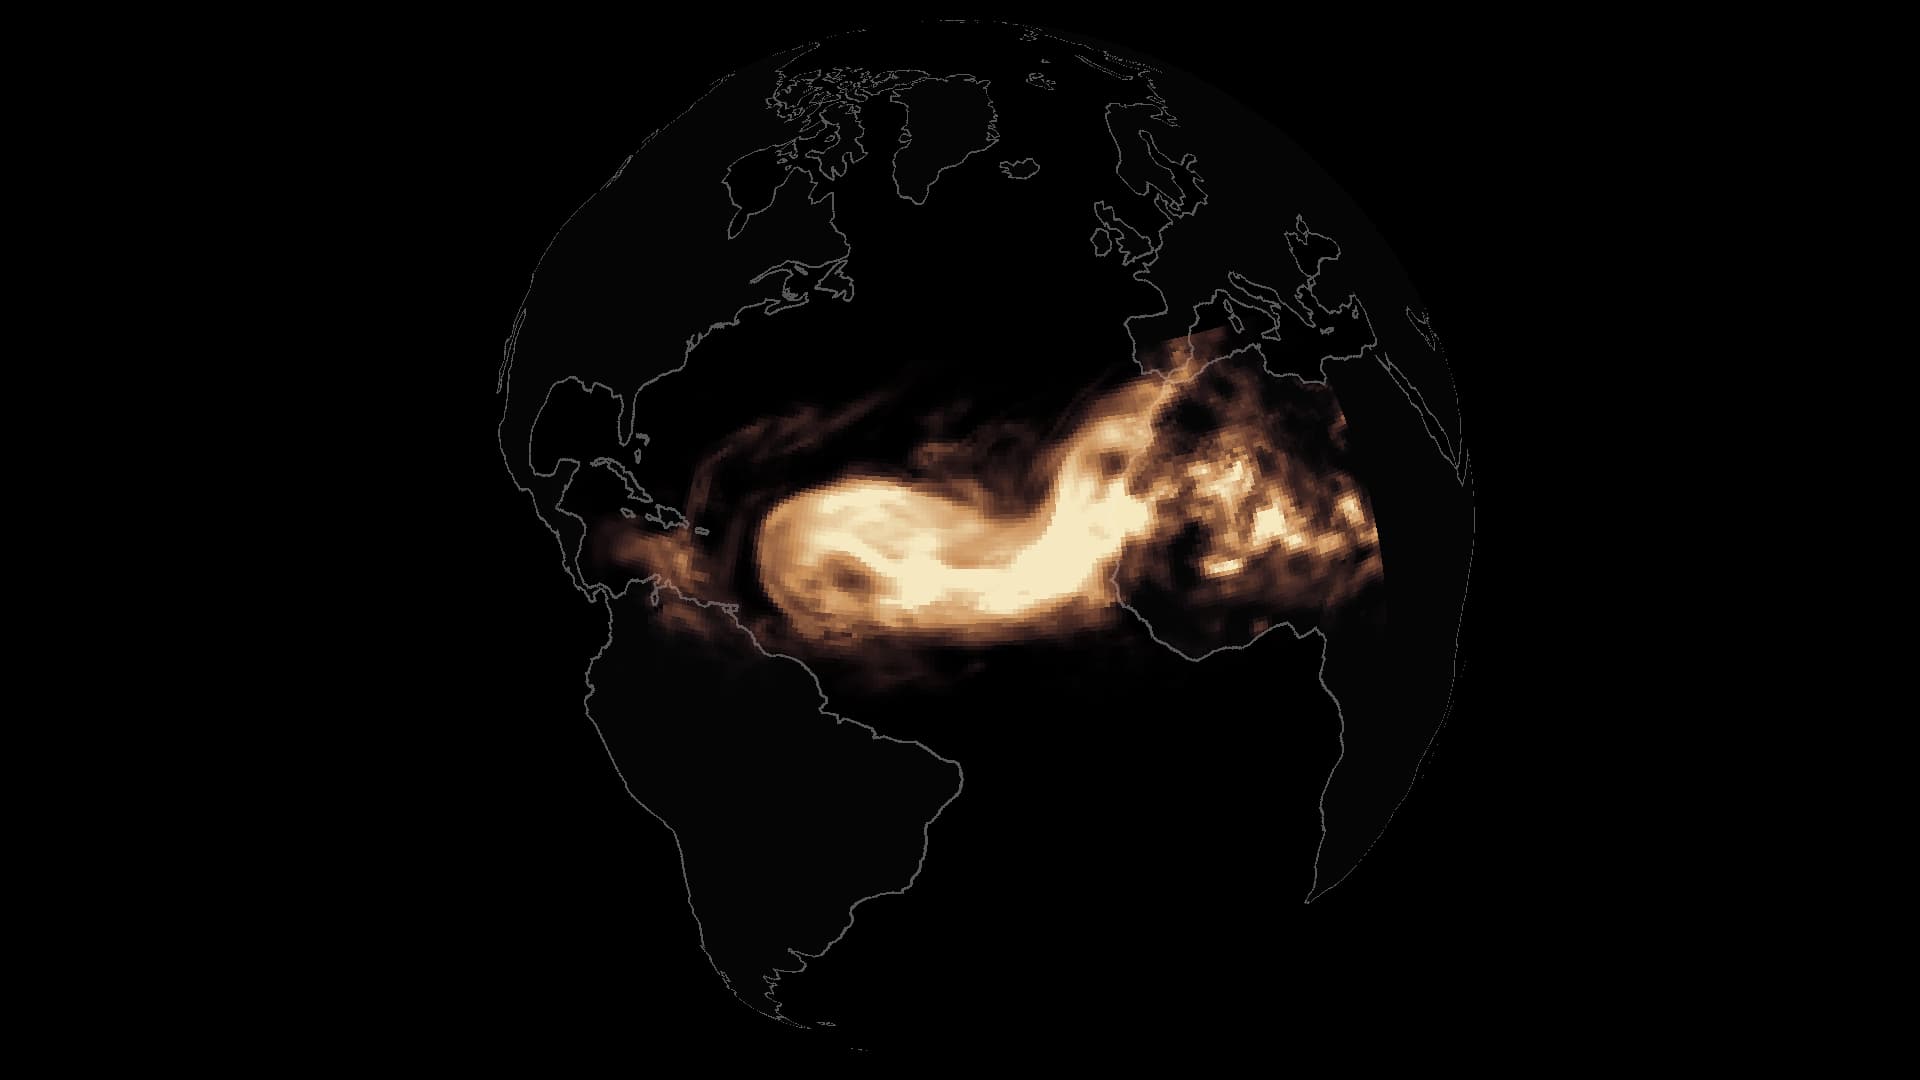
Dust fields from September 2026 reveal an atmospheric connection between West Africa, the Caribbean and a distant rainforest.
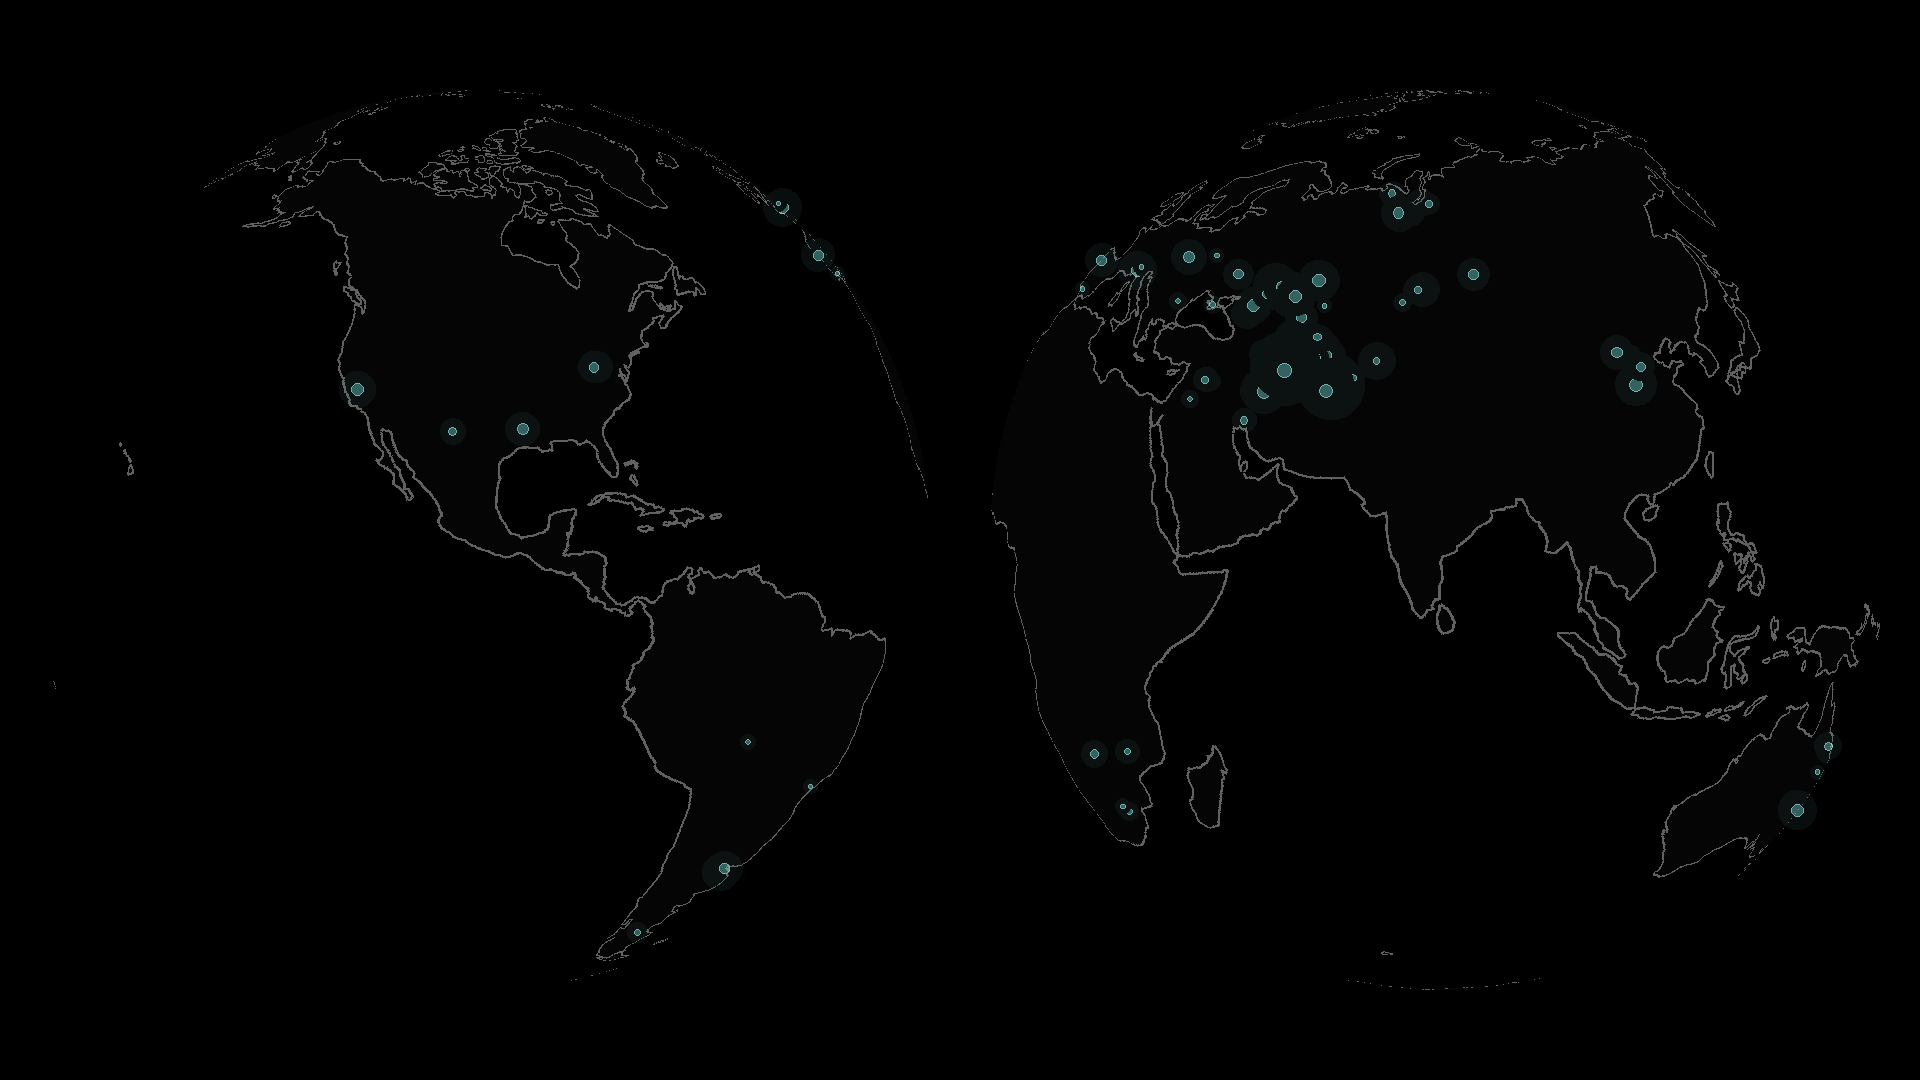
5,094 detections from 2024–2026 reveal the distance between observing a methane emission from orbit and reducing it on the ground.
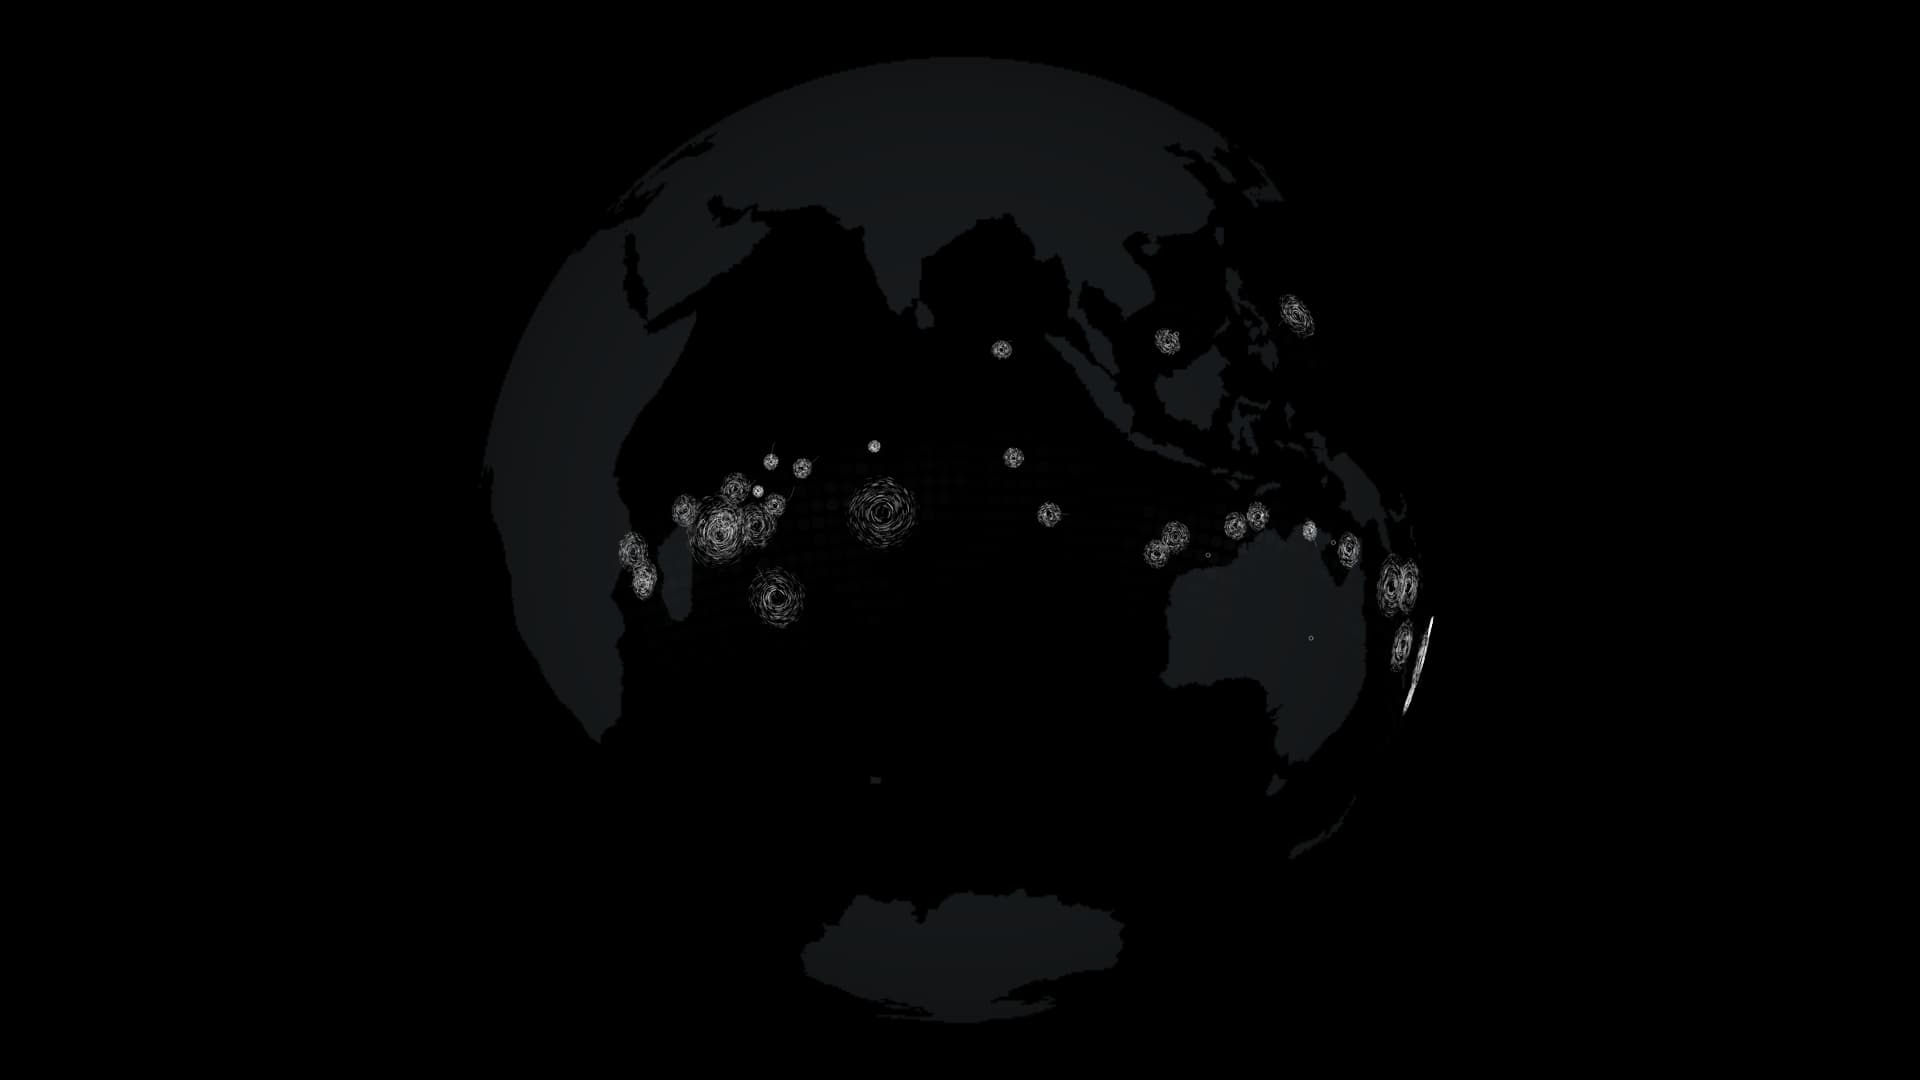
How does ocean heat feed a vast rotating storm? Thirty years of records connect storm formation, seasonal geography and the names typhoon, hurricane and cyclone.
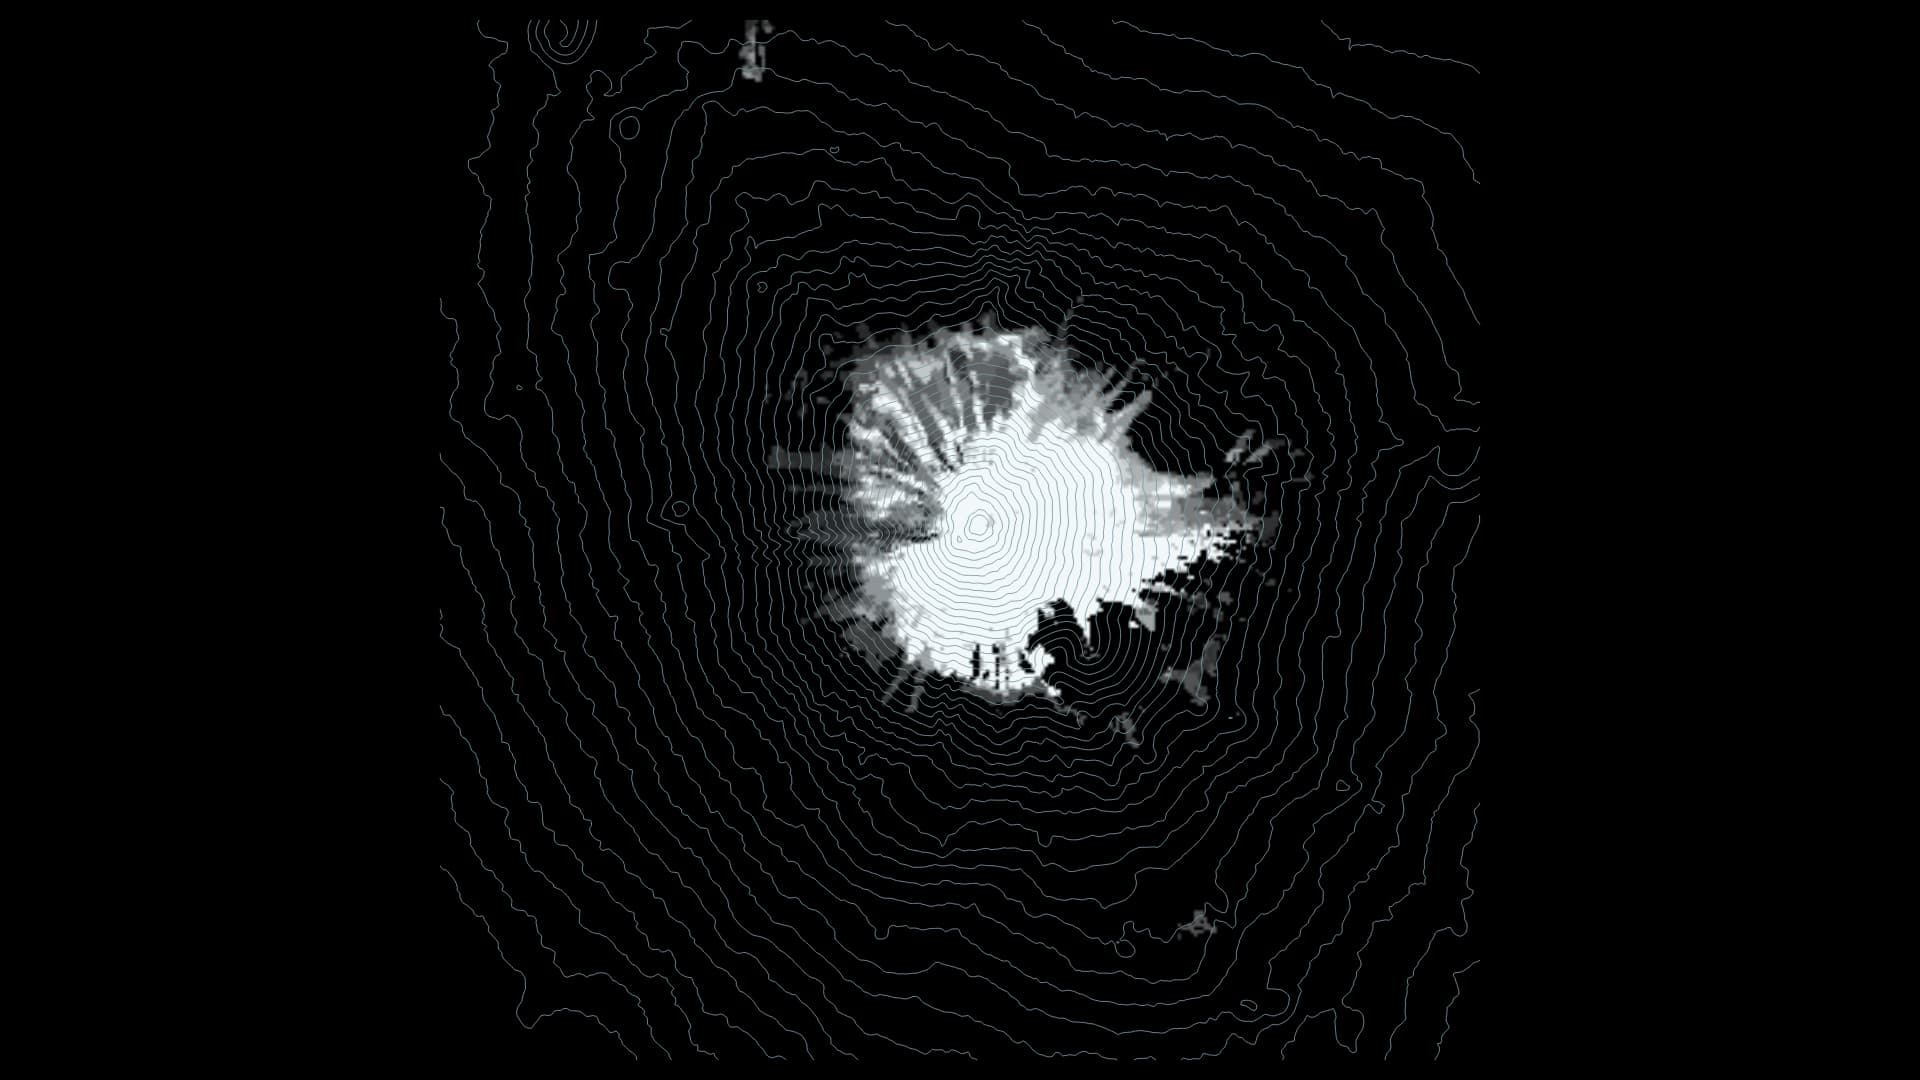
Mount Fuji is a symbol of Japan and one of the world’s most iconic mountains. Monthly snow observations, visibility records and 132 first-snowcap dates help us look closer.
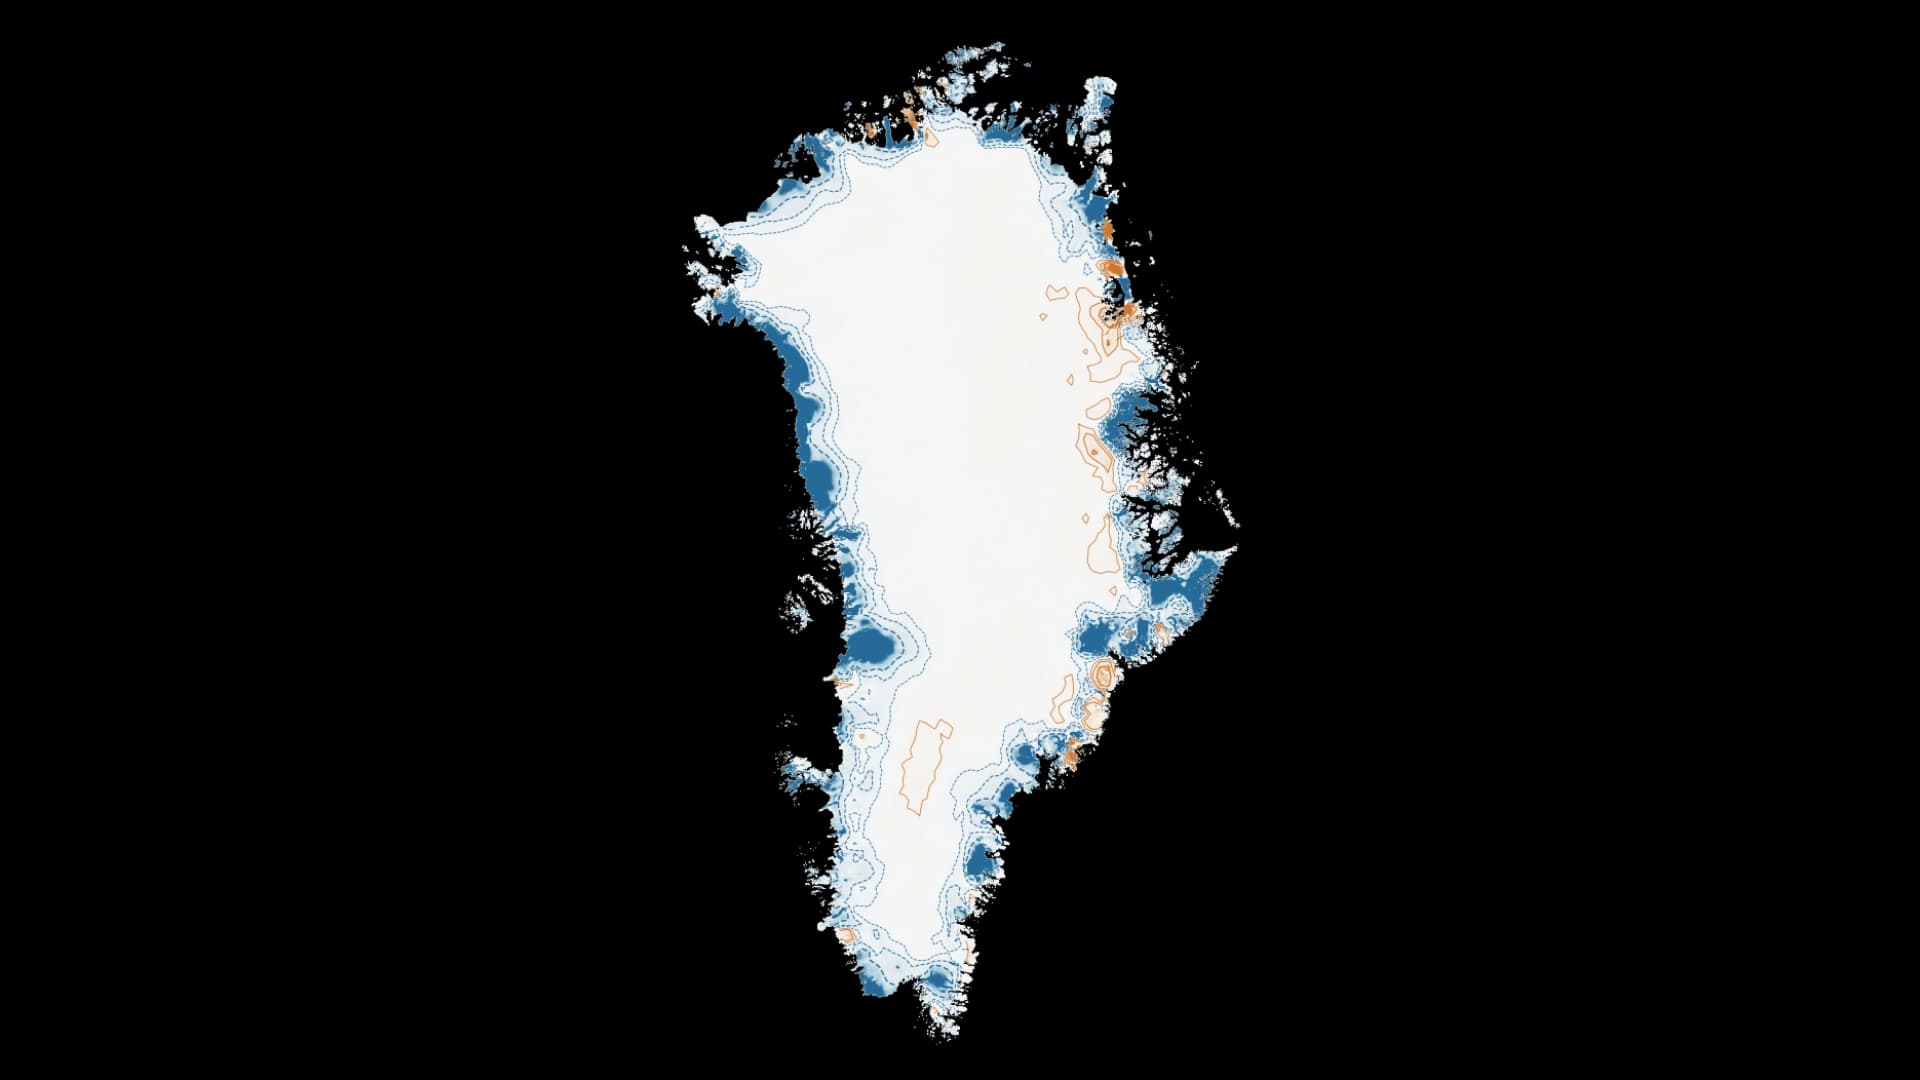
On September 22, 2026, the United States, Greenland and Denmark signed an Arctic and North Atlantic security agreement. Thirty-two annual maps show how the ice surface changed against a 1992 baseline.
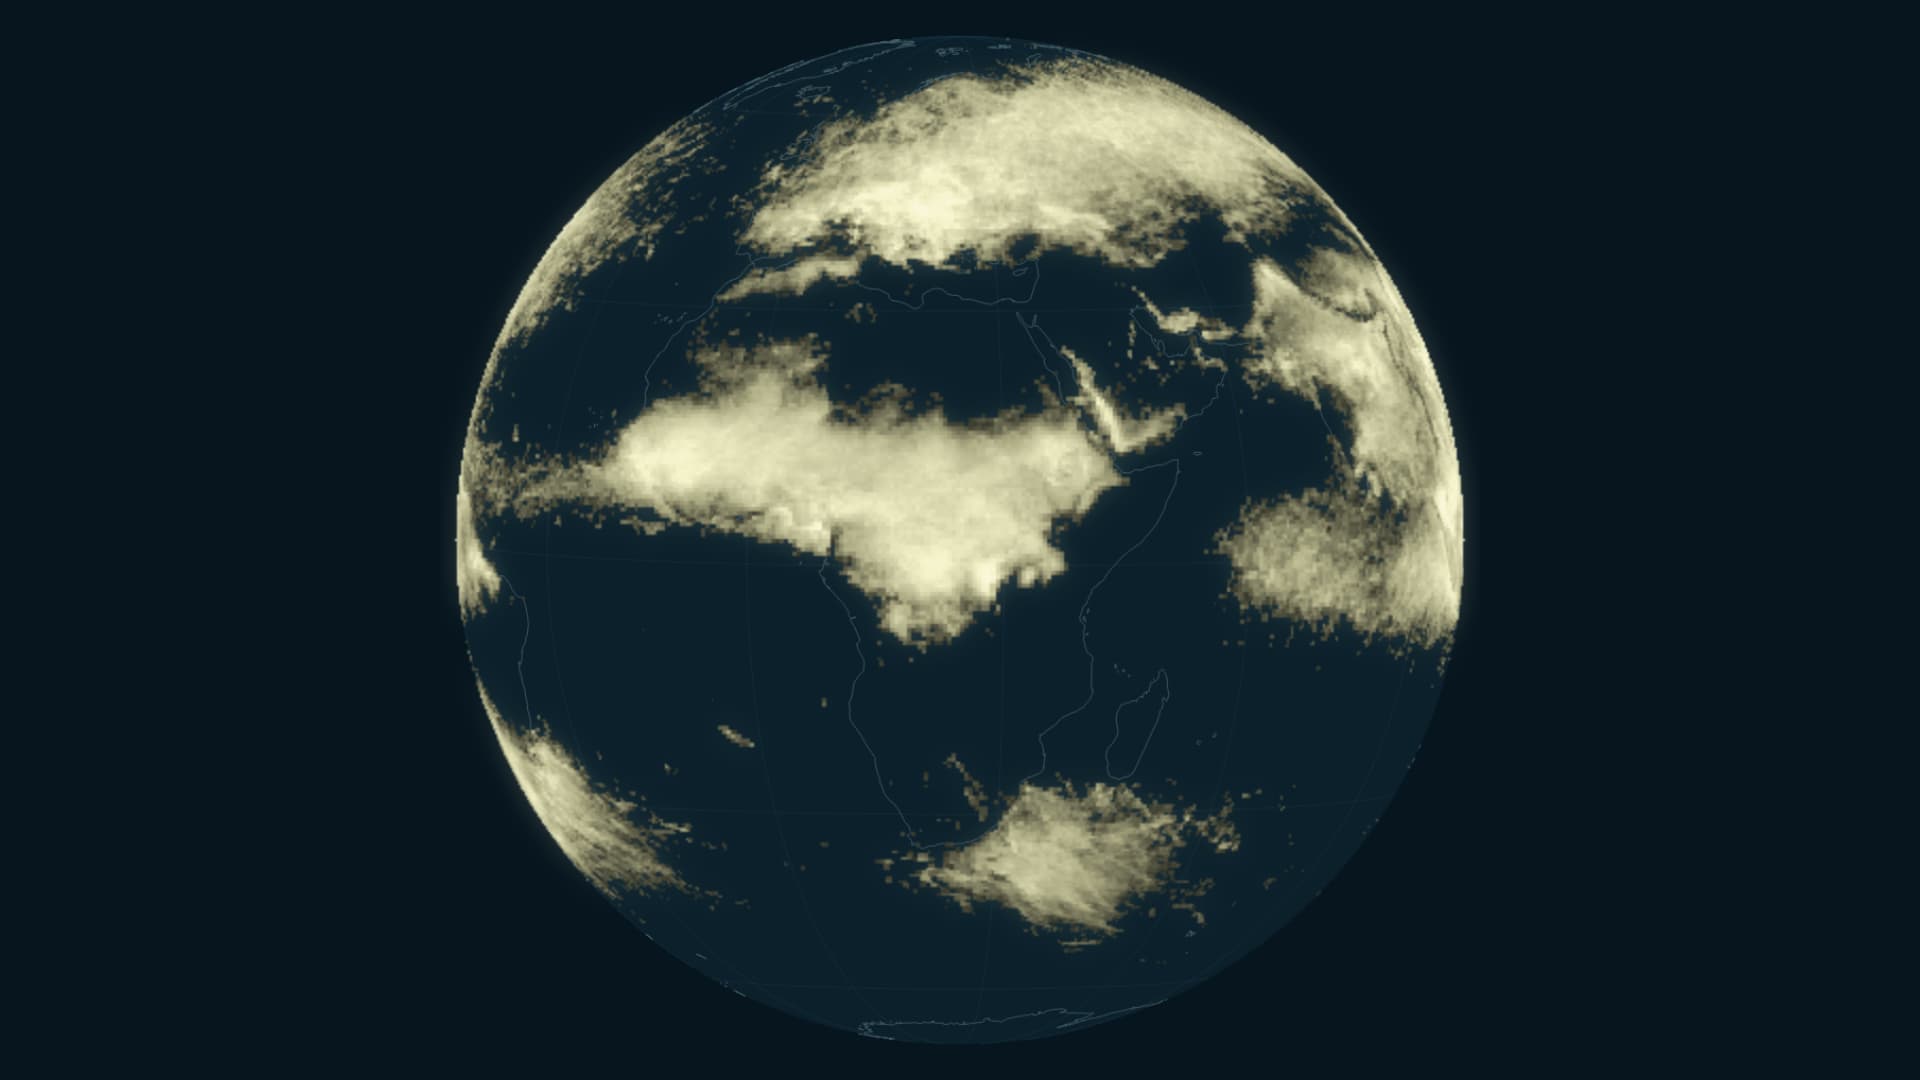
Ten years of observations turn brief flashes into a map of how activity changes through the calendar.
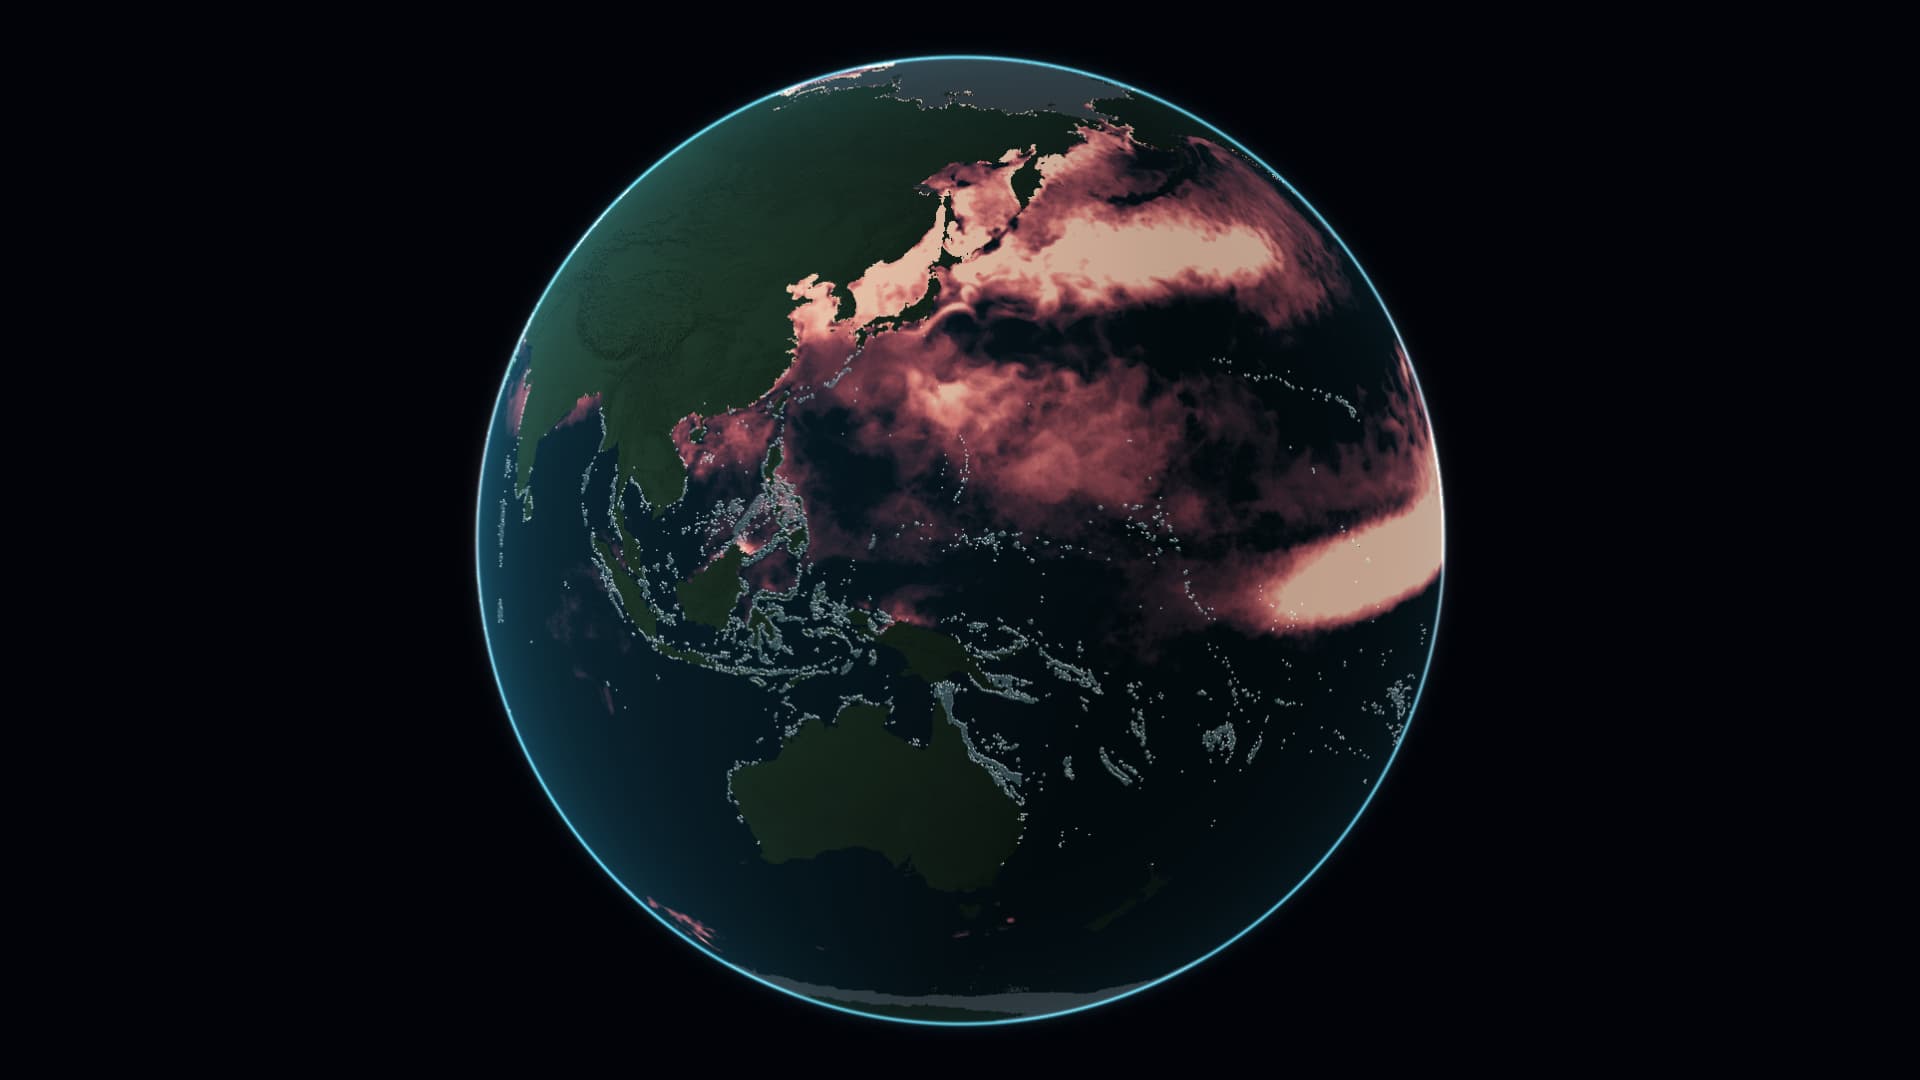
Keep reef locations visible, then overlay accumulated thermal stress during June–August 2026. A view of ocean heat that includes time.
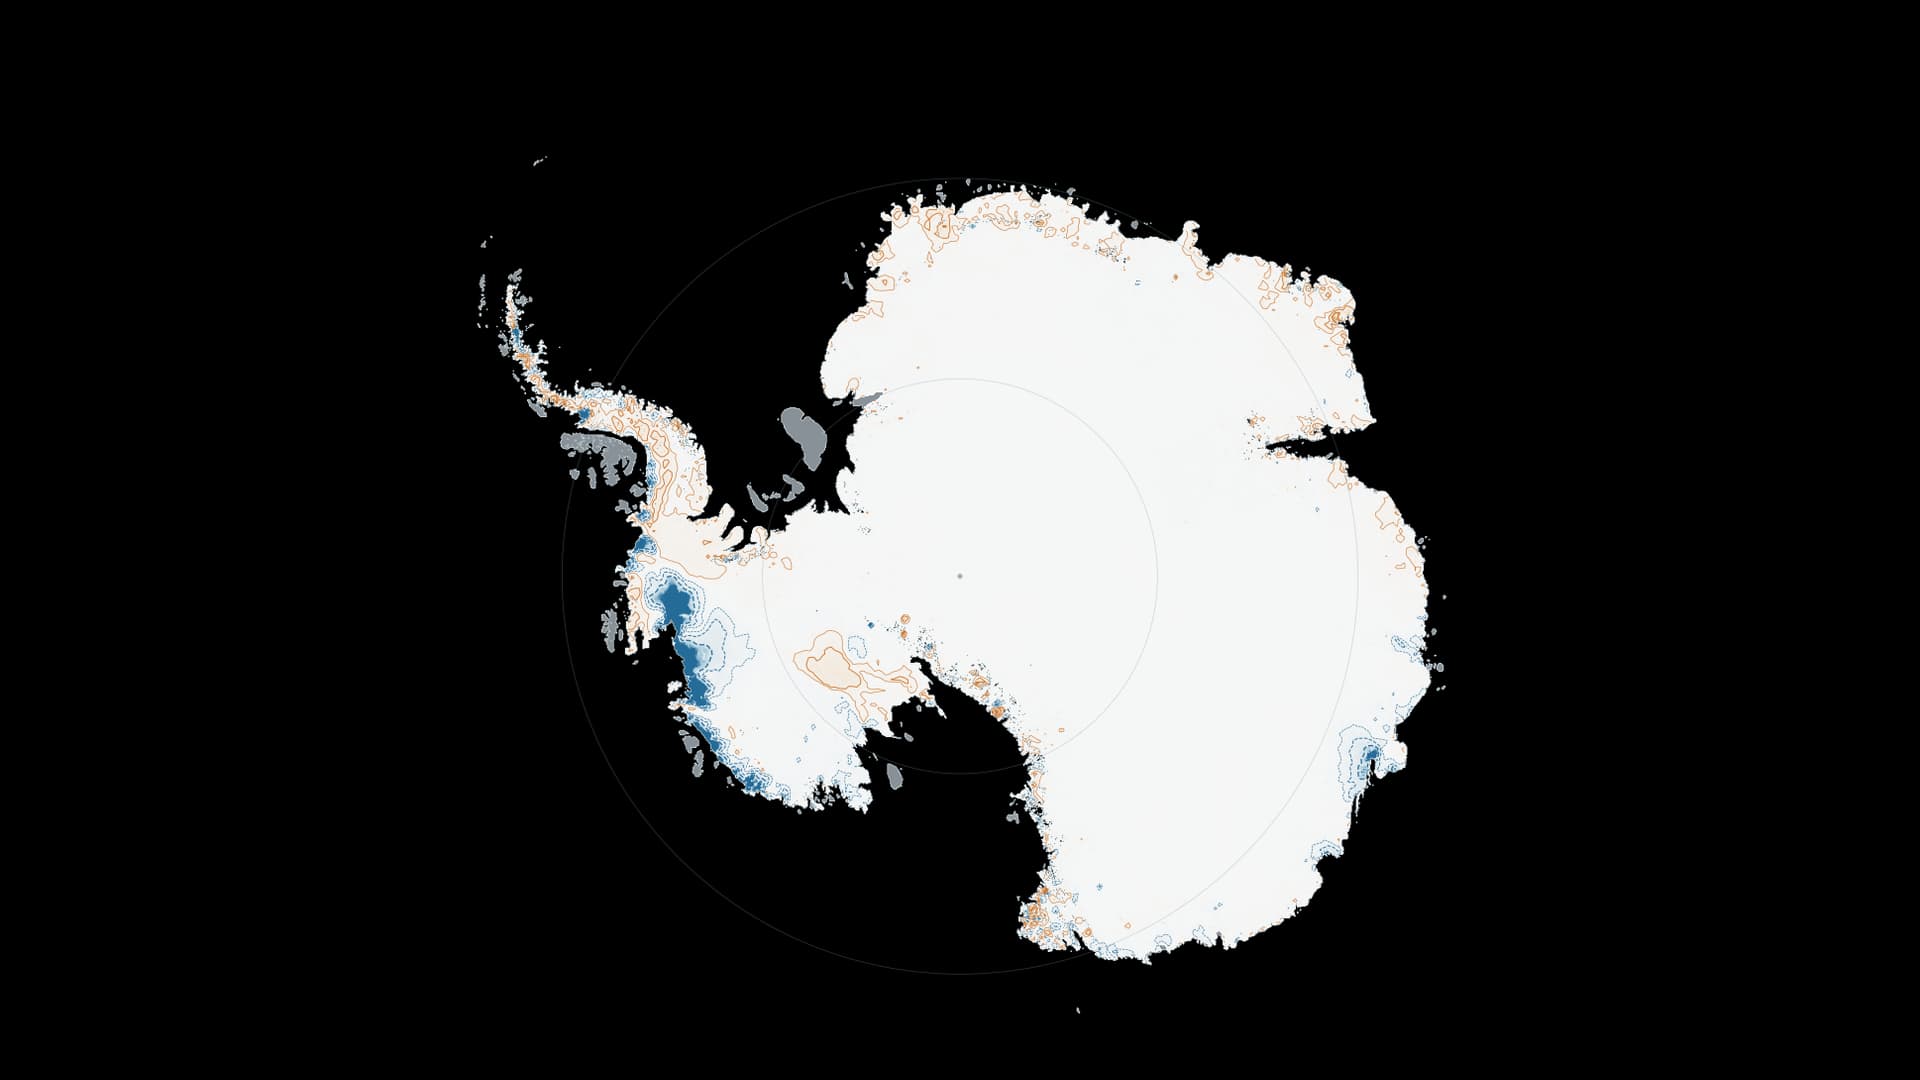
Hold the continent still, and watch its surface change. A common 1995 baseline reveals where the ice sheet has become lower or higher.
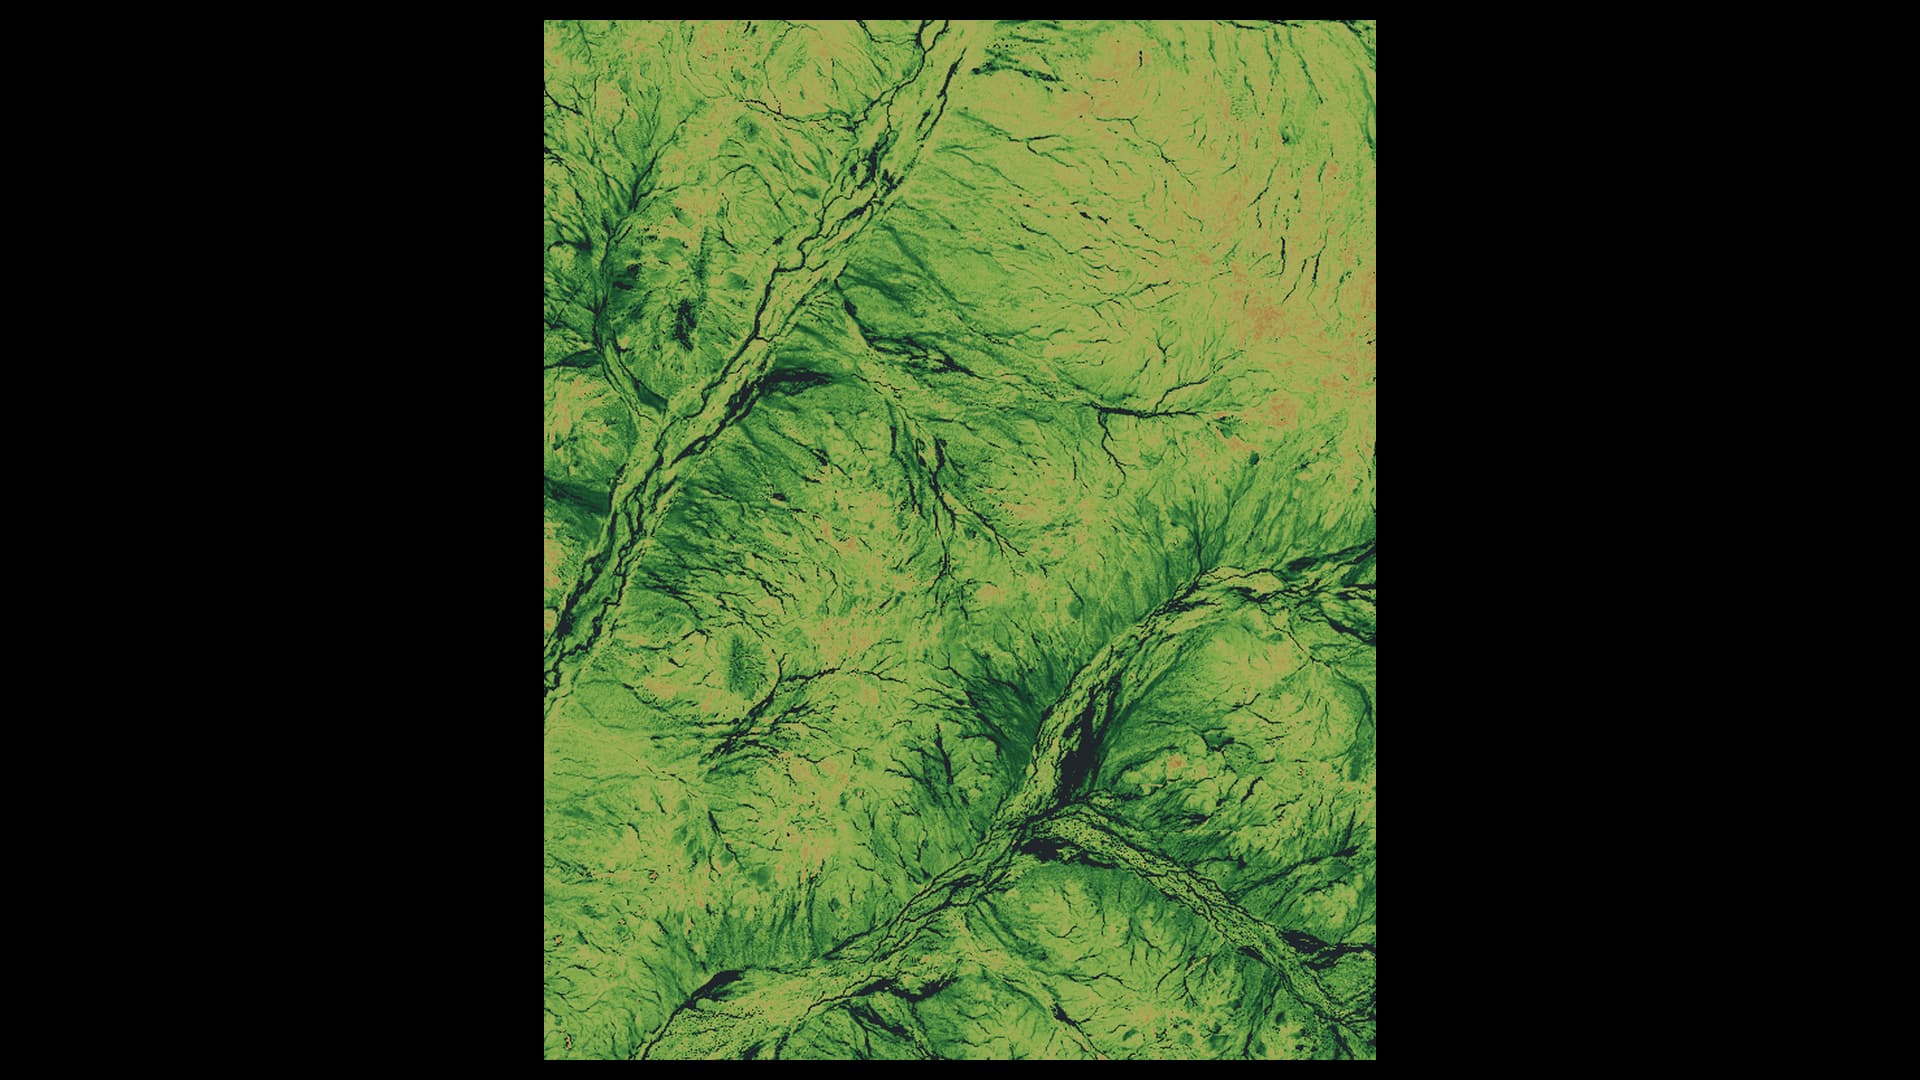
In the Murchison, seeds wait below dry ground for a flowering season. The landscape’s response in 2026 connects a distinctive place with the water conditions that a warming climate can change.
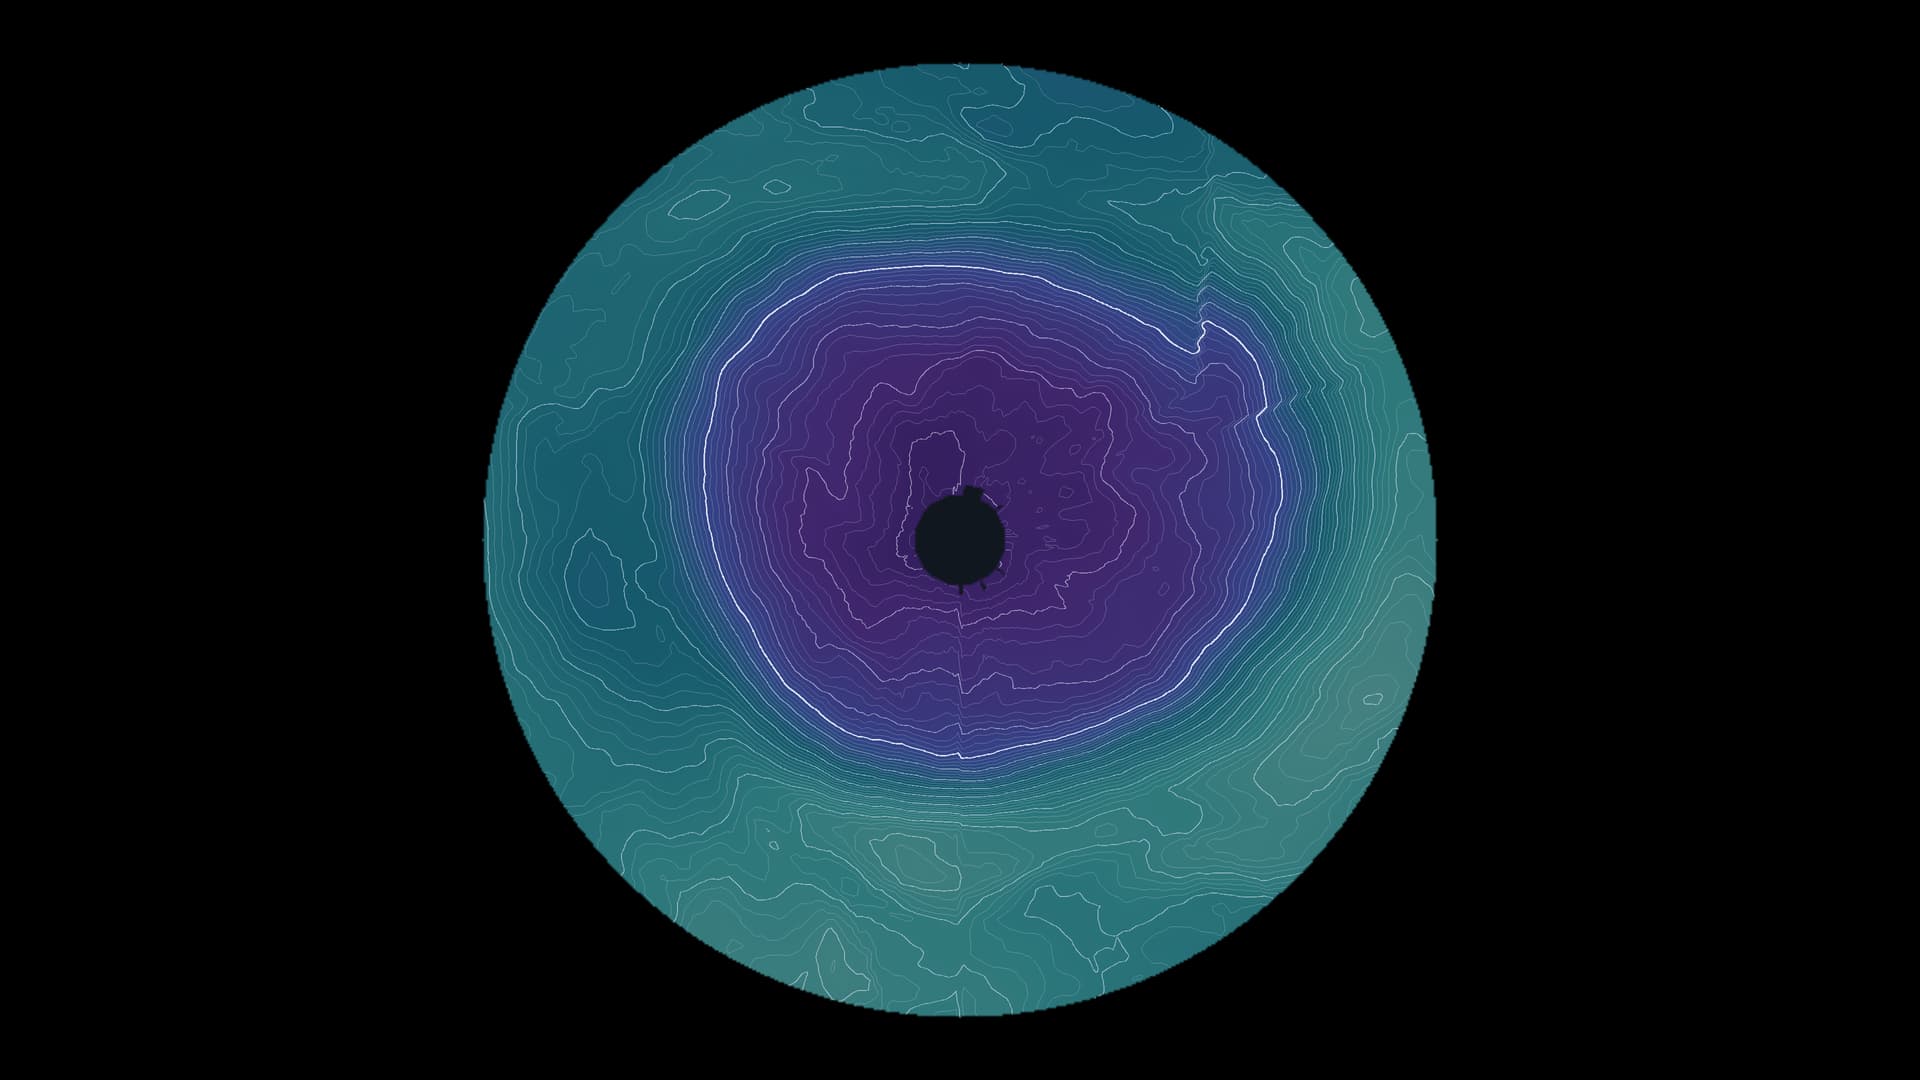
From its discovery in 1985 to international controls and today’s observations: two timescales reveal why recovery does not mean the hole has already disappeared.
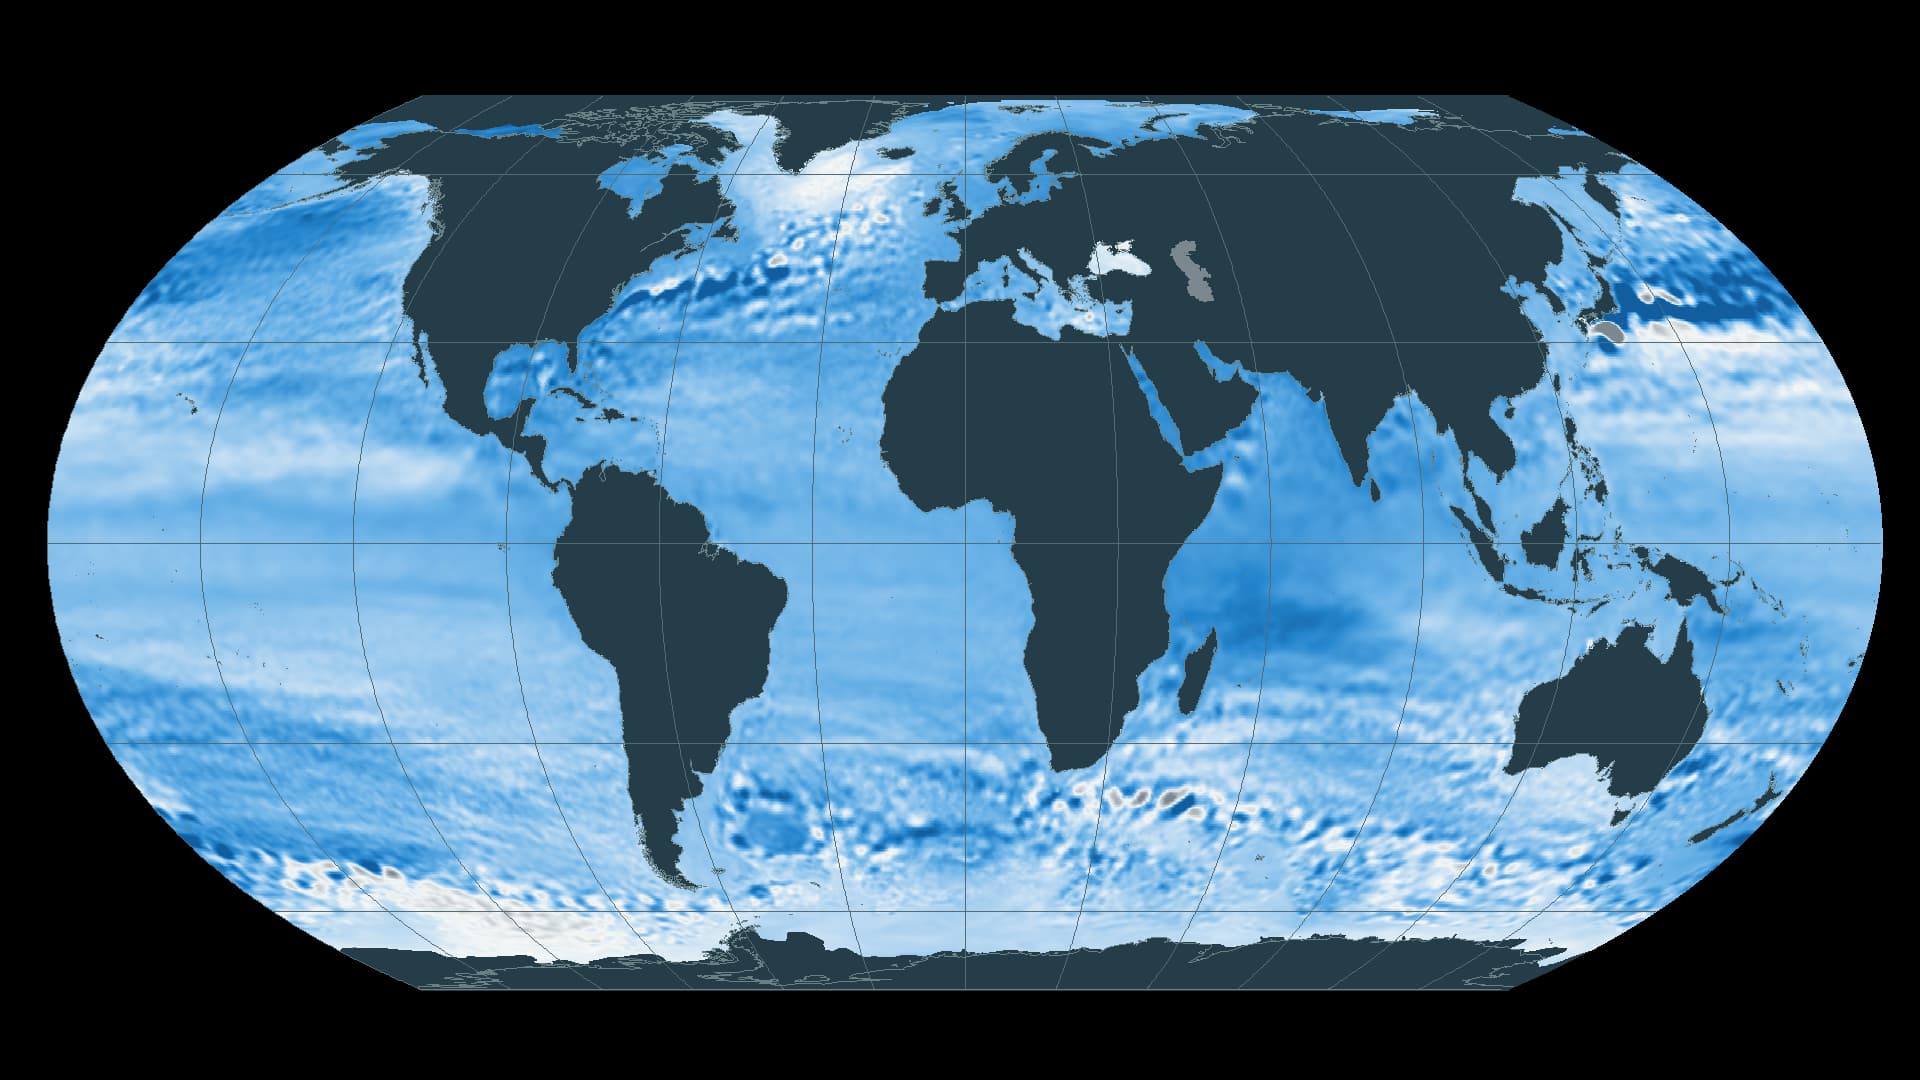
From the global ocean to groundwater, flood barriers and roads, three cities show how sea-level rise changes the conditions of everyday life.
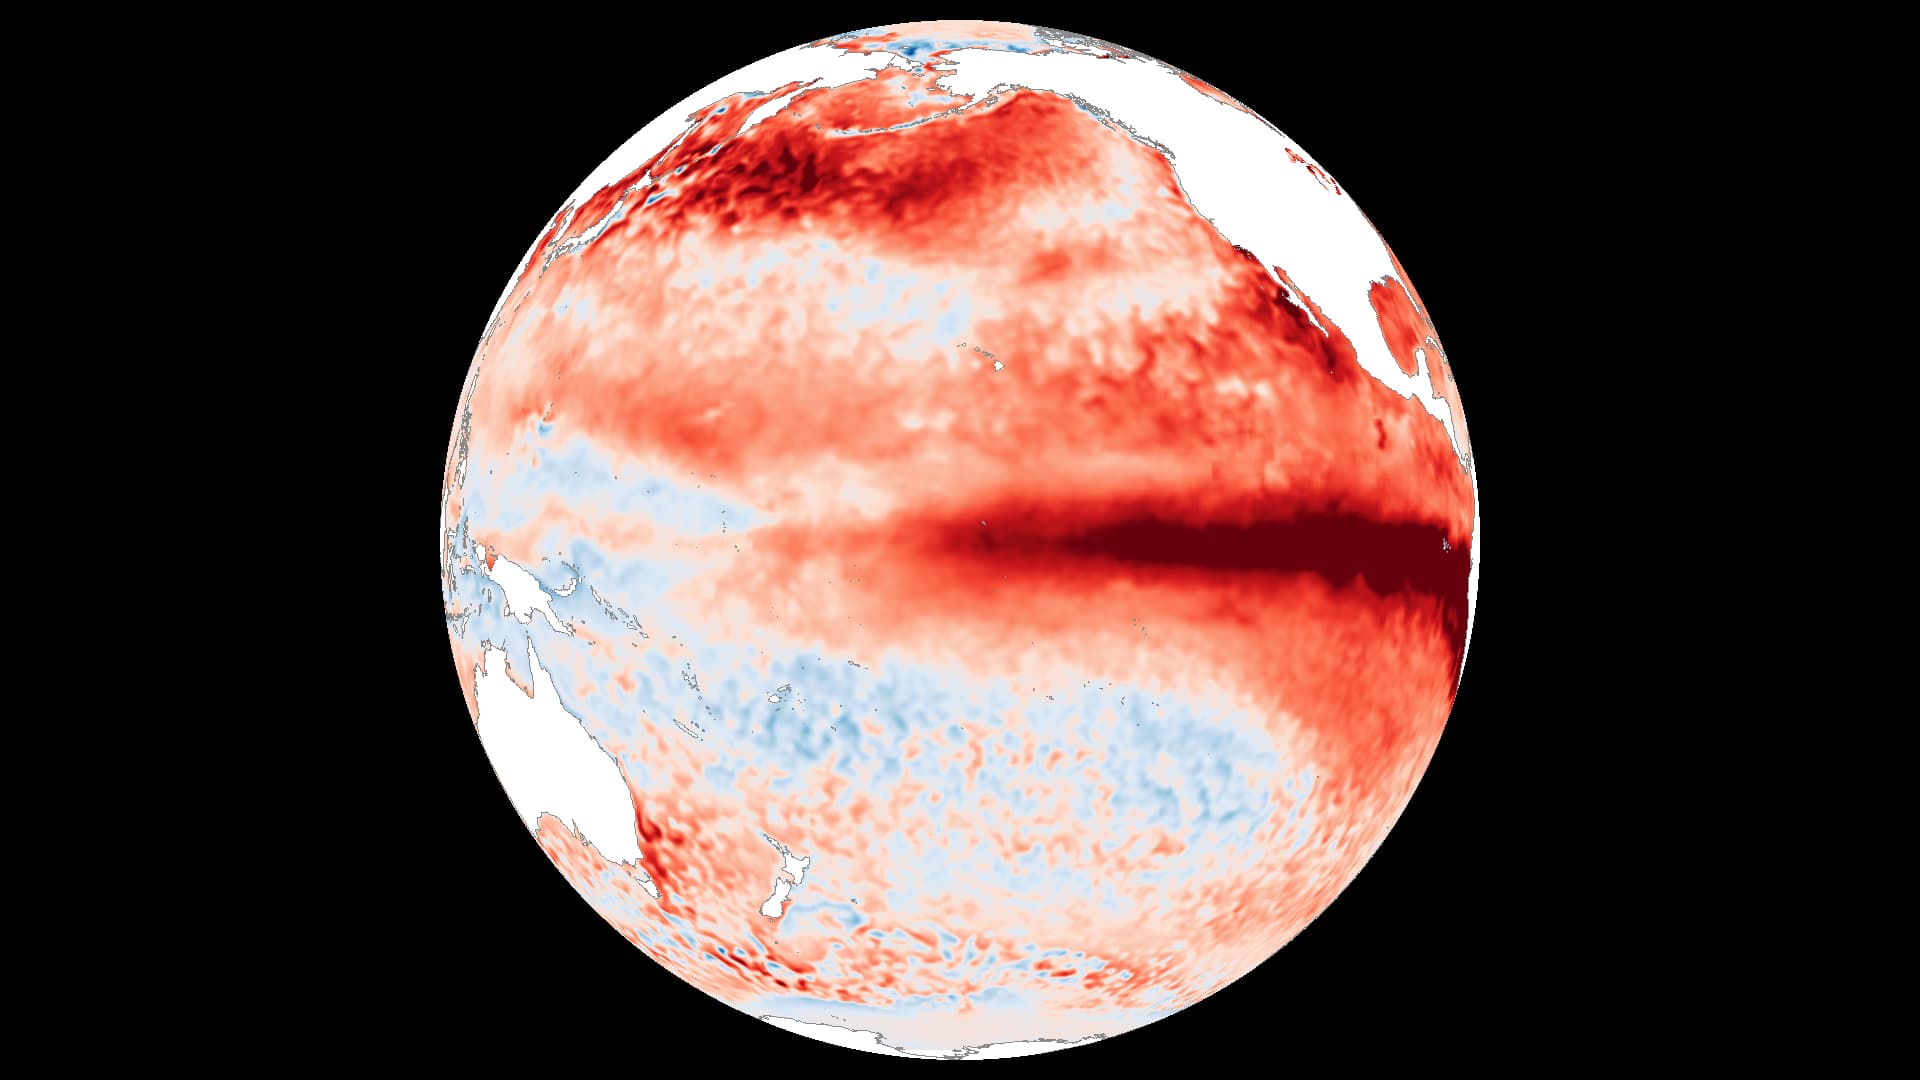
NOAA puts the chance of a record-strength El Niño in October–December 2026 at 75%. Three temperature maps show how the Pacific is changing.
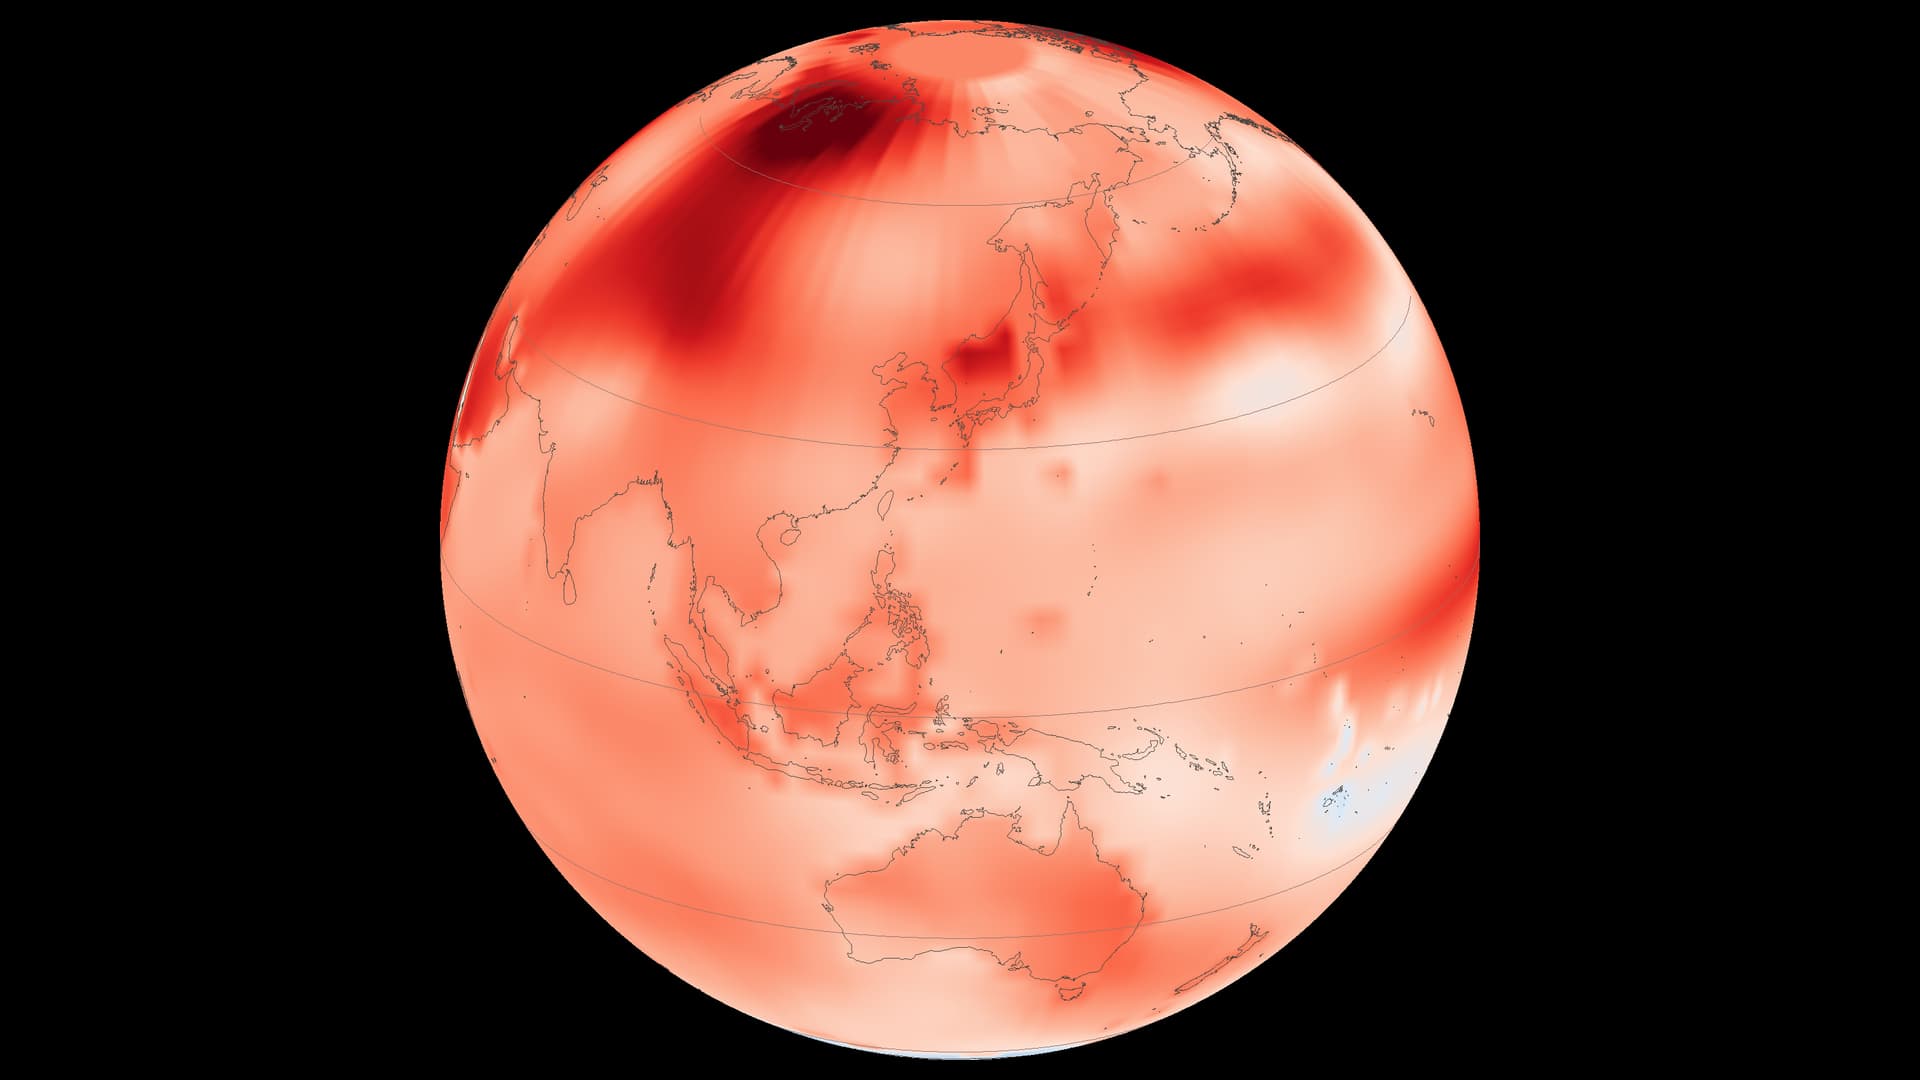
June–August 2026 set a global record in NASA’s temperature series. The geography behind that average tells a more varied story.
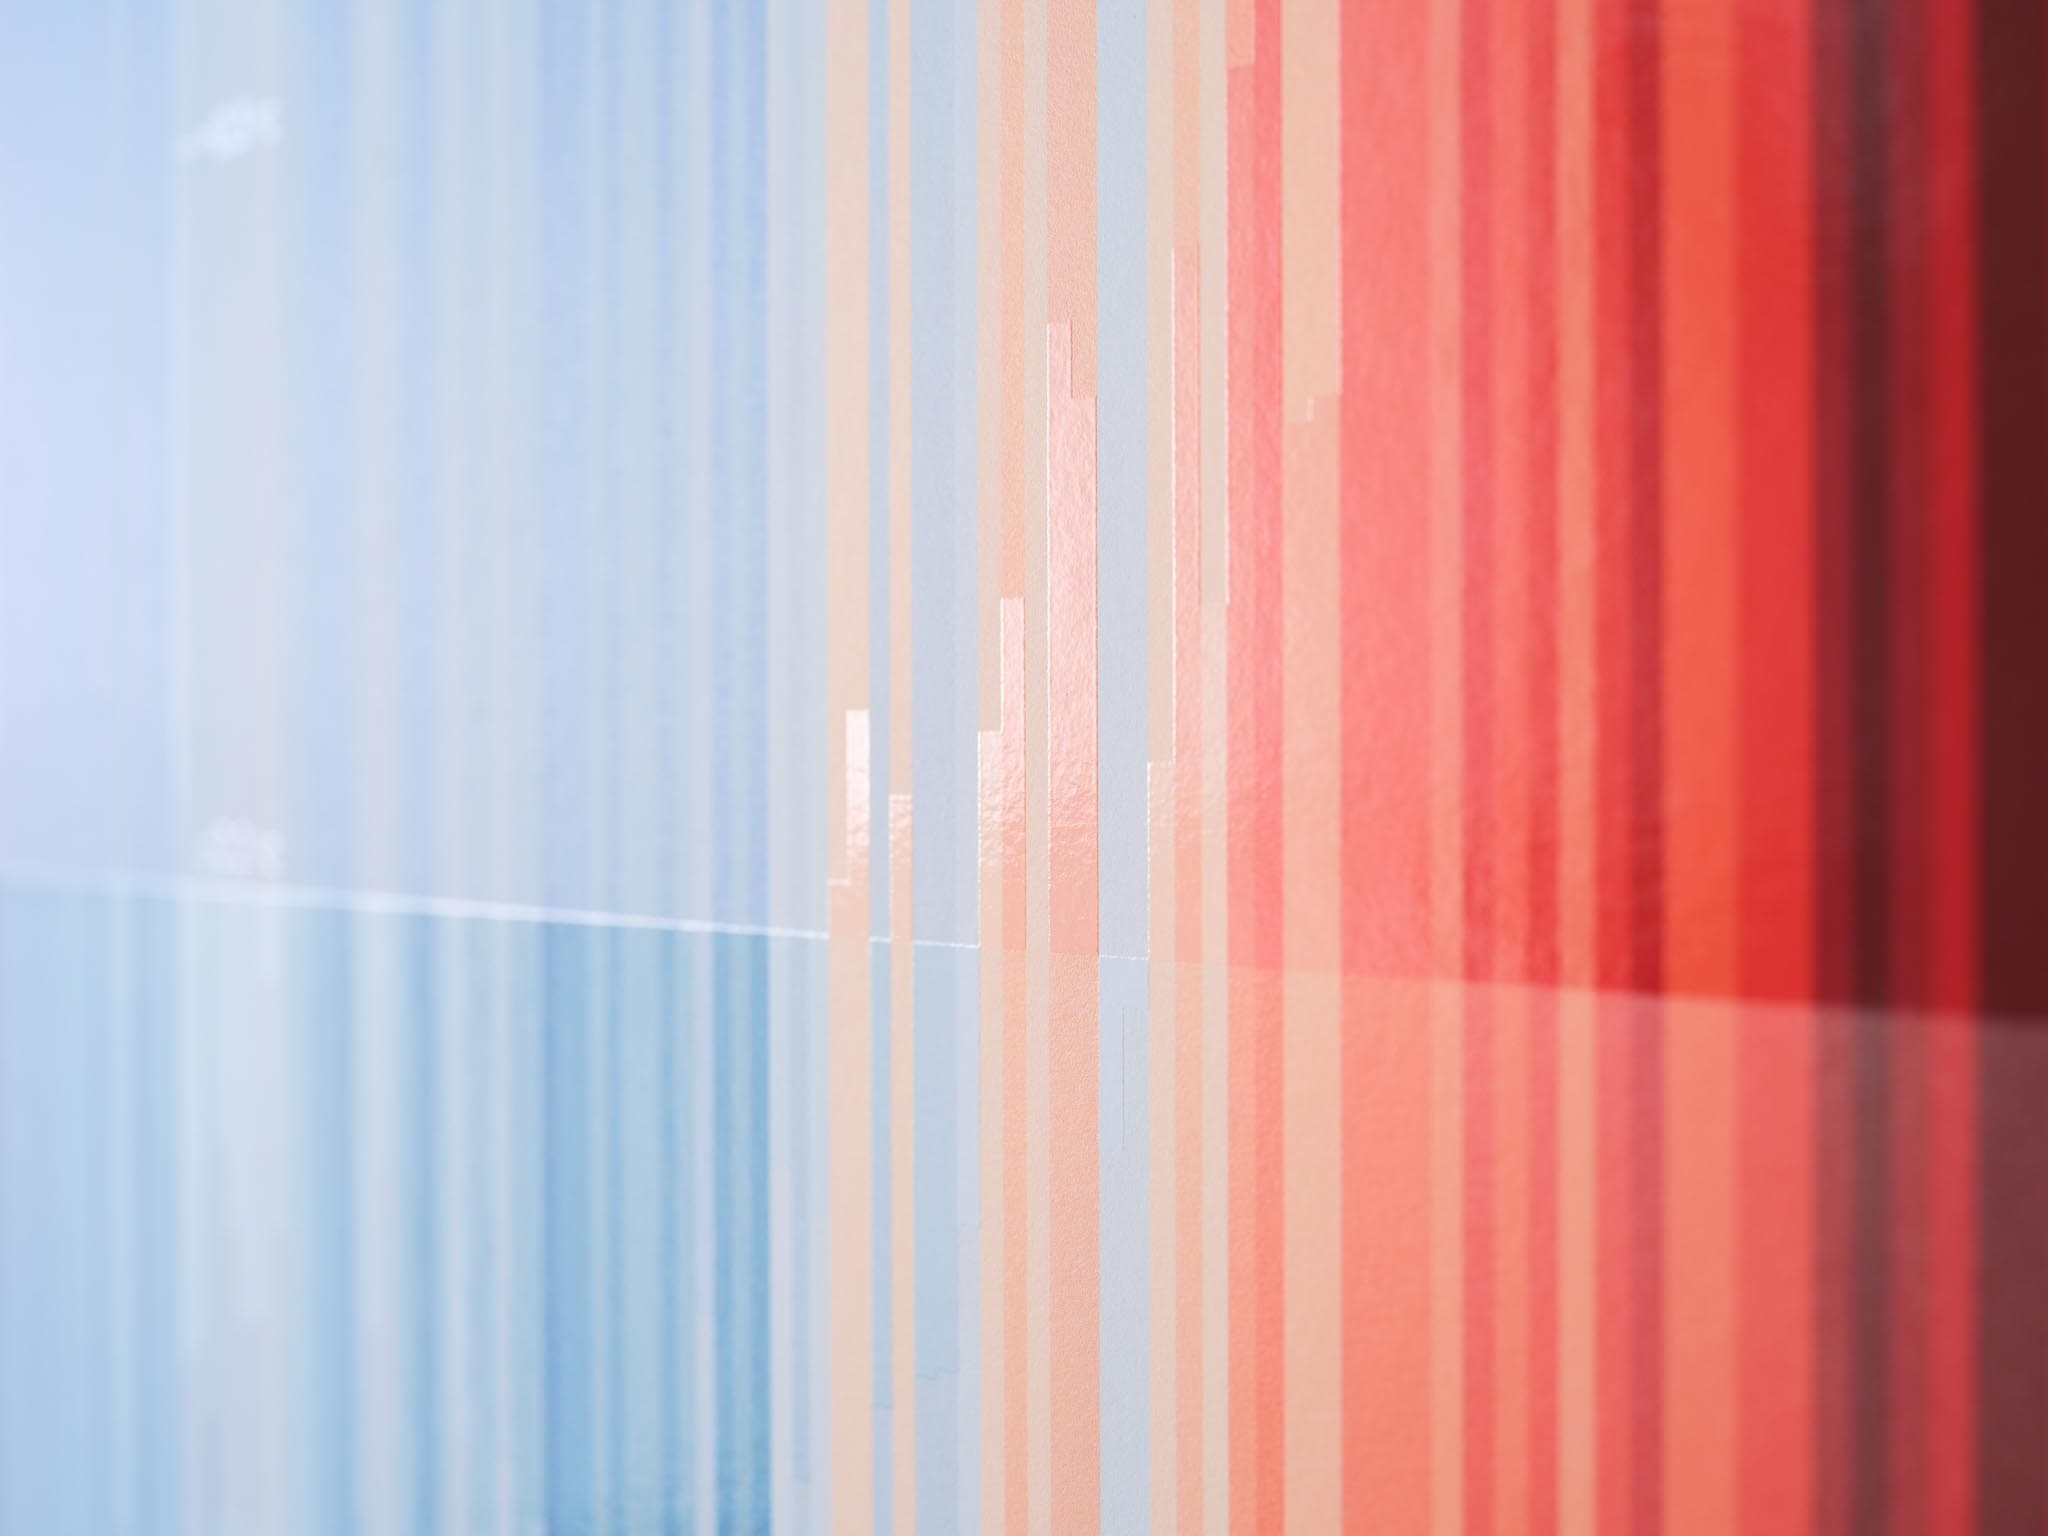
Now that climate change sits among the central concerns of international society, we can return to a simple question — how did human beings come to read the atmosphere as a system?
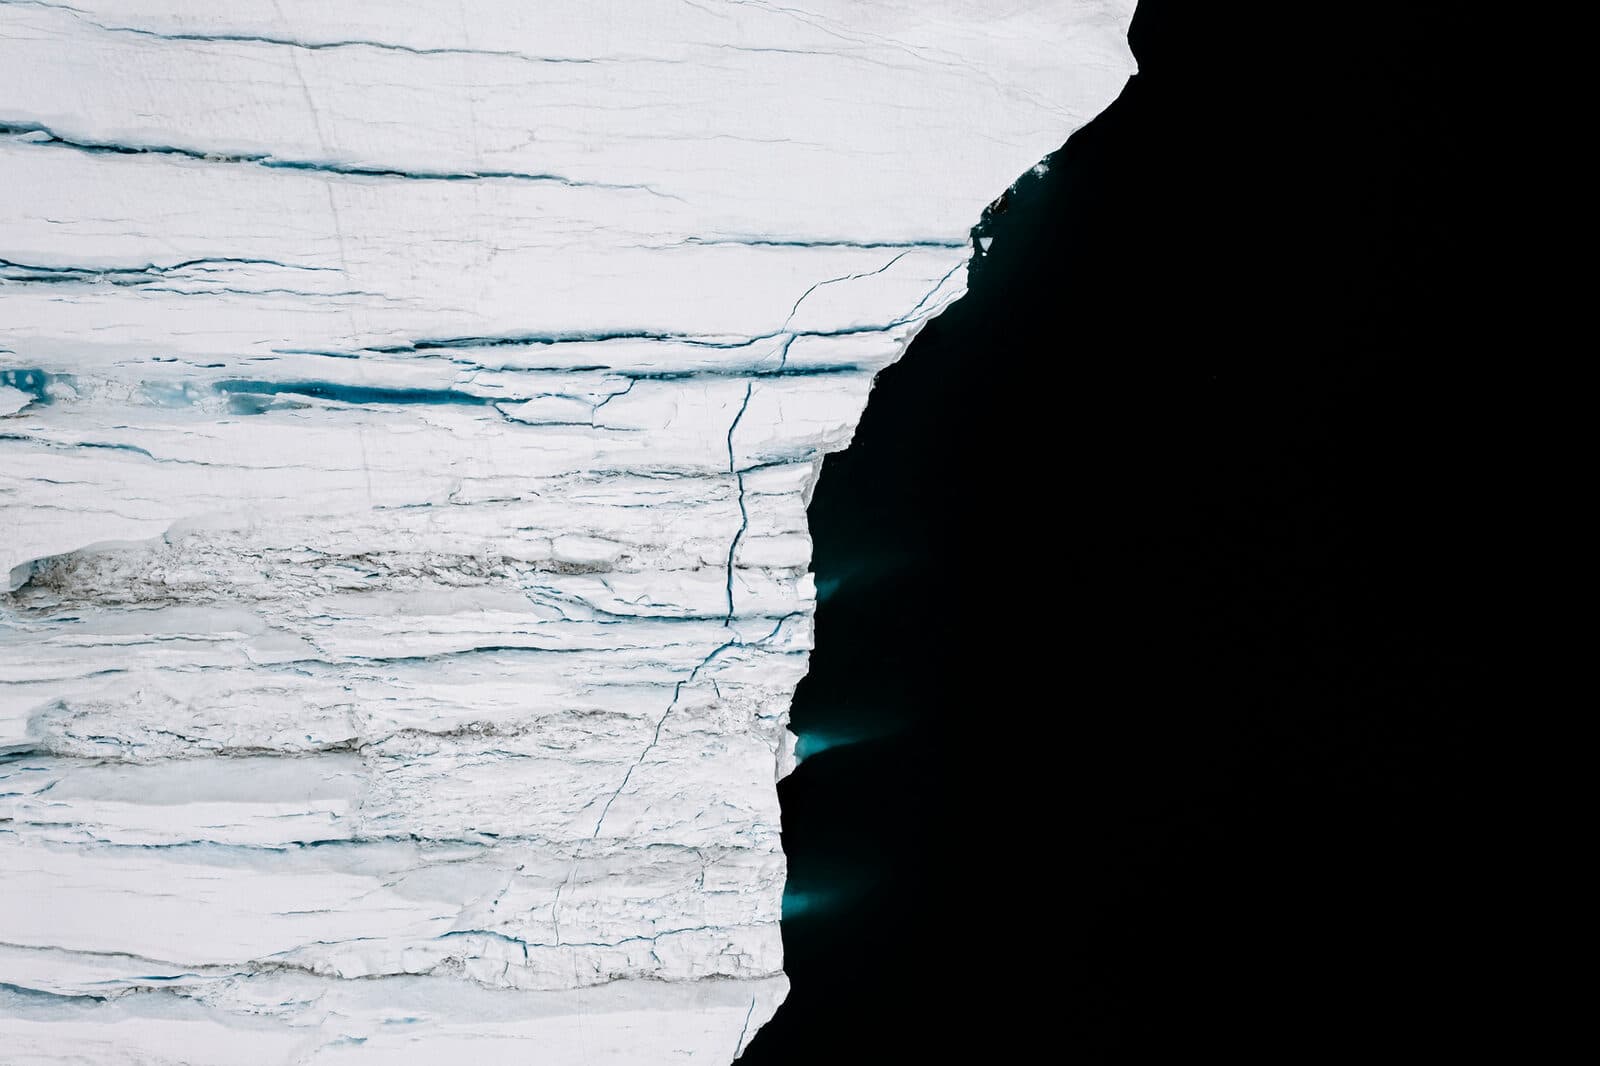
With only a small temperature change, sea ice might exist — or it might not. The fate of arctic ice will profoundly impact the interconnected networks of life on Earth.
Updates from SORAH, a few times a month.