Watch the same globe across six forecast months, from autumn 2026 to spring 2027. The places leaning wetter or drier change with the season.
Watch the same globe across six forecast months, from autumn 2026 to spring 2027. The places leaning wetter or drier change with the season.
In September 2026, the World Meteorological Organization described an El Niño expected to influence weather into 2027. Yet the name of a climate event does not tell us how much rain a particular place will receive. Season and geography still matter. WMO · El Niño outlook, September 2026
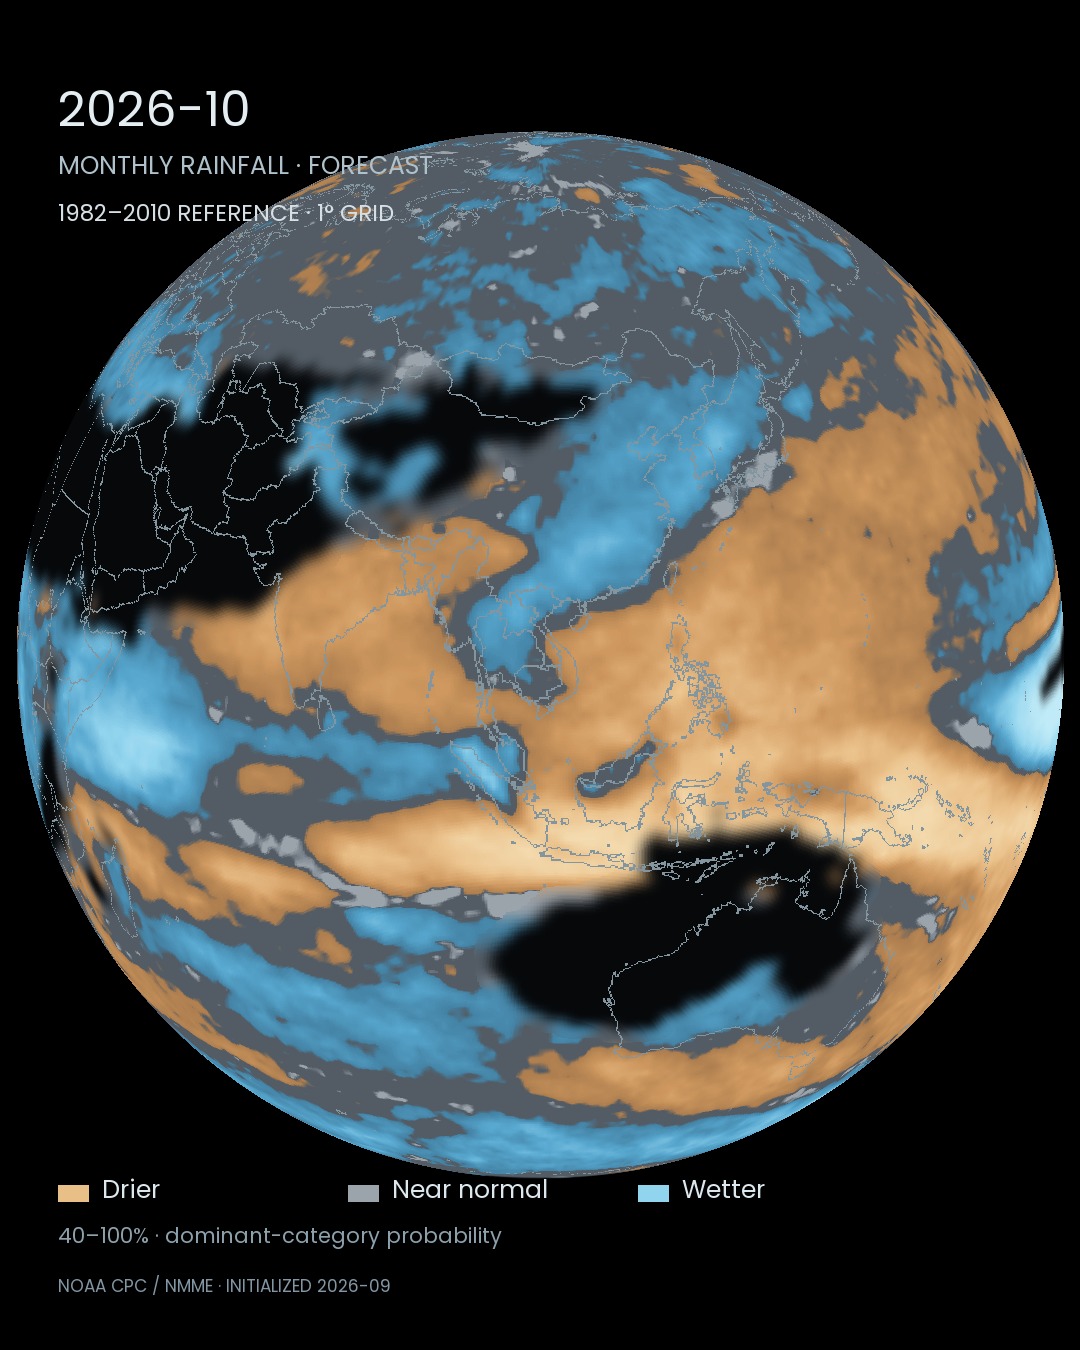
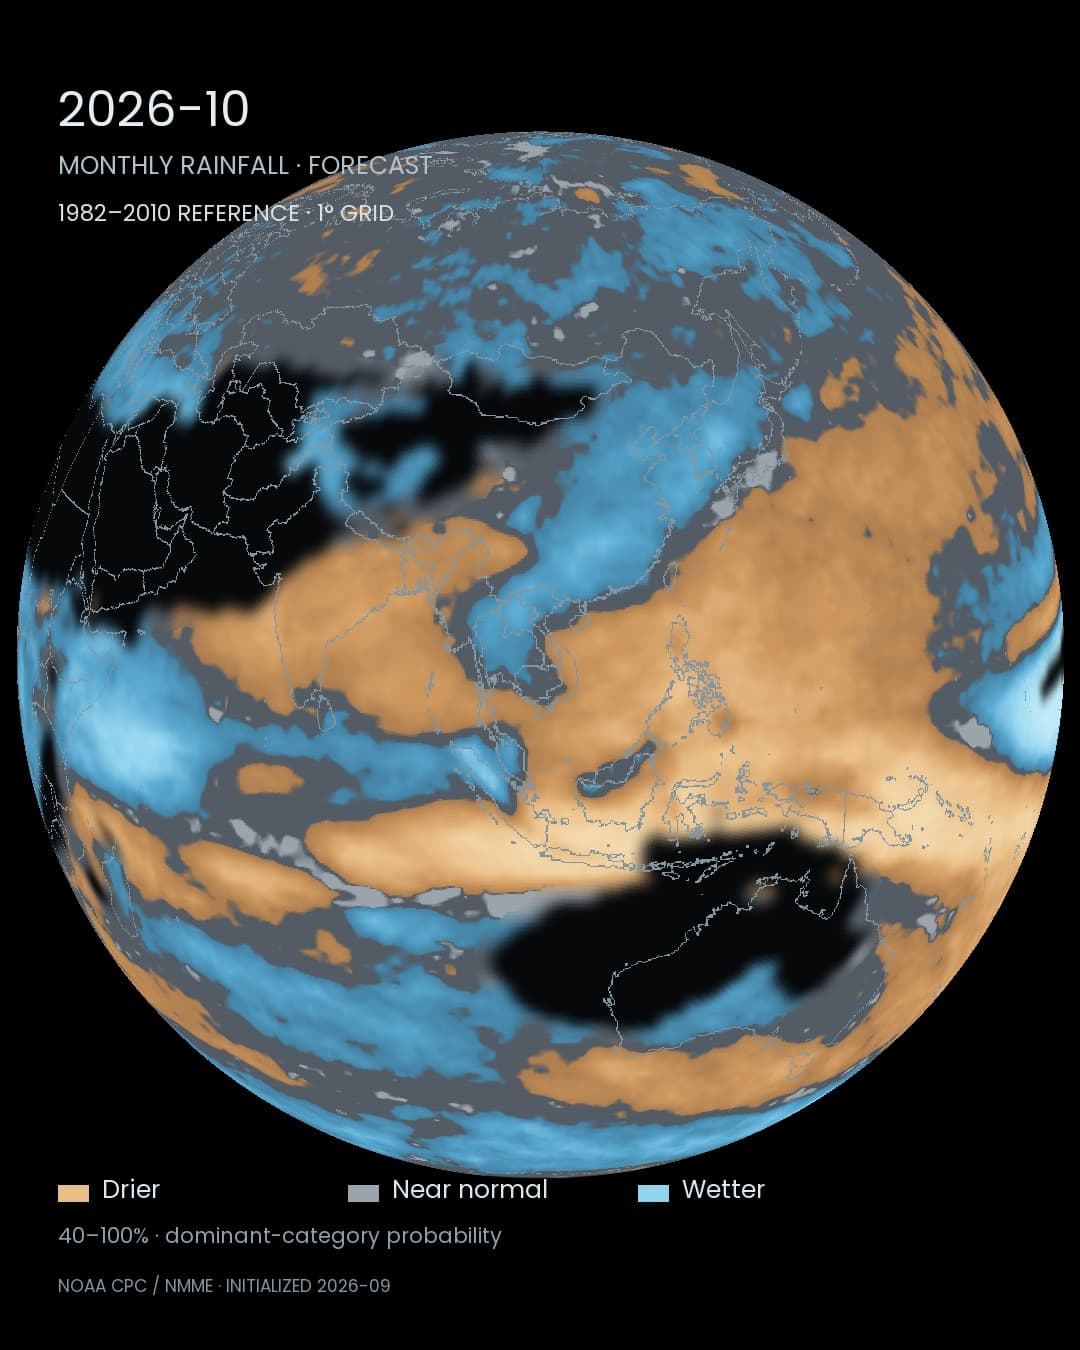
October 2026 rainfall probabilities. Amber indicates the below-normal category; blue indicates above-normal. All six months share the September 2026 initialization.
A direction of change, rather than a volume of rain
These monthly outlooks come from NMME, a North American multi-model ensemble published by NOAA’s Climate Prediction Center. They assign probabilities to below-, near- and above-normal rainfall categories, using 1982–2010 hindcasts as the reference. NOAA CPC · NMME NMME · Probability forecastsA blue patch does not mean the same rainfall total everywhere. A wet region and an arid one have different local normals. The common question is how each place leans relative to its own reference climate.
Near Jakarta, the balance reverses
At the original grid cell at 107°E, 6°S, near Jakarta, October probabilities are 78% below normal, 19% near normal and 3% above normal. By March they are 10%, 17% and 74%. Within the same forecast initialization, the dominant category reverses with the season. This is one 1° cell, not a forecast for an entire city.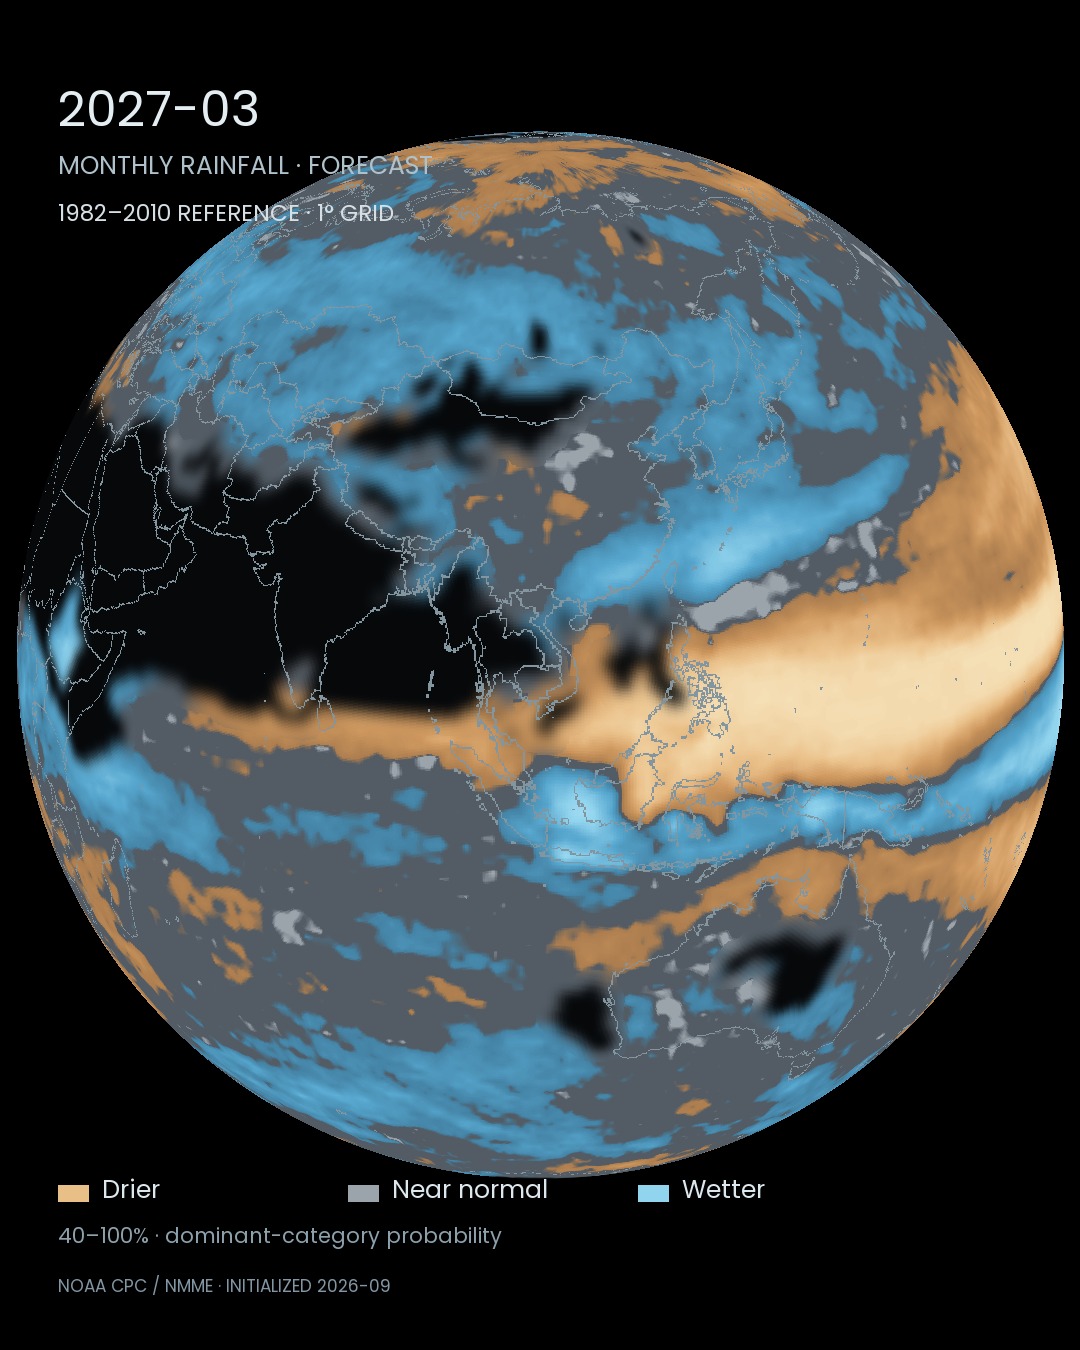
March 2027, with the same camera and colour meanings. Explore all three probabilities at a location in Data Scape.
Keep the differences in view
Other ocean and atmospheric conditions also shape rainfall; this map does not isolate El Niño’s contribution. Nor are these flood or drought probabilities. They describe monthly rainfall categories. WMO · El Niño outlook, September 2026 NMME · Probability forecastsWater use, planting and travel all unfold across seasons. Comparing months opens a more useful question than labelling the whole year wet or dry: where does the balance change, and when?
Data and representation
Unadjusted NMME probabilities initialized September 2026, for October 2026–March 2027. Original 1° cells; smoothed display, nearest-original-cell readouts. Dominant categories at 40% or above are shown, with a gradual threshold fade. Grey means no dominant category, pale grey near-normal and black missing. Rounded probabilities may not sum to 100%.Sources
Author
SORAH Editorial
October 5, 2026