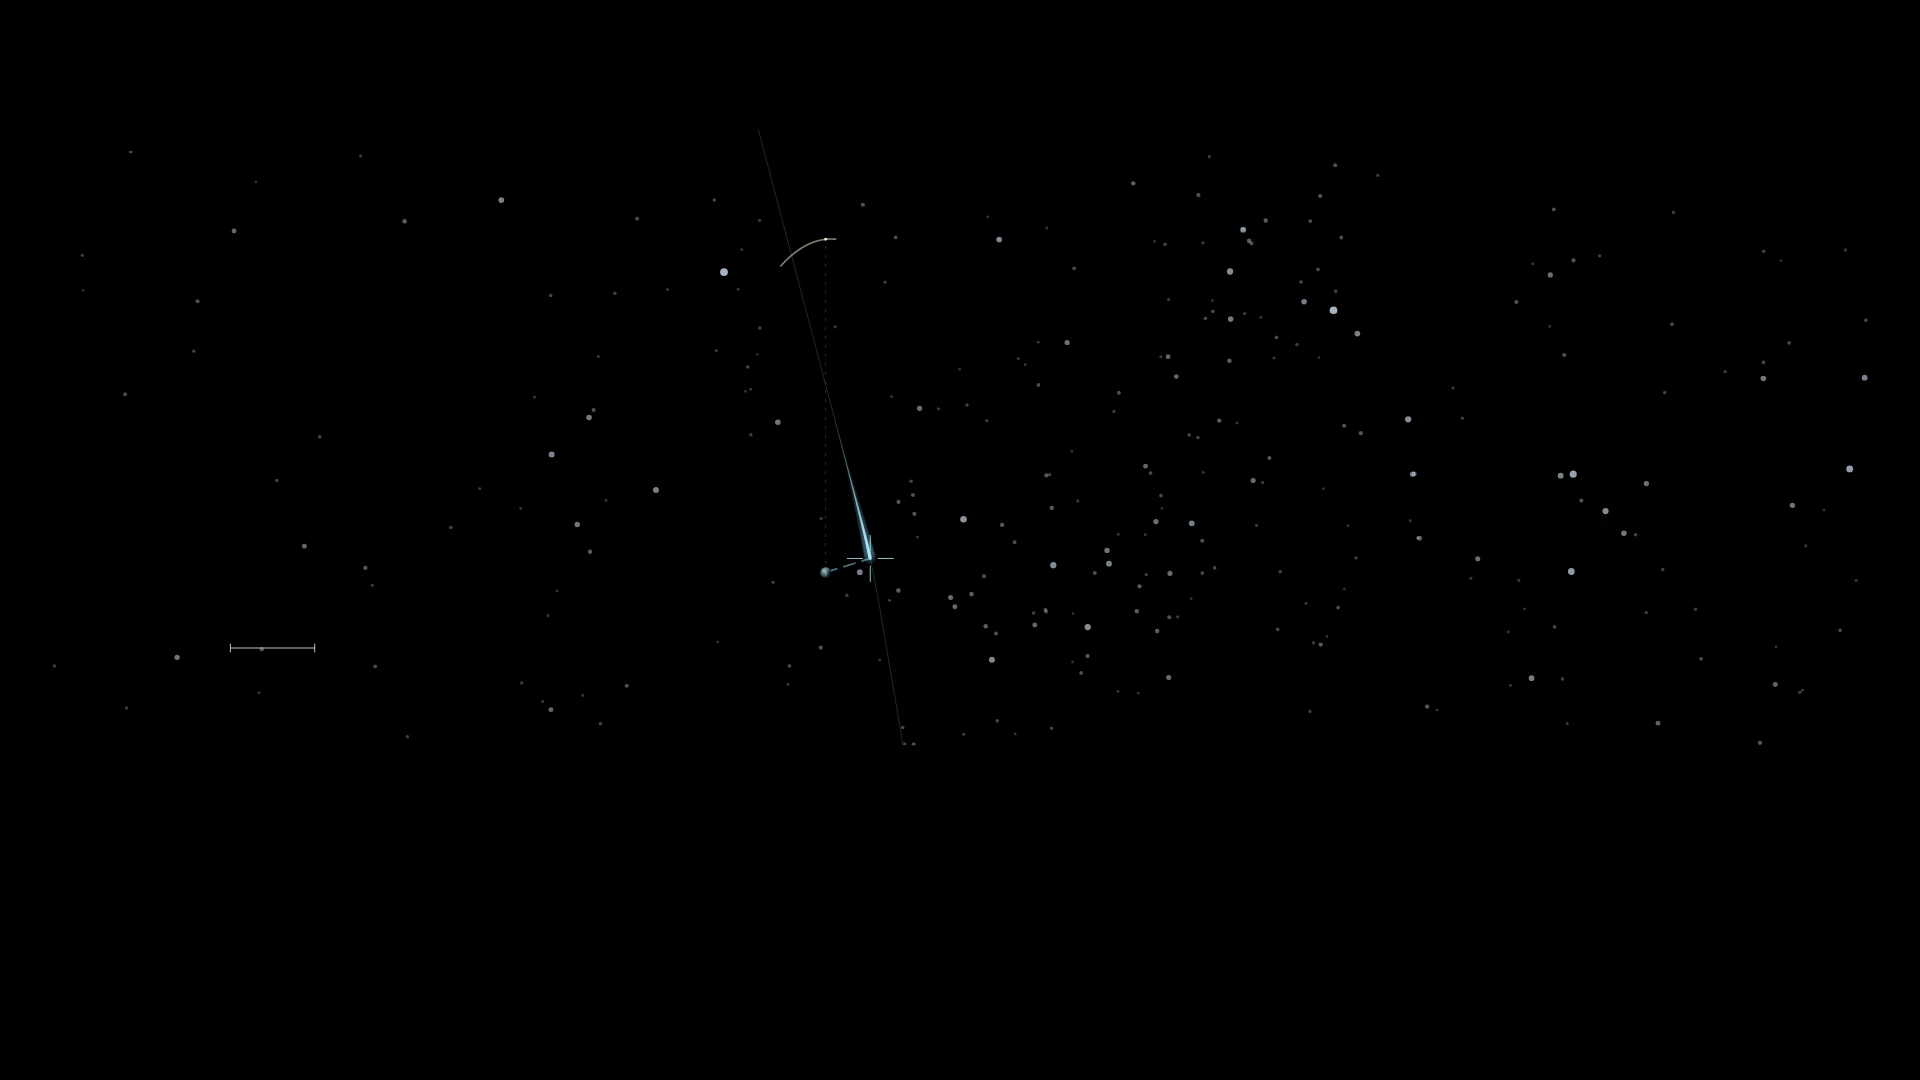
Asteroids repeatedly pass near Earth — measuring an approach against the Moon
Small bodies repeatedly cross inside the Moon’s distance. The passage of 2026 TN77 connects that scale and motion with the observations that reveal an orbit.

Stories from the boundary between art and data.
Small bodies repeatedly cross inside the Moon’s distance. The passage of 2026 TN77 connects that scale and motion with the observations that reveal an orbit.
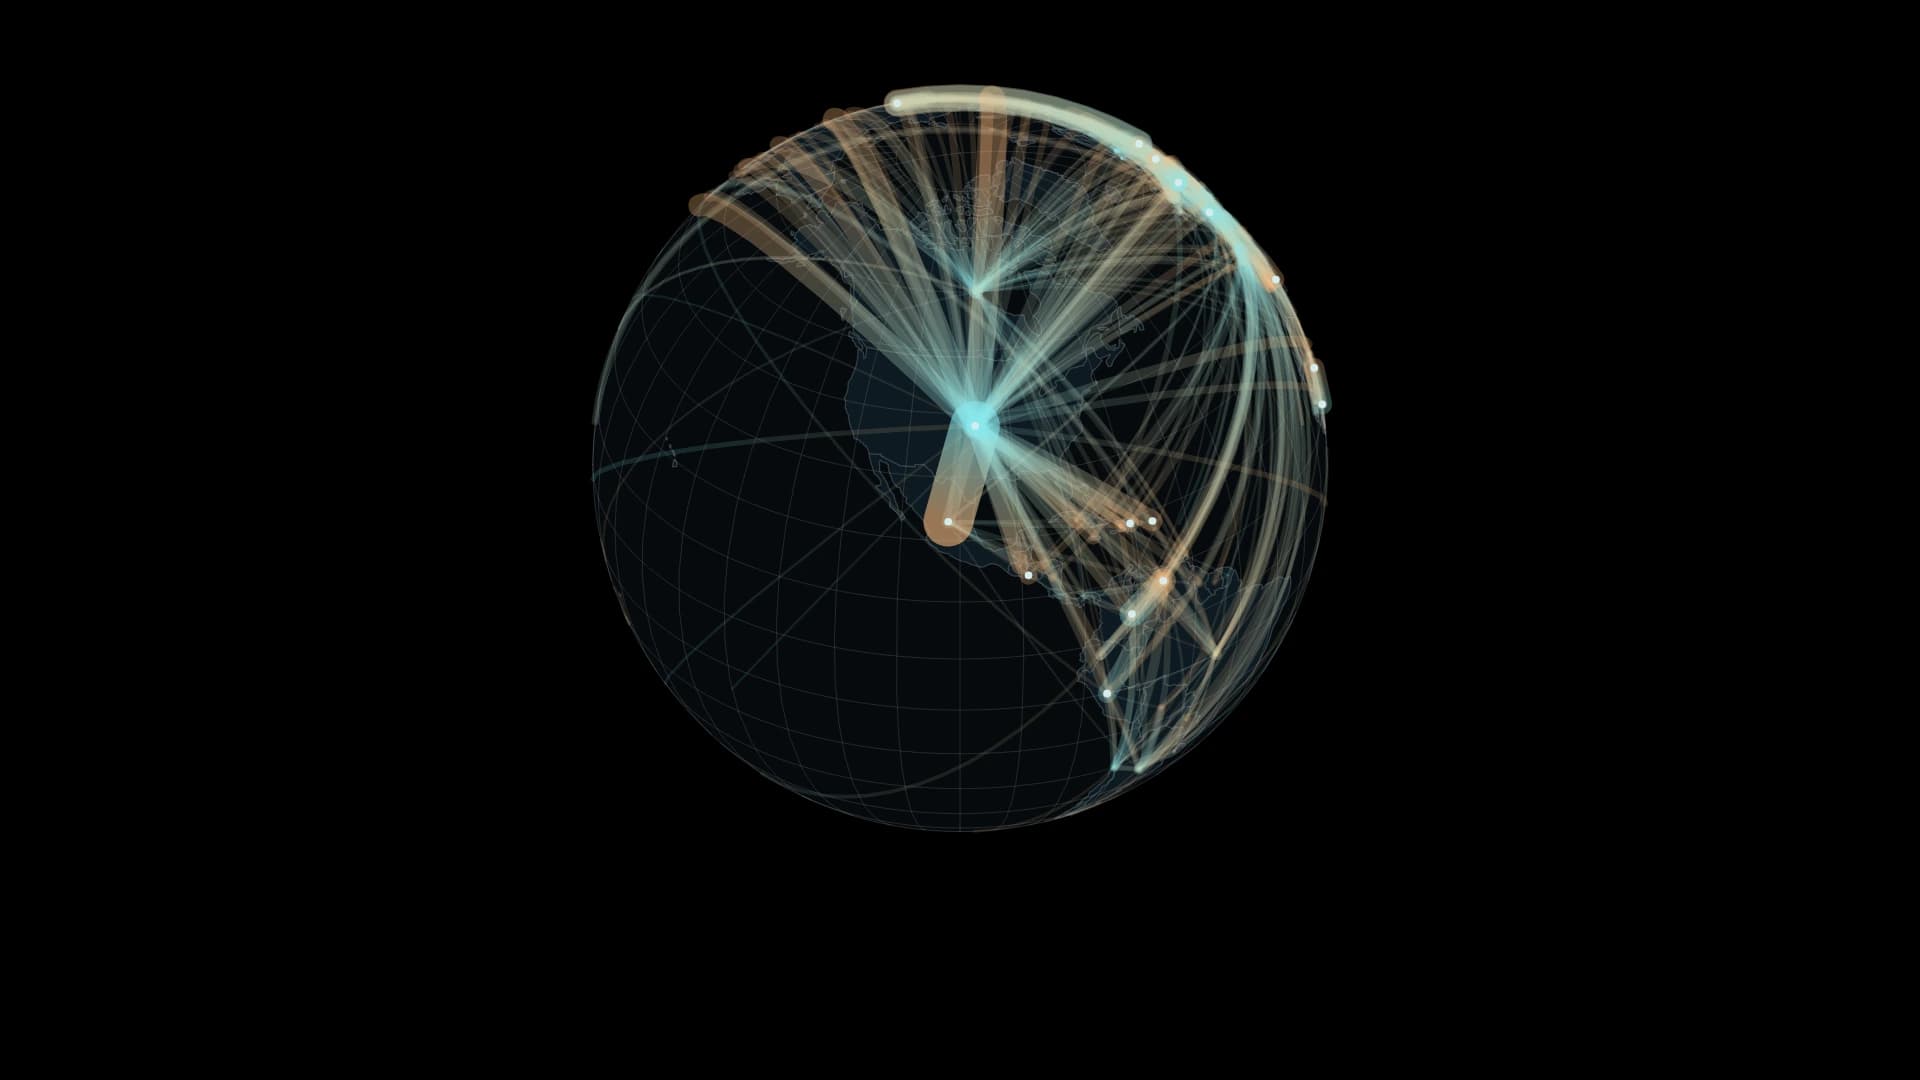
Not a journey in progress, but a record of where people live.
A record of 4,373 detections connects shapes on the sea to the work of observing and investigating them.
Track contraction and recovery along the same coast from September 2017 to September 2024.
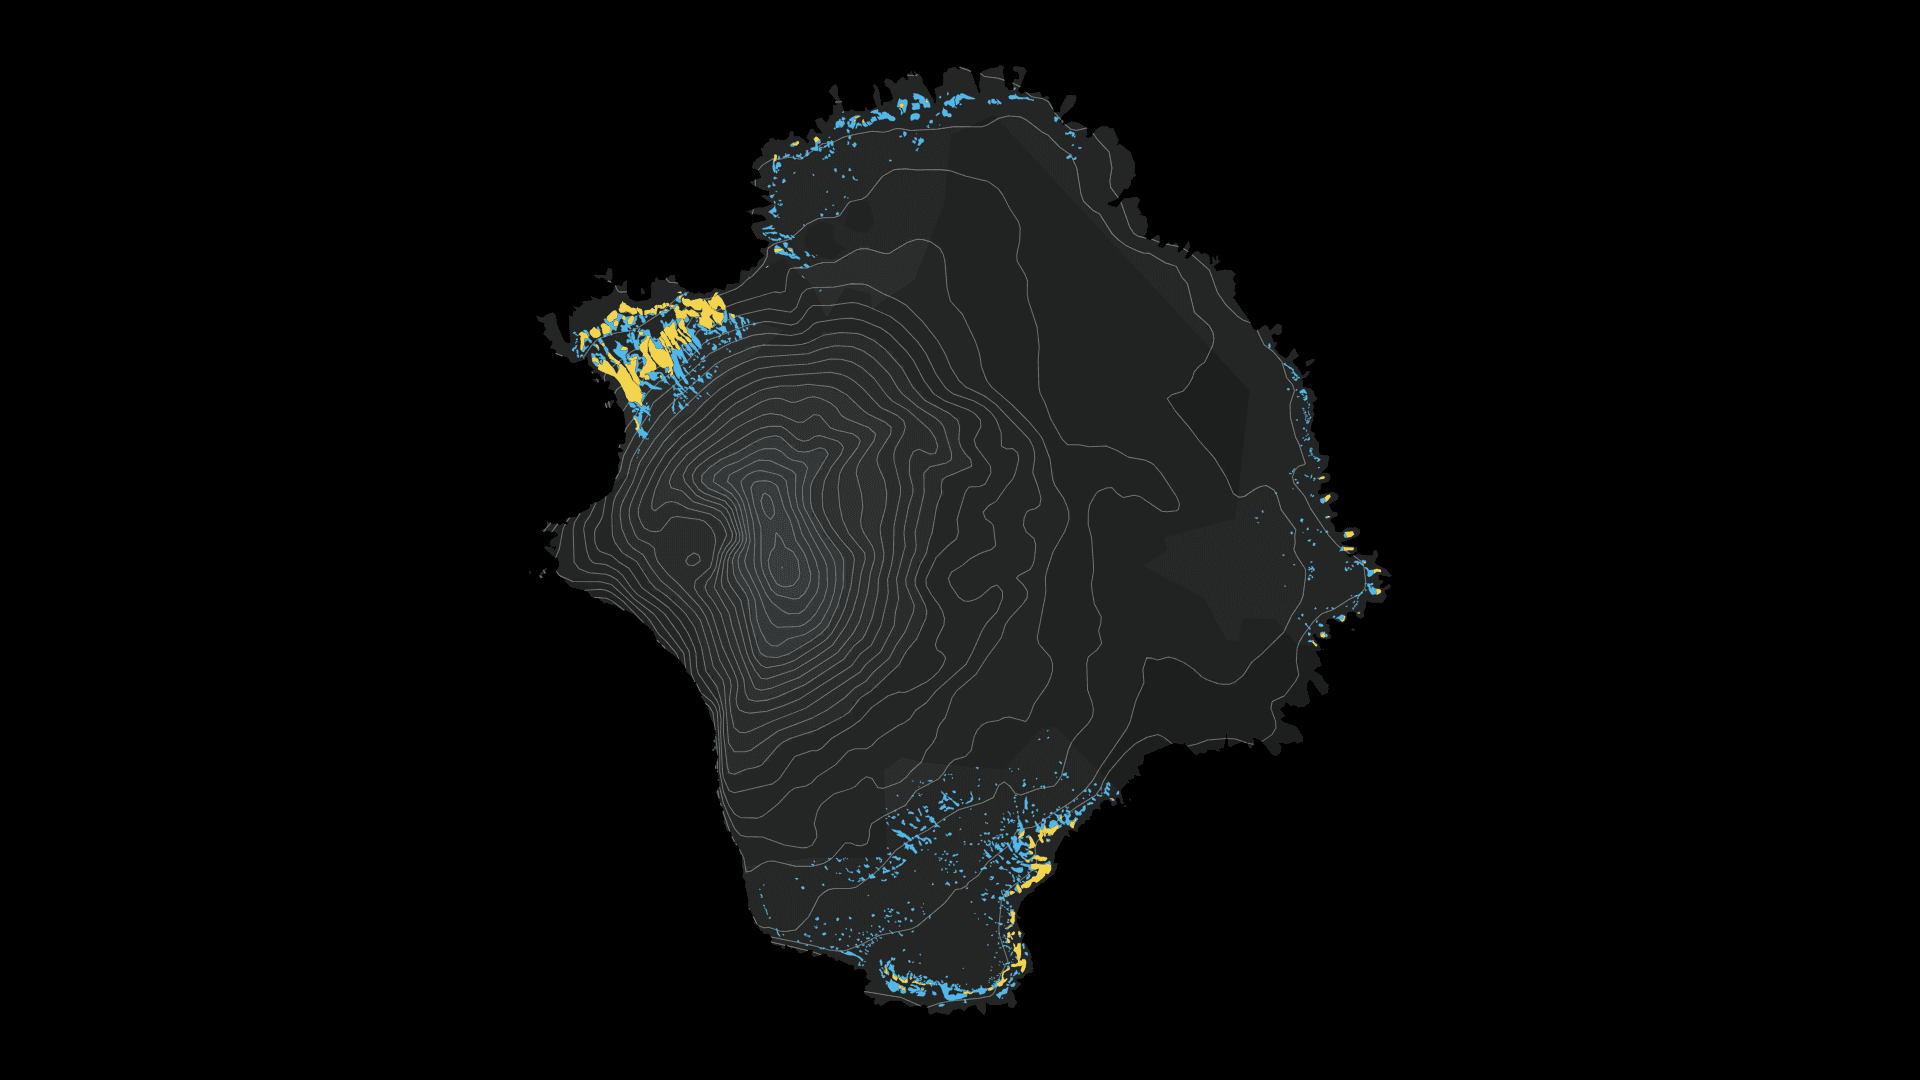
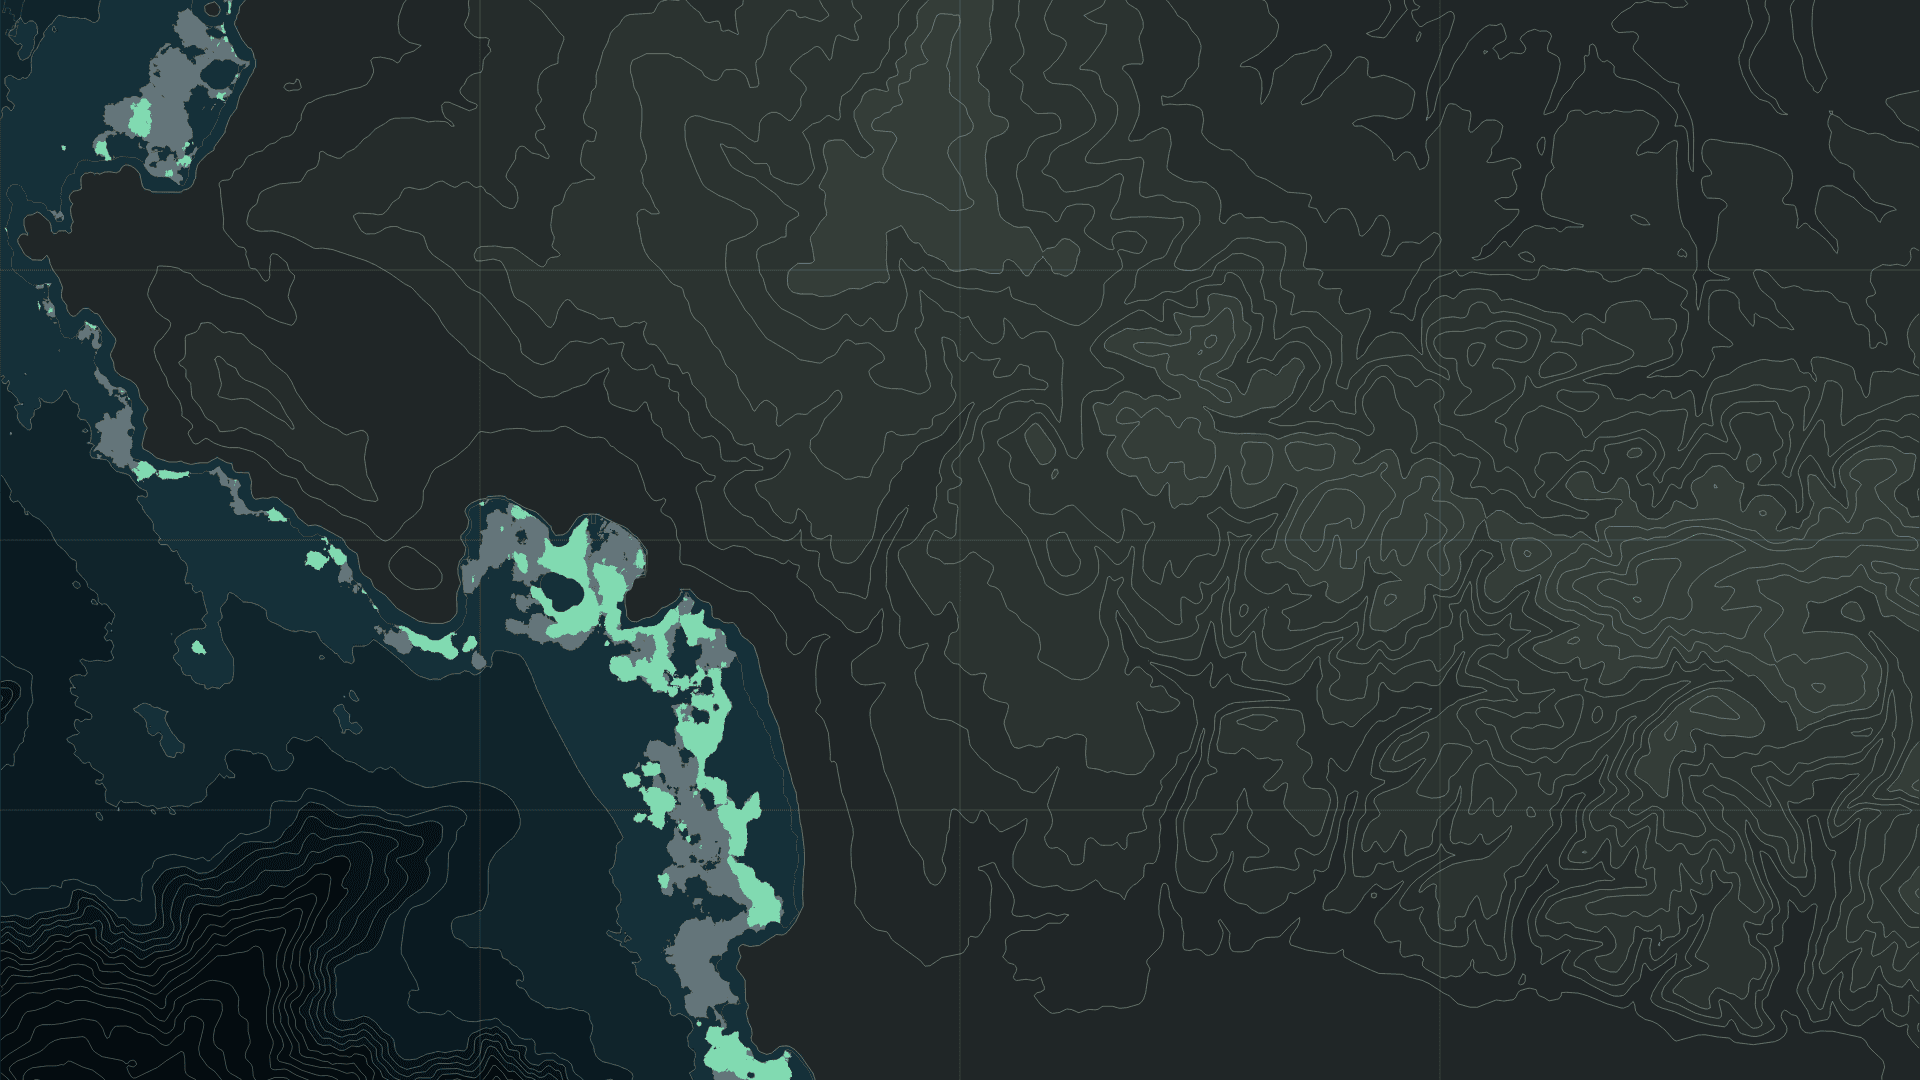
Five survey periods connect a volcanic island’s nesting slopes to the food available in the Southern Ocean.
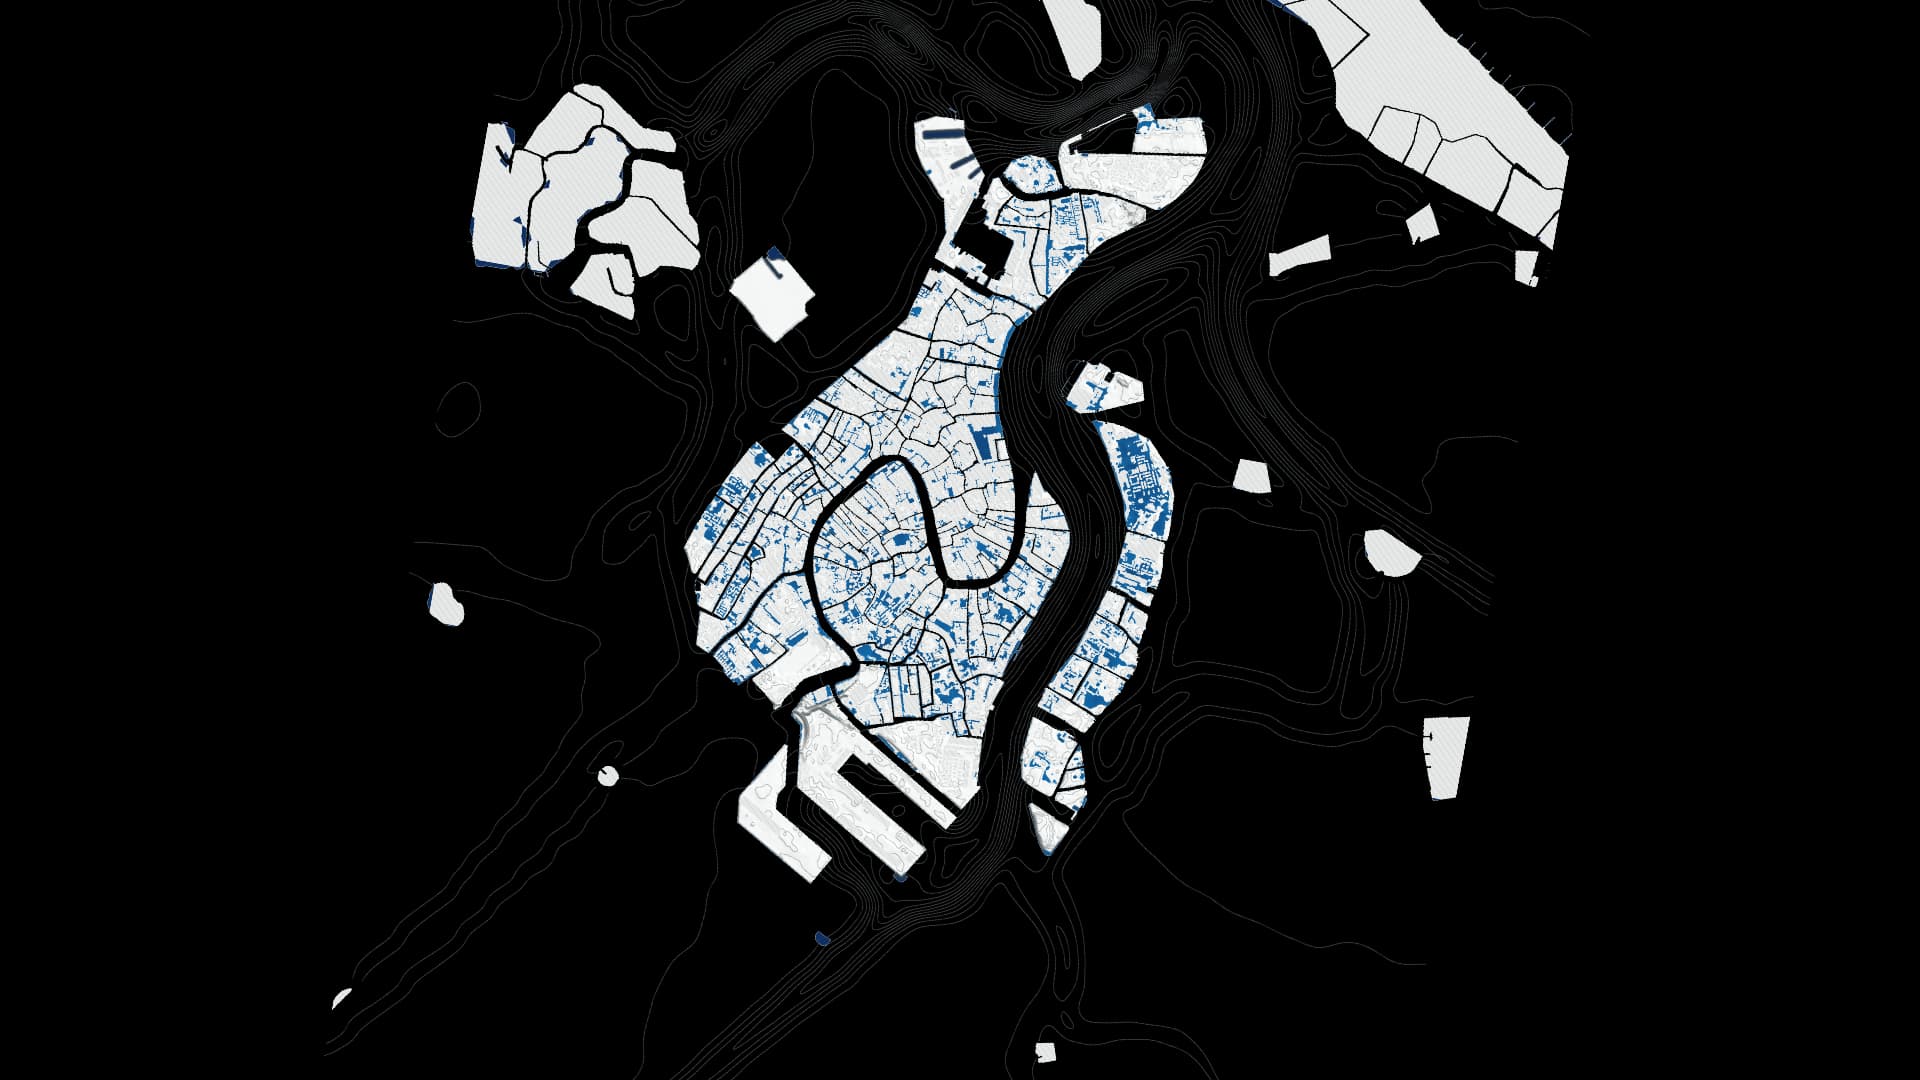
Follow changing flood depth and the city’s relief through 109 outputs of a 2019 reconstruction.
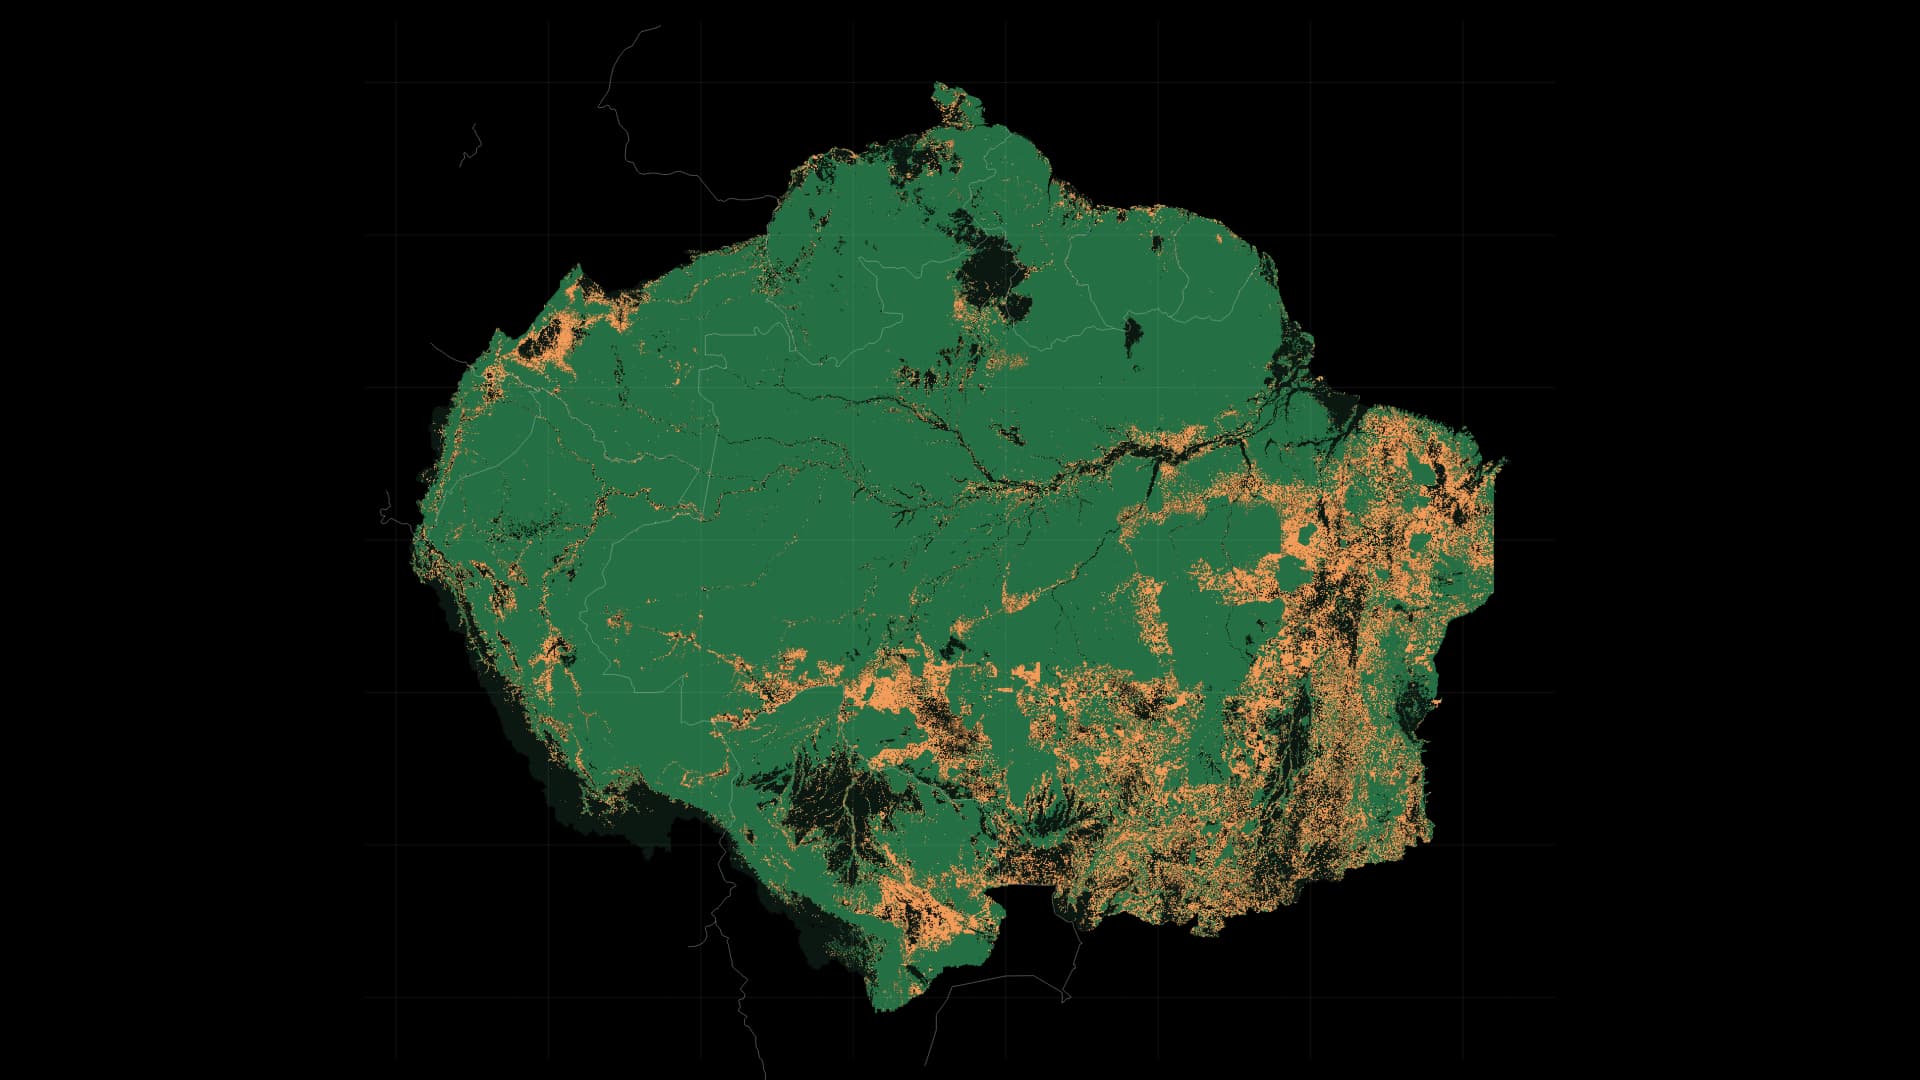
From 1993 to 2023, follow forests across national borders, from Brazil to Peru, Colombia and the Guianas. Overlay annual losses on comparable forest cover across eight countries and French Guiana.
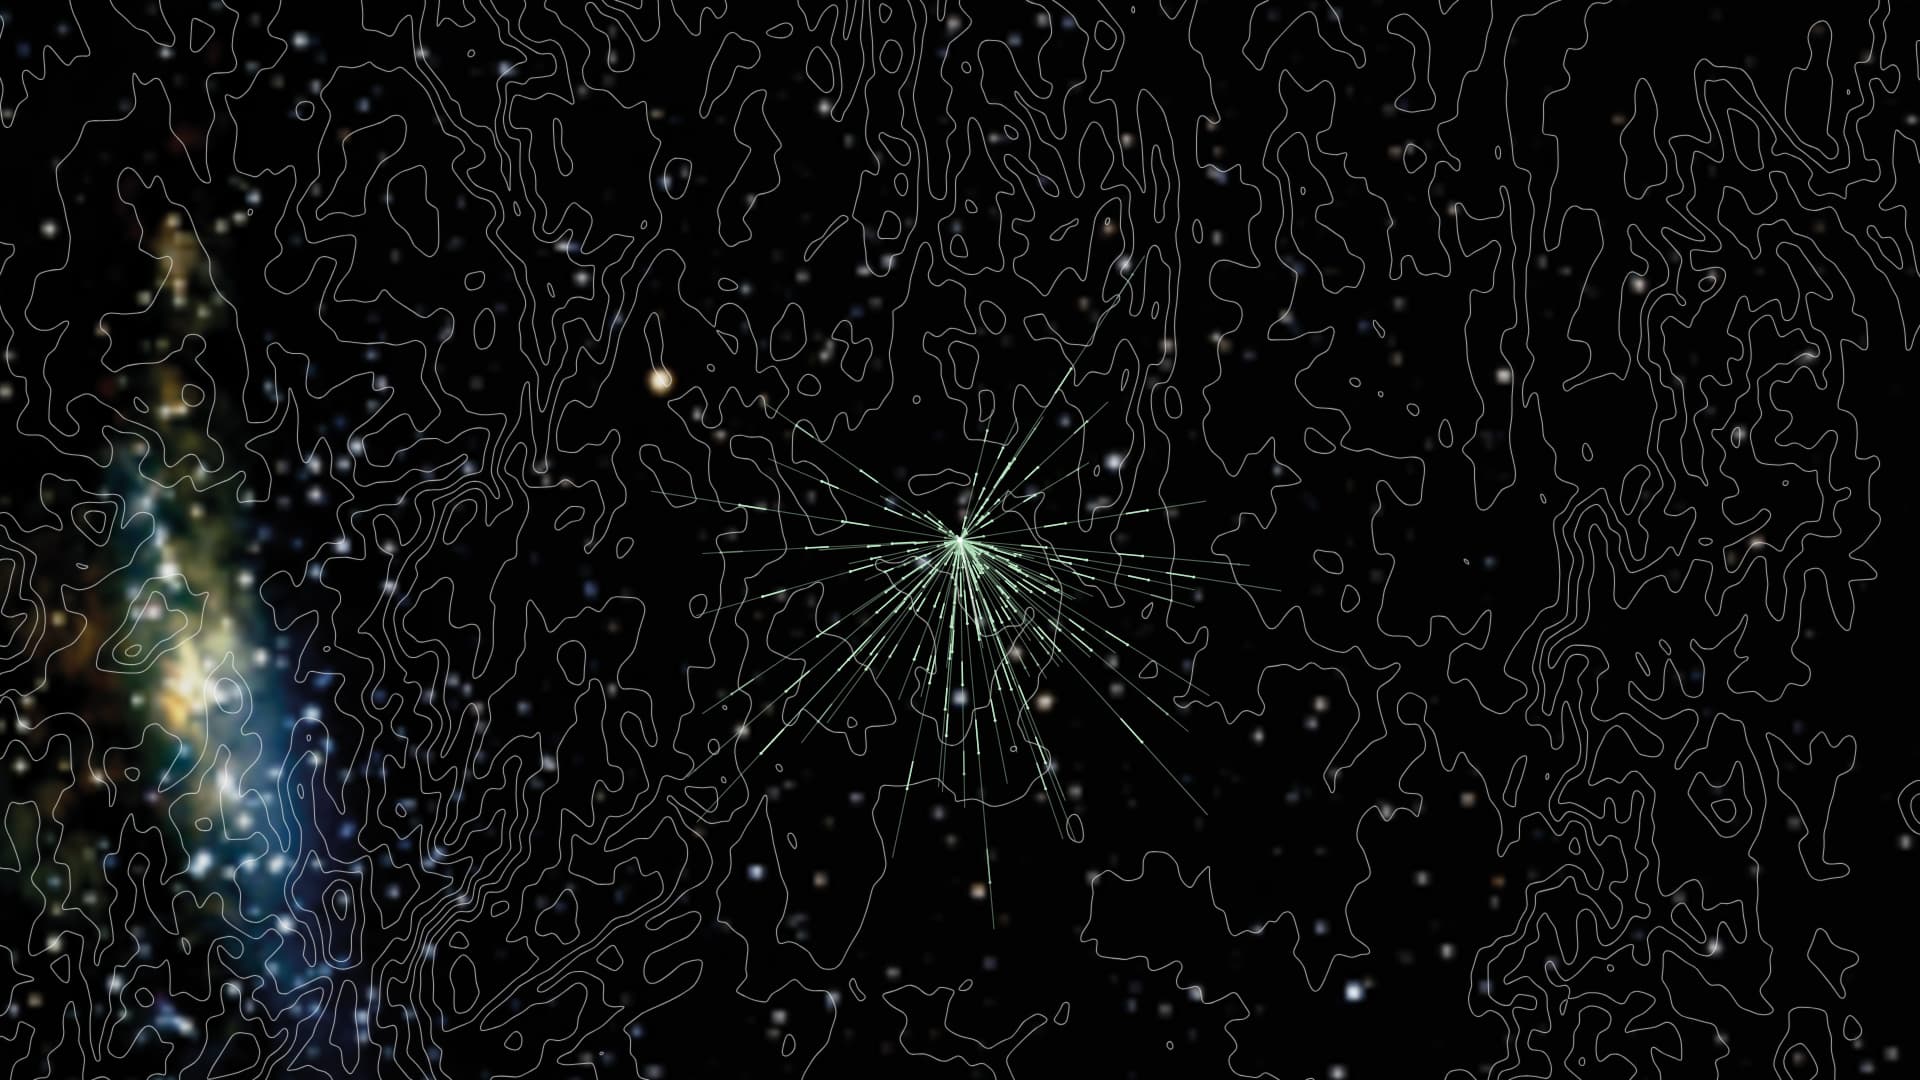
South in spring, north in autumn. An experiment reveals how Bogong moths use the night sky to orient their journeys.
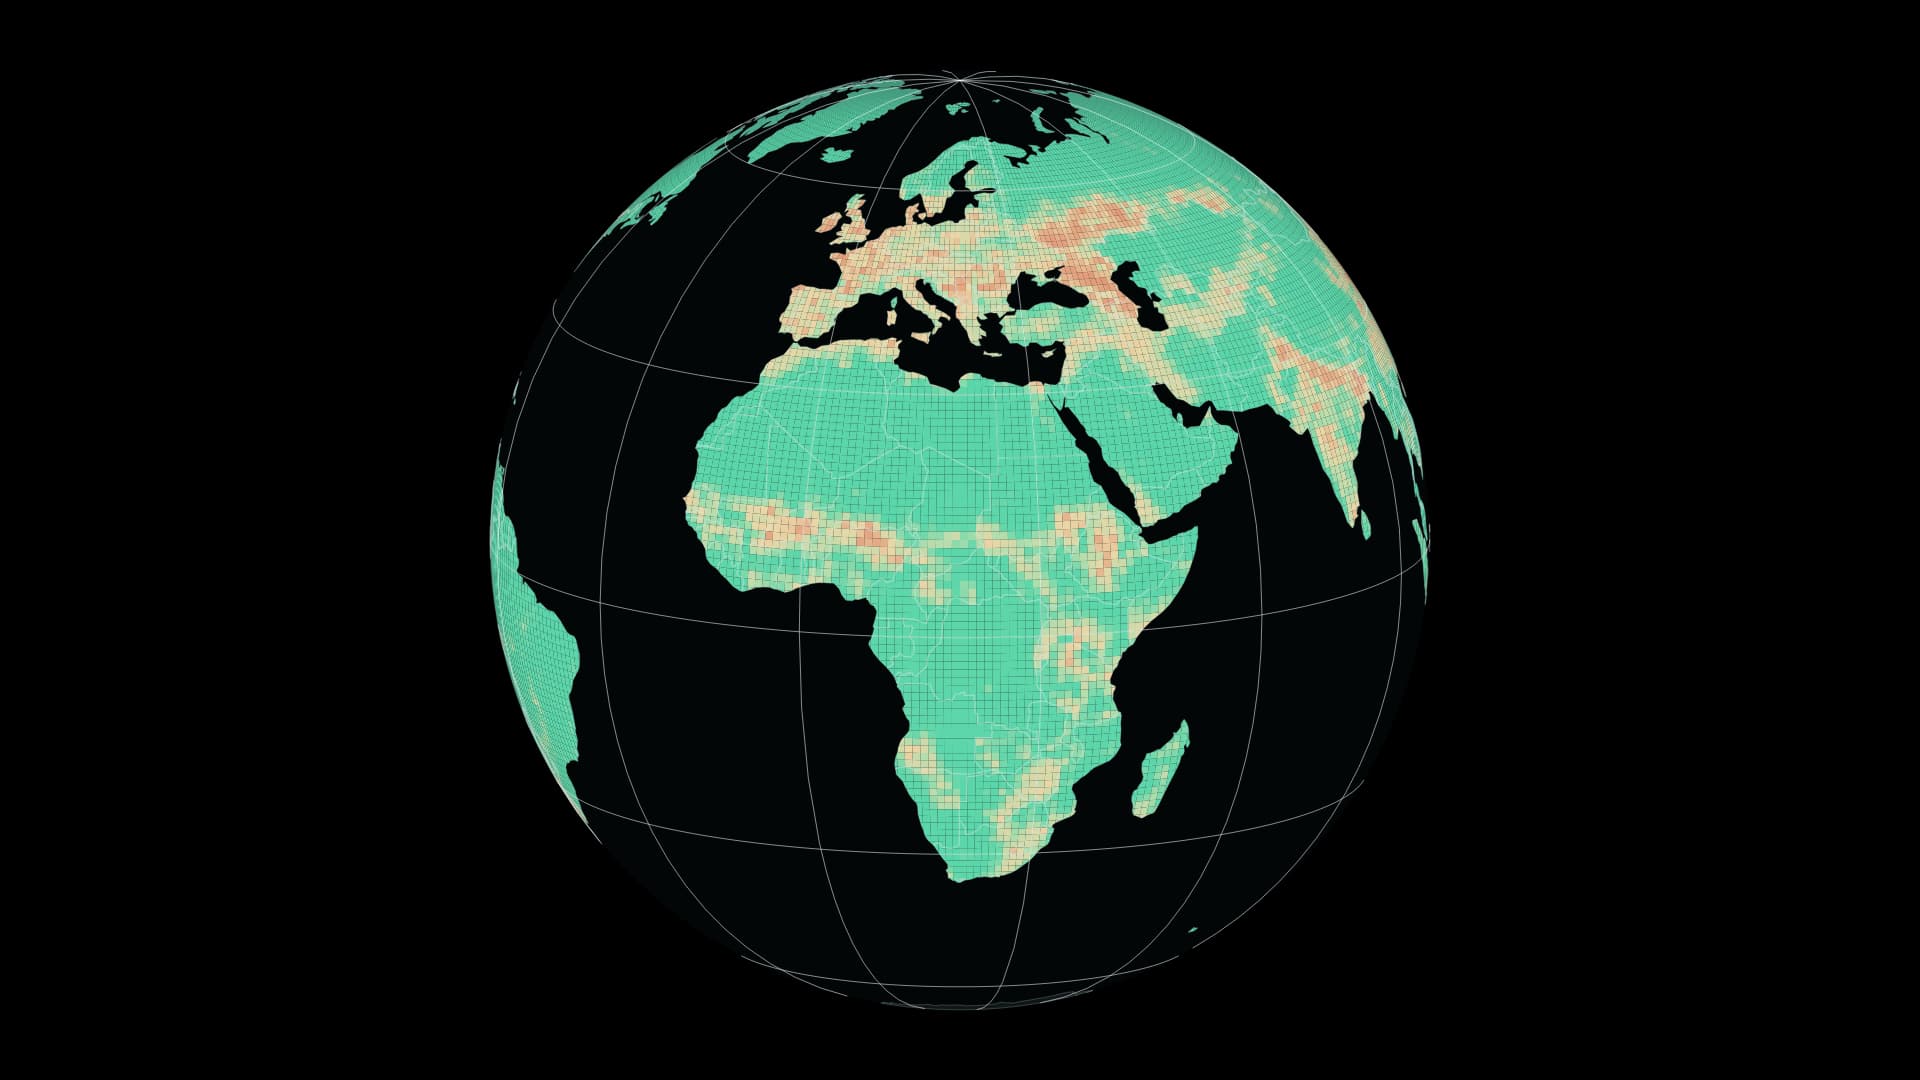
Compare 1900 and 2015 through a global model of terrestrial biodiversity intactness.
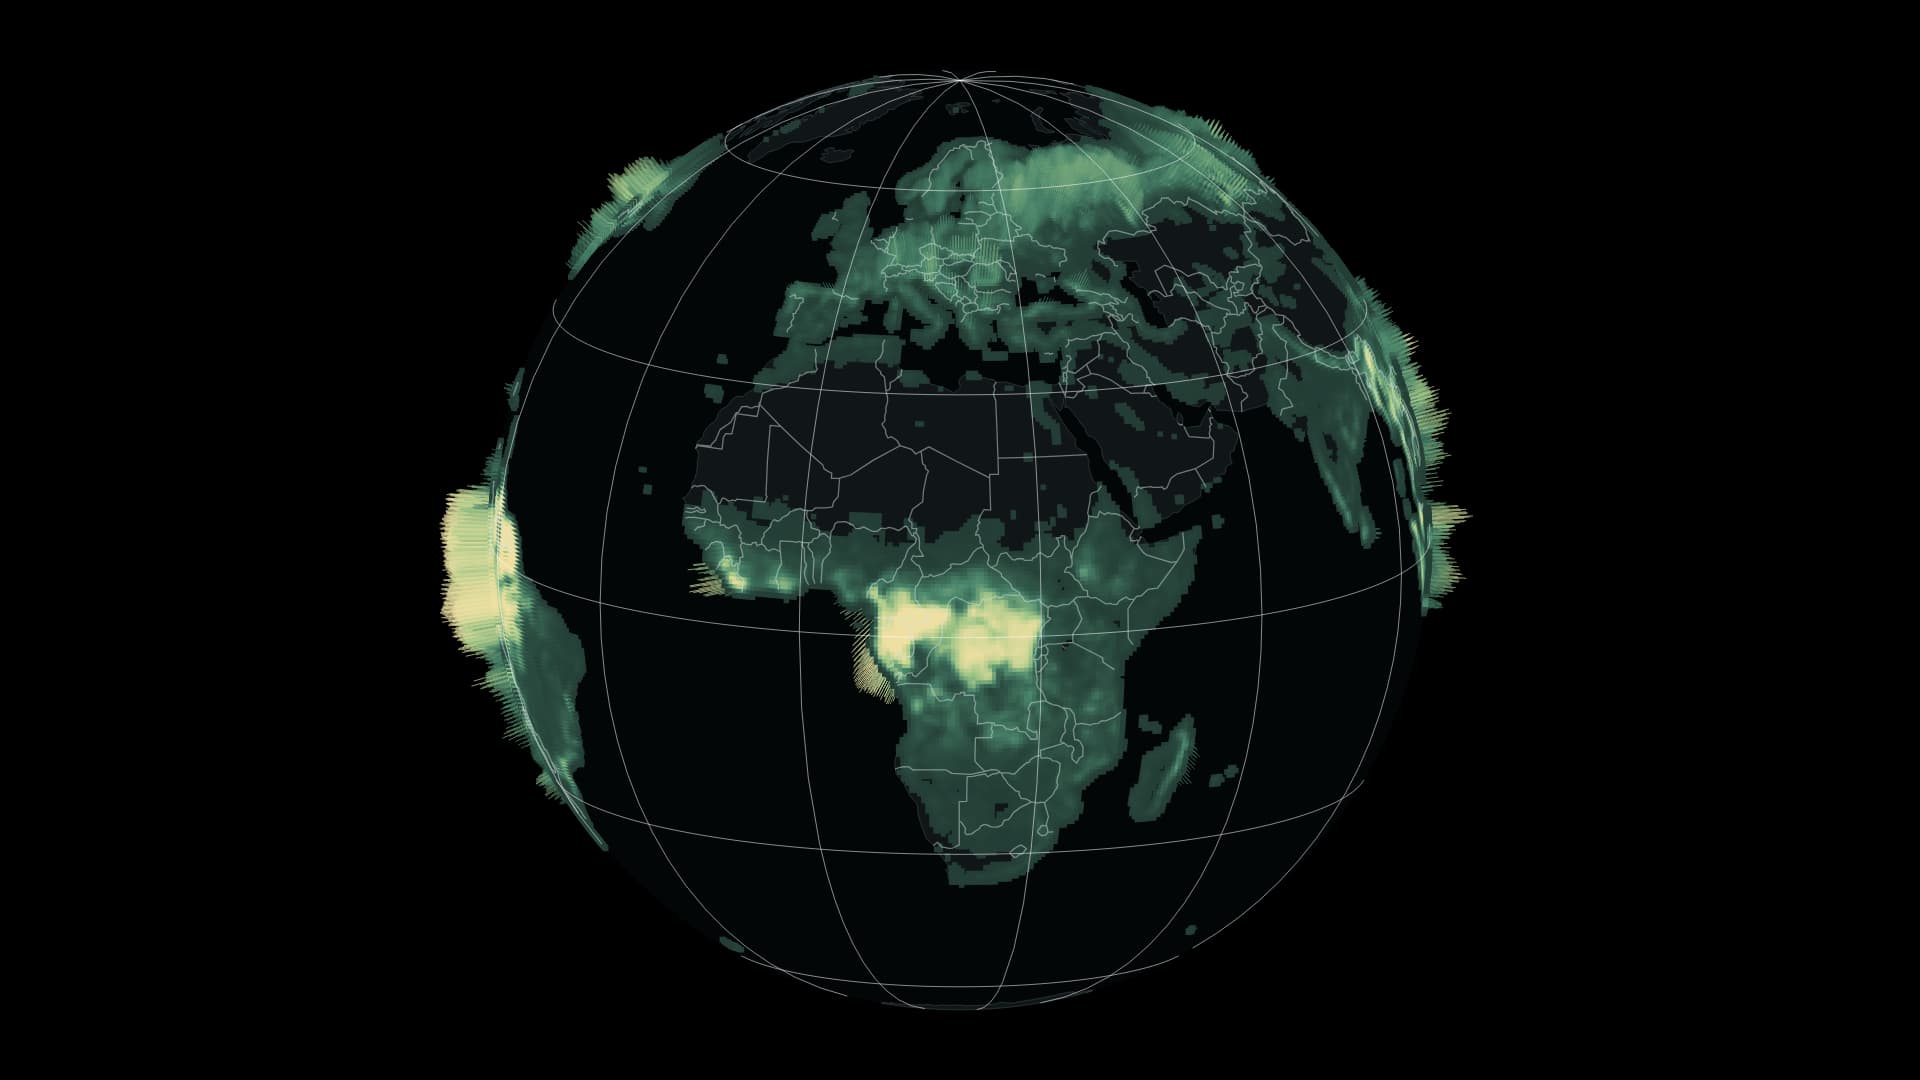
A global view of above-ground woody biomass in 2024.
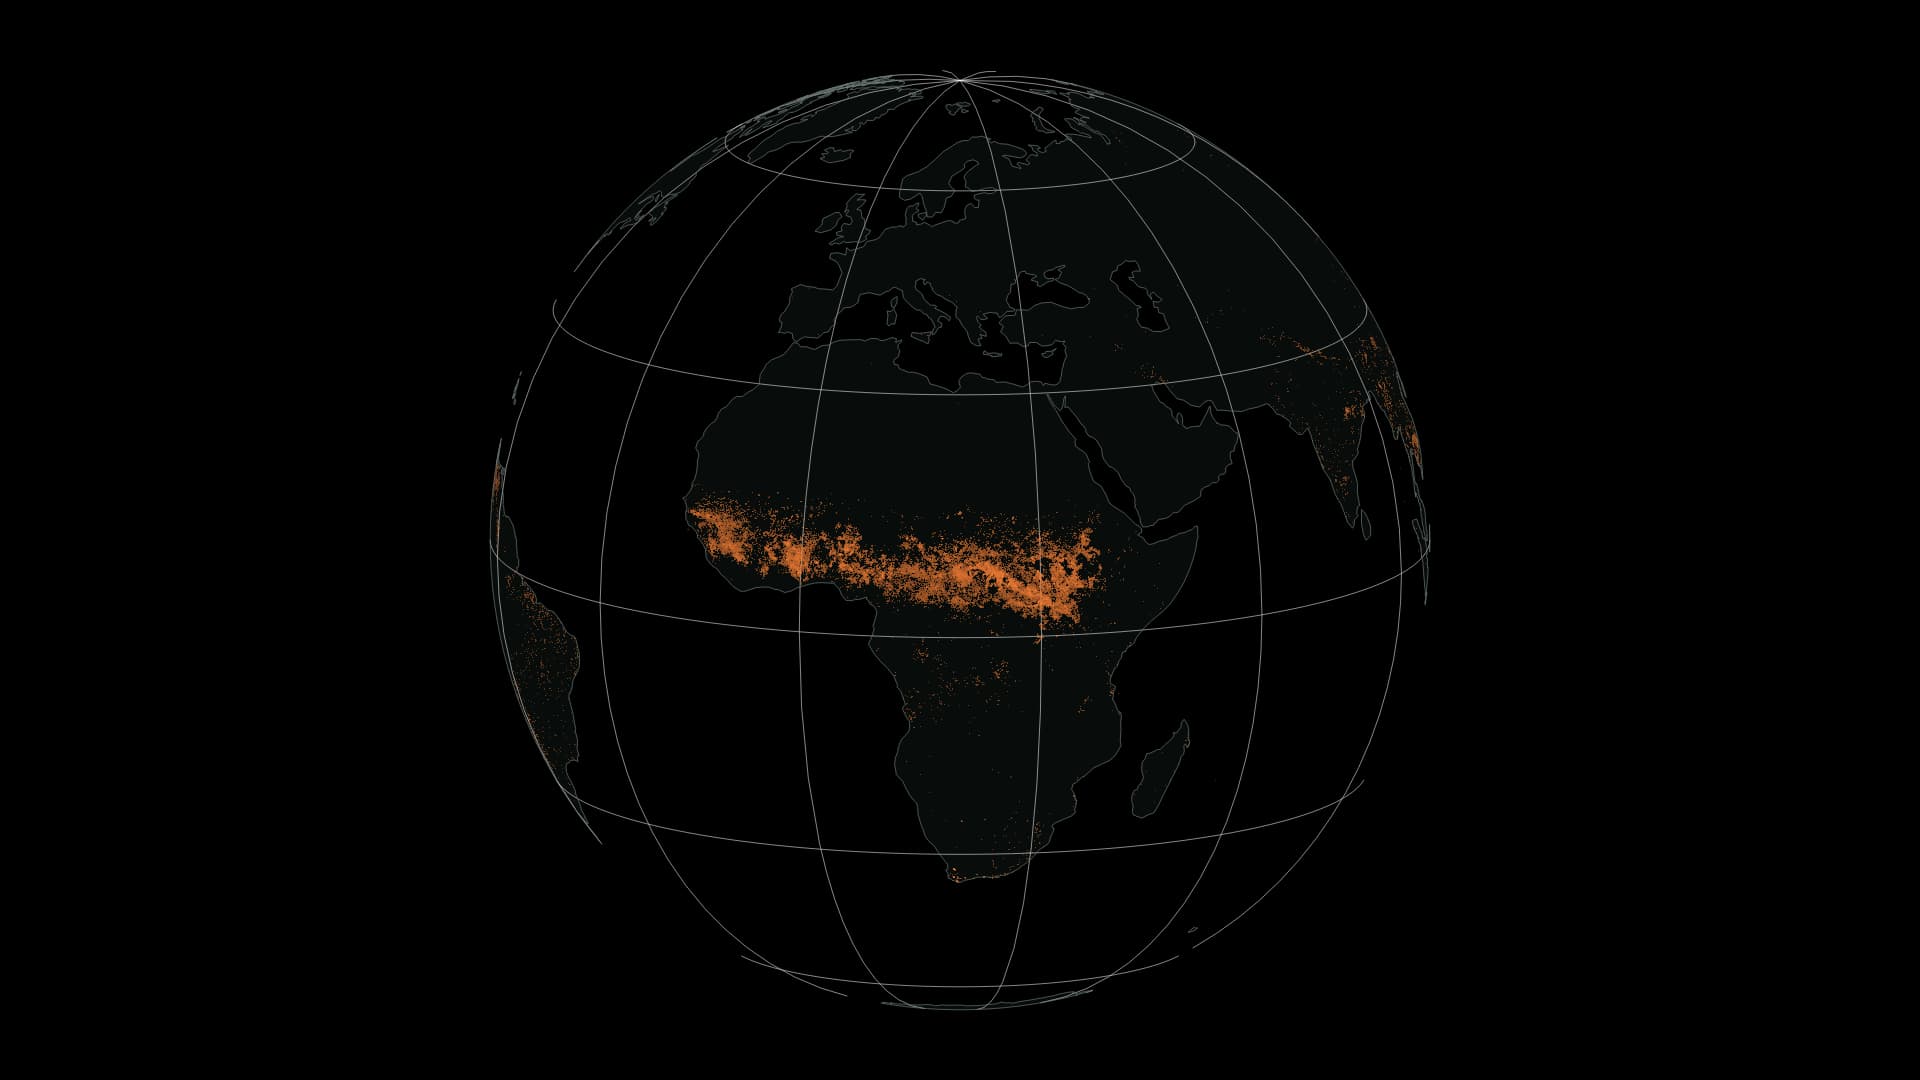
Monthly distributions of satellite-estimated fire perimeters across the world in 2026.
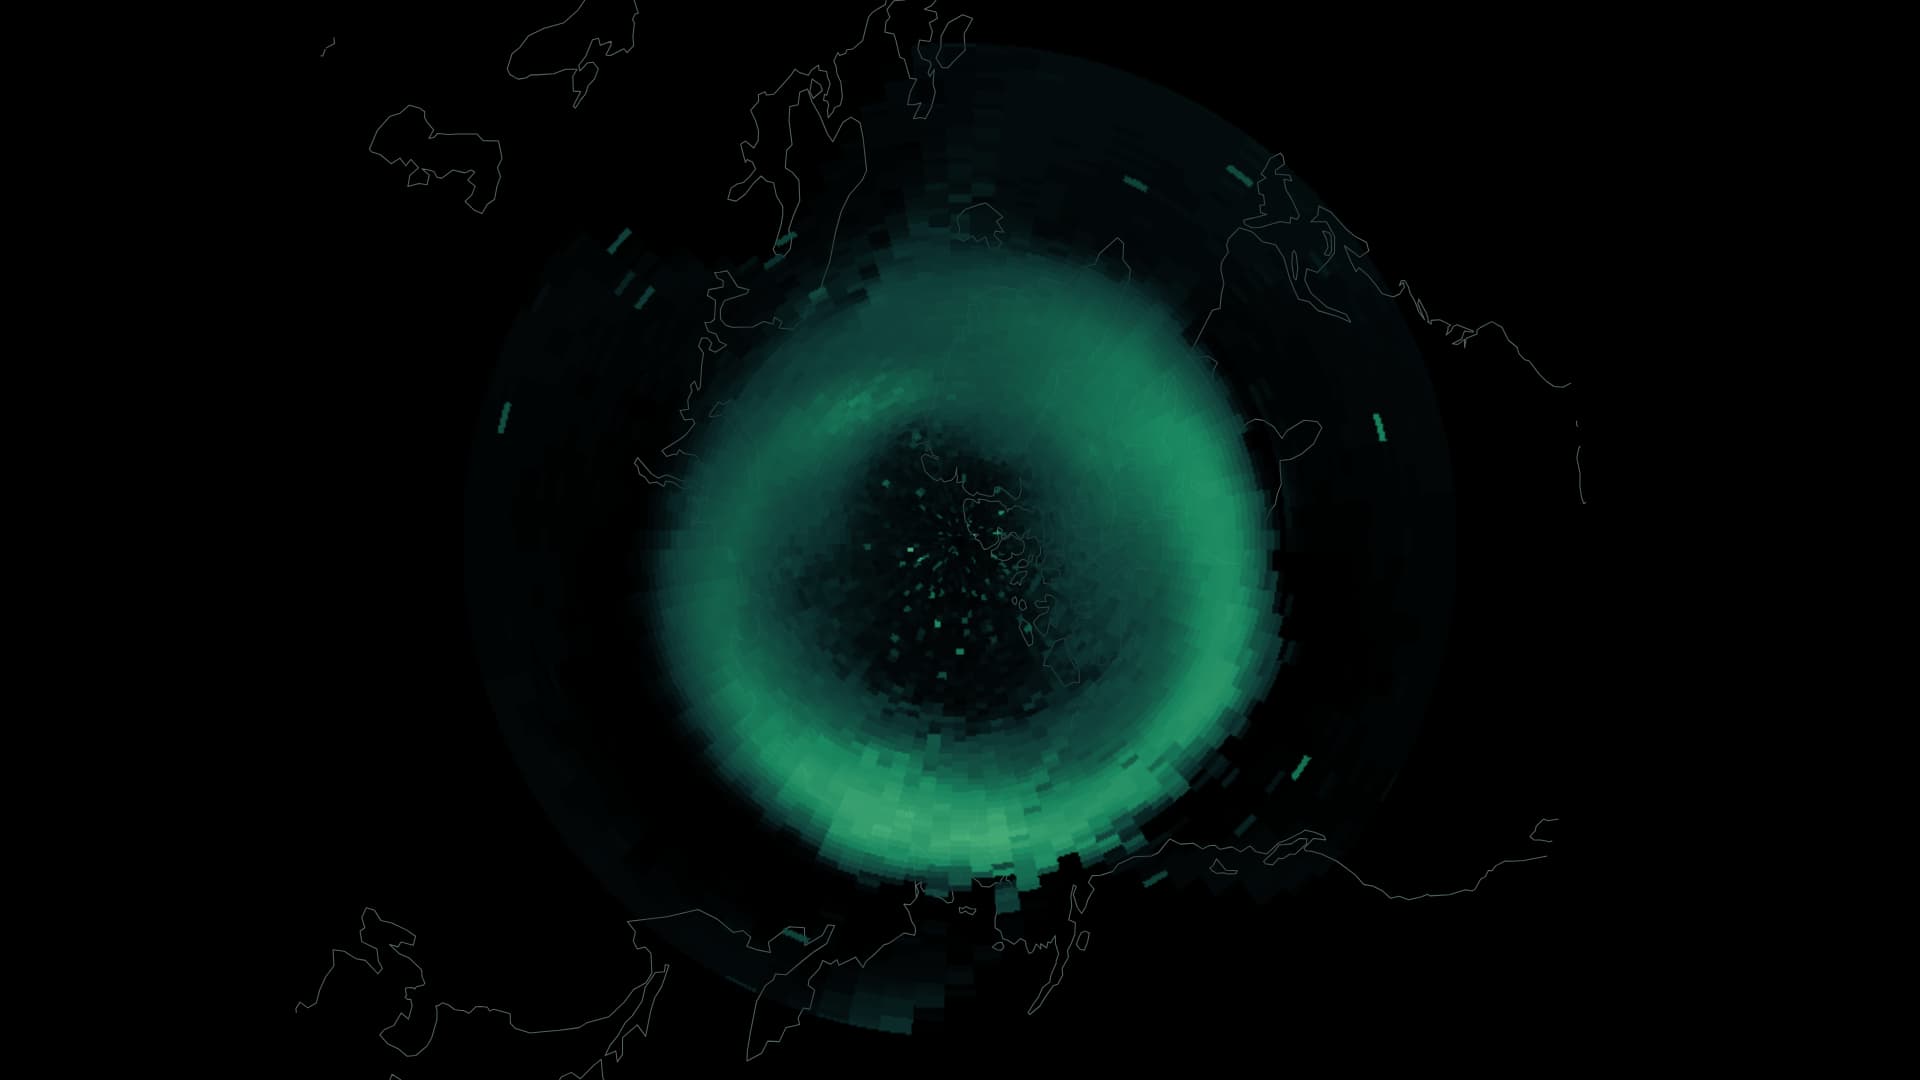
From October 2025 to September 2026, fixed-time model snapshots and geomagnetic observations trace a year of change above the northern sky.
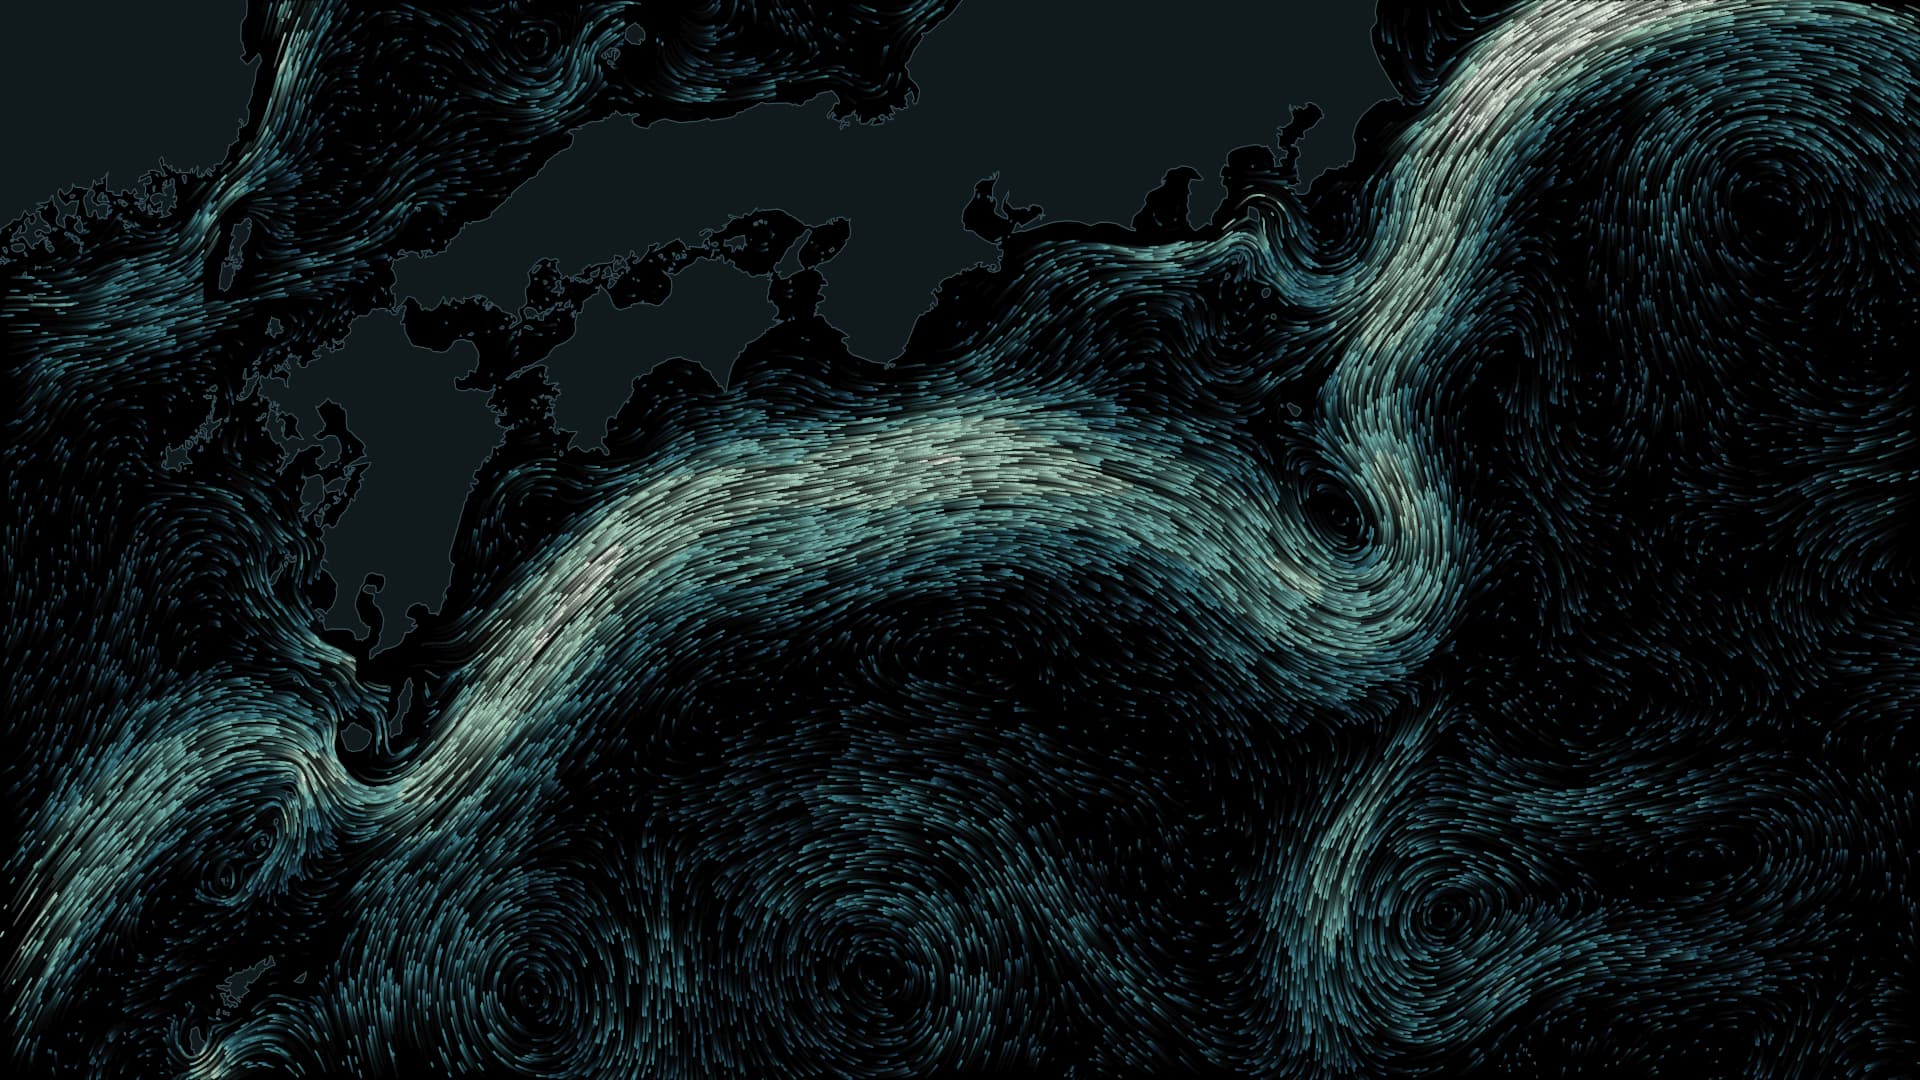
The large meander ended in April 2025 after seven years and nine months. Ninety-seven monthly current fields and observations from the coast place that change in context.
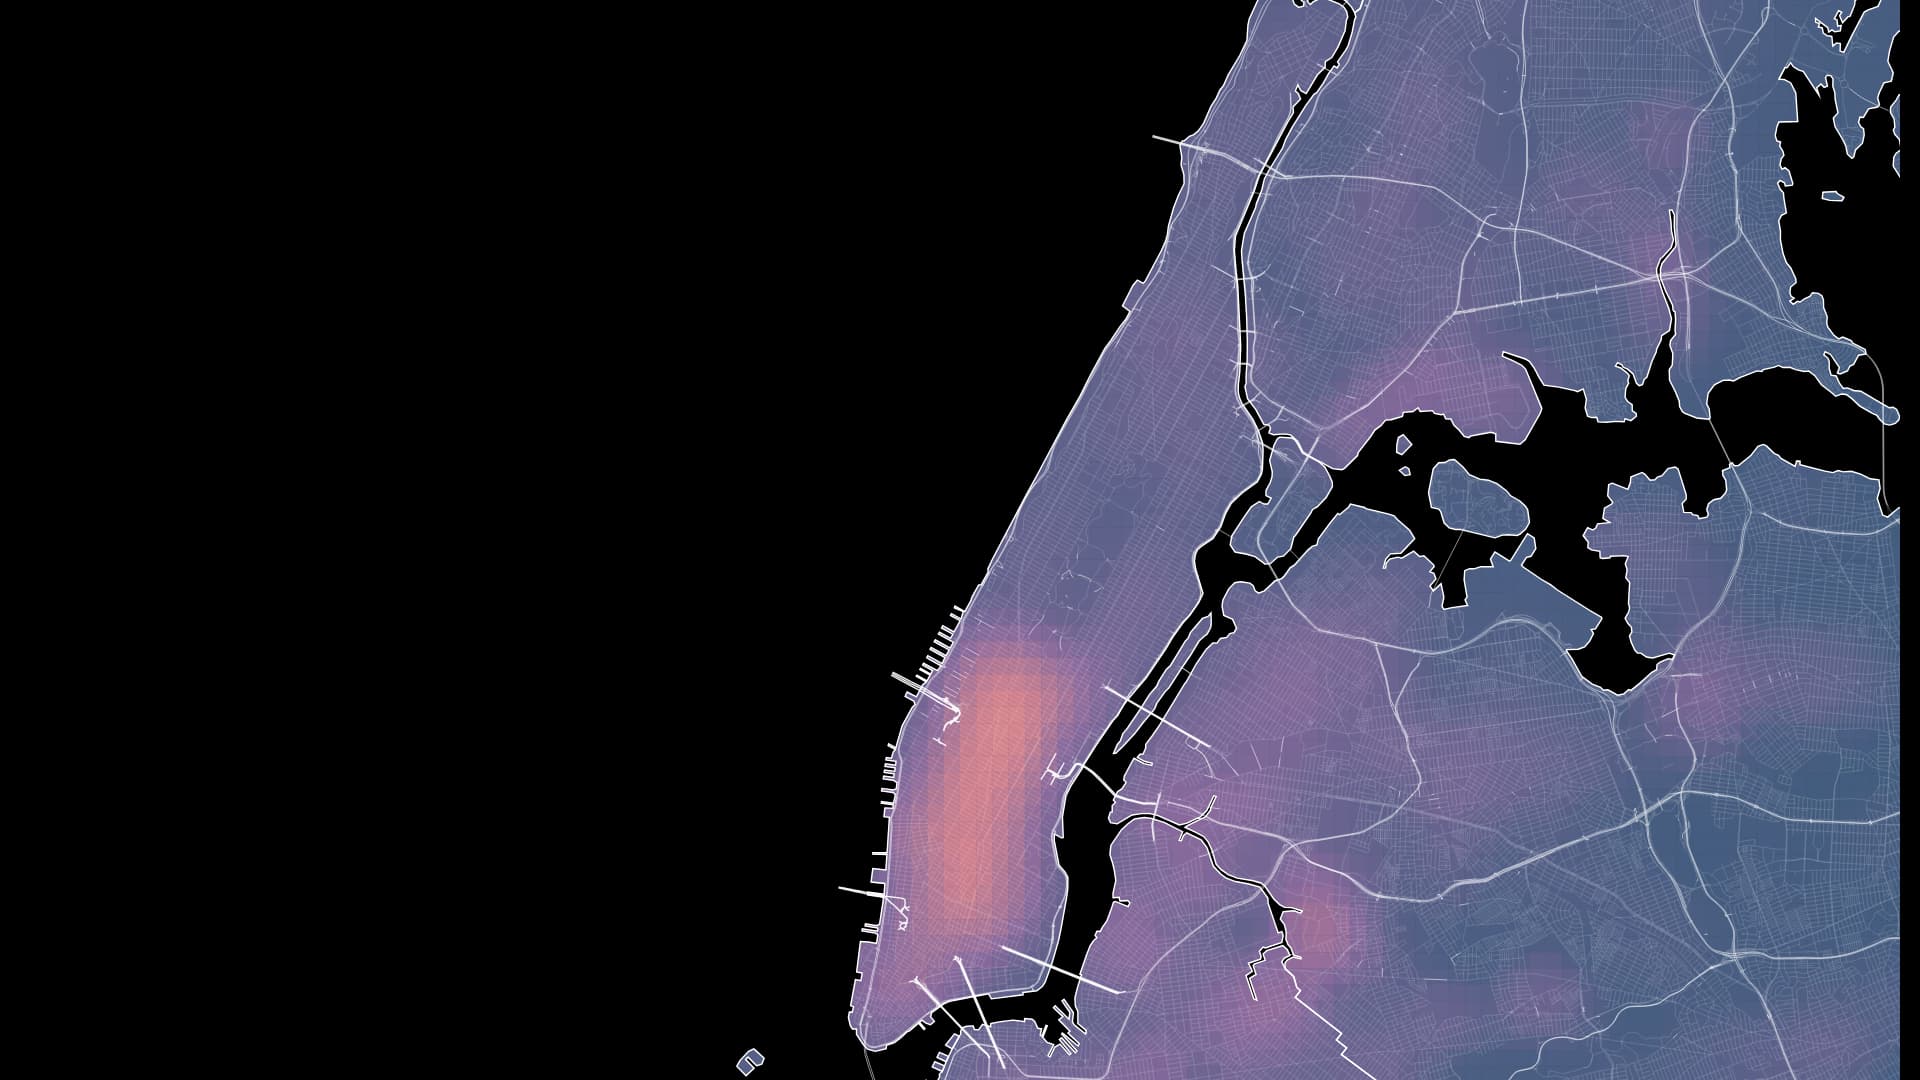
Annual maps from 2009, 2019 and 2024 connect cleaner air with buildings, kitchens and the work of a city.
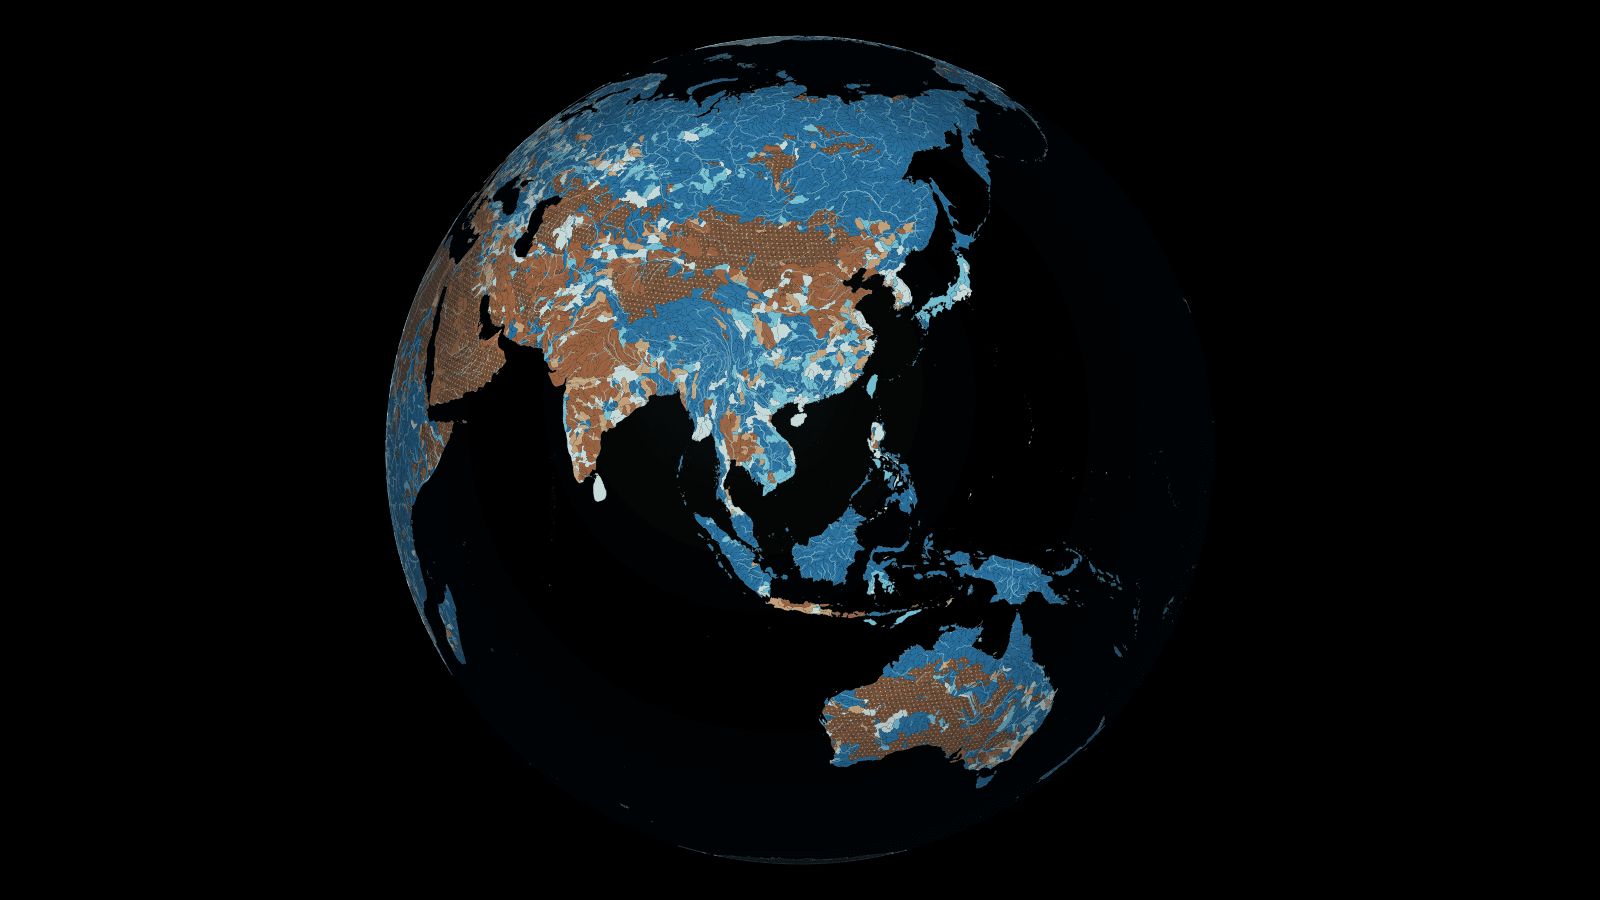
How closely does water demand approach renewable supply? Explore 16,395 basins worldwide, then zoom into mainstems and tributaries.
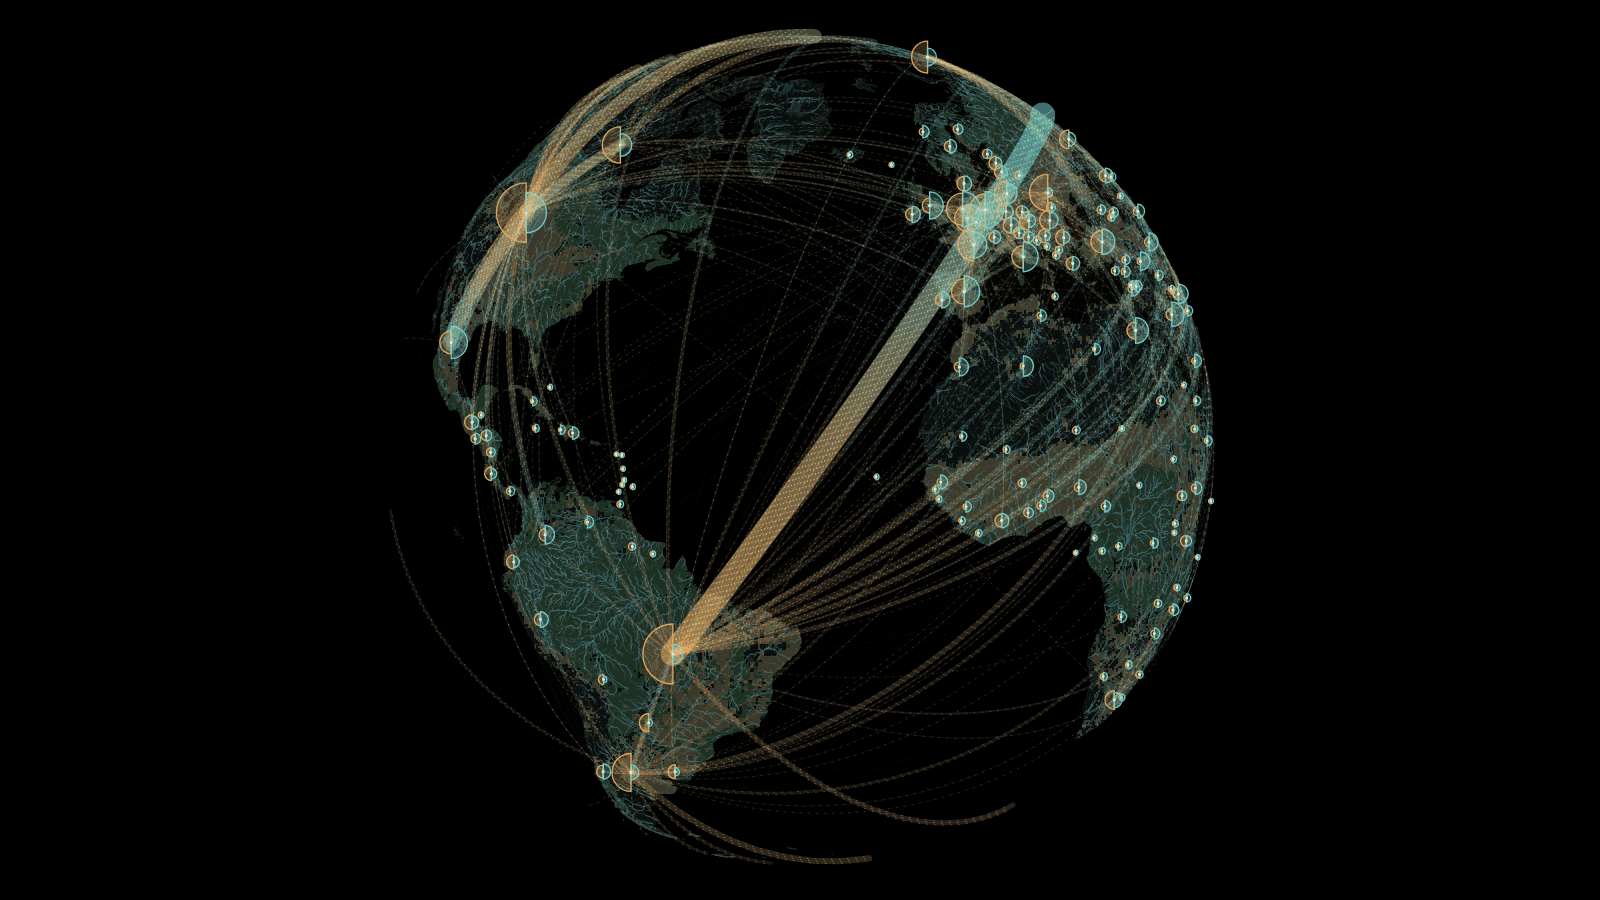
Where do grain, fruit and animal feed come from—and where do they go? Follow exports and imports across 198 countries and areas through traded mass and direction.
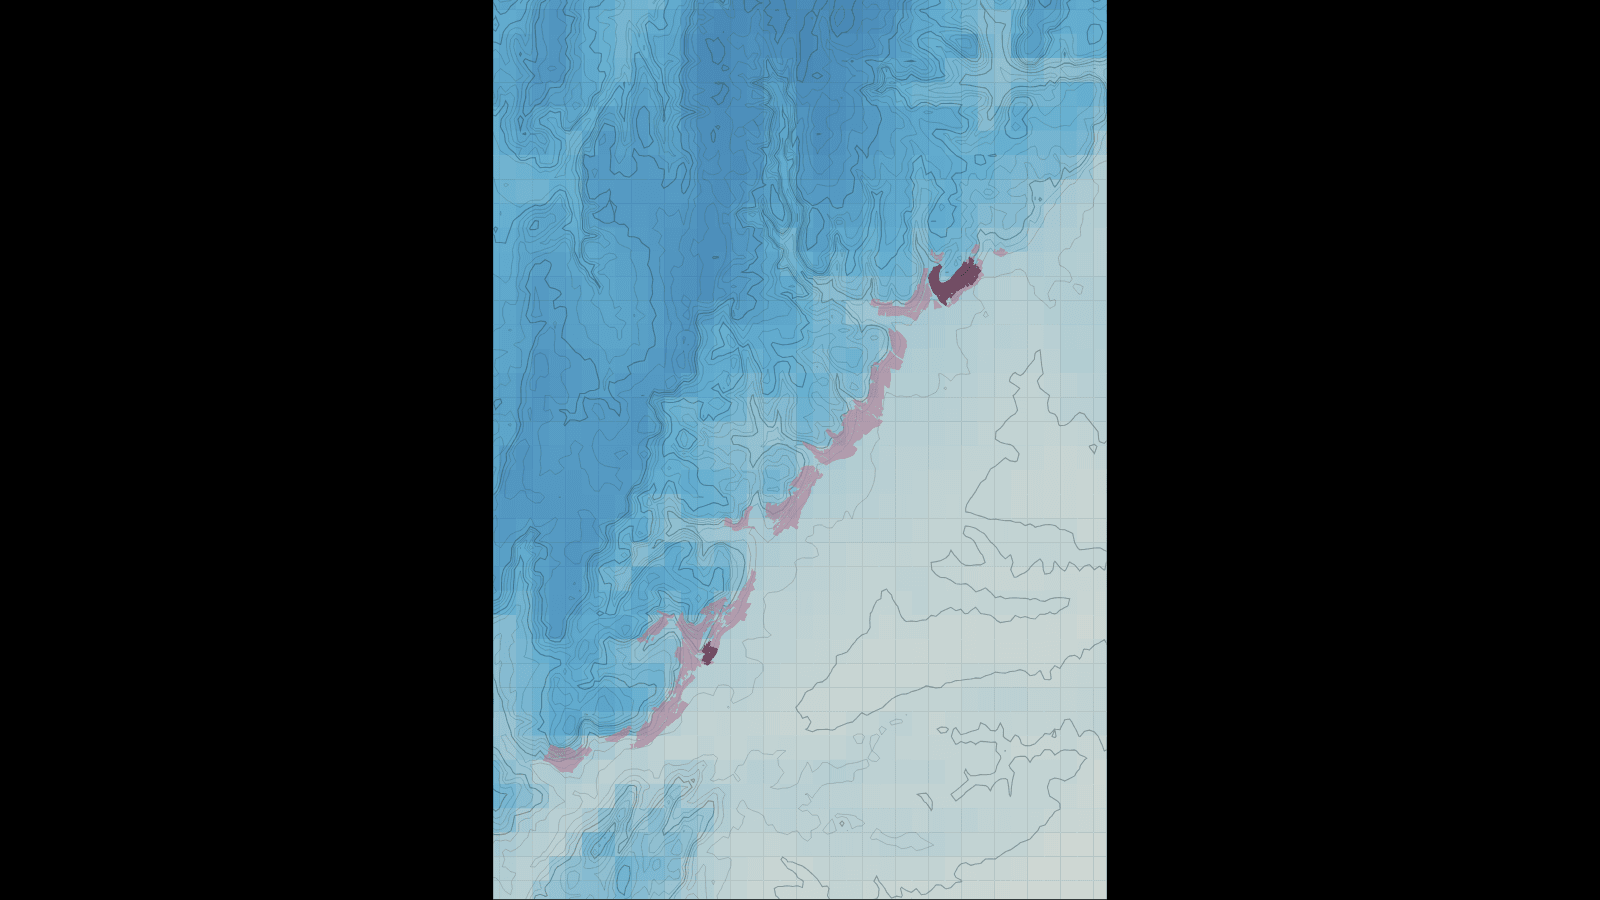
Will a celebrated vineyard keep the climate that helped make its name? Hold today’s Côte de Beaune boundaries in place and compare growing-season temperatures across the slopes and hills behind them.
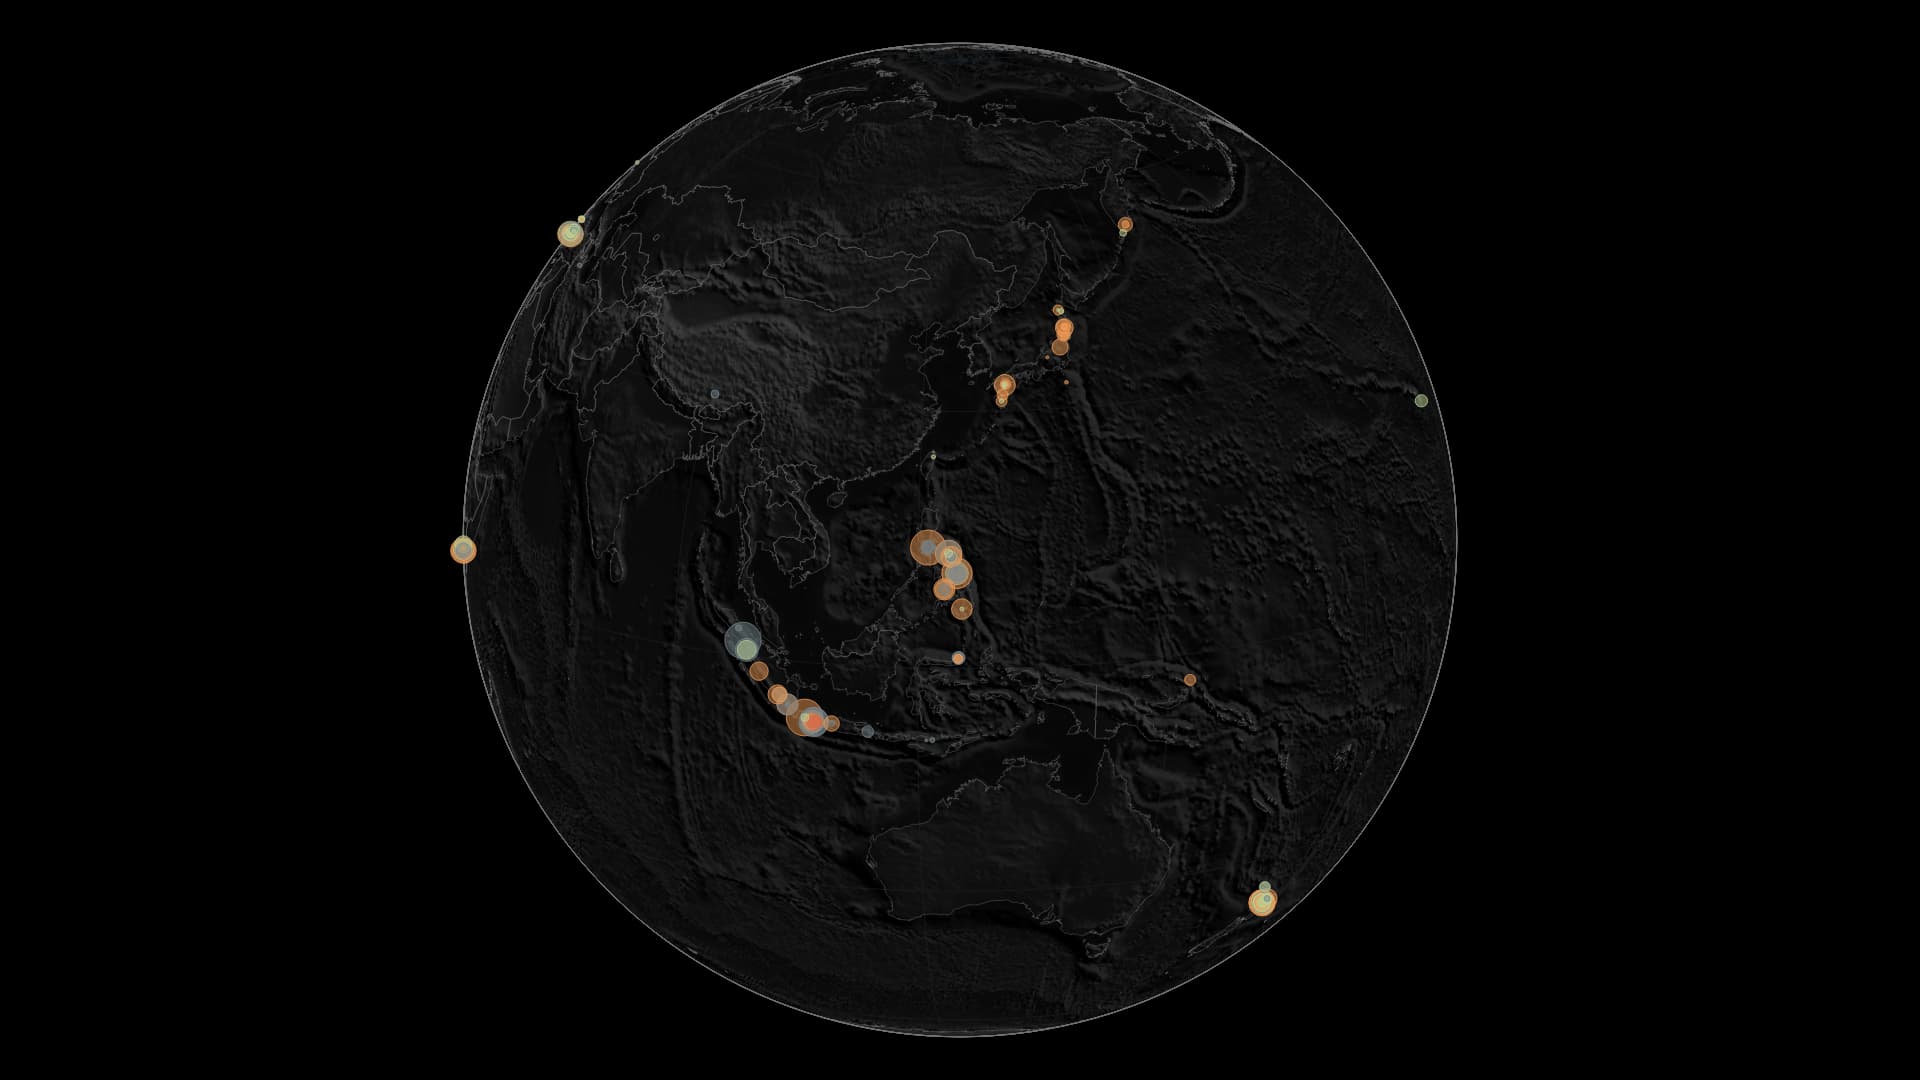
A world of power plants built to turn underground heat into electricity.
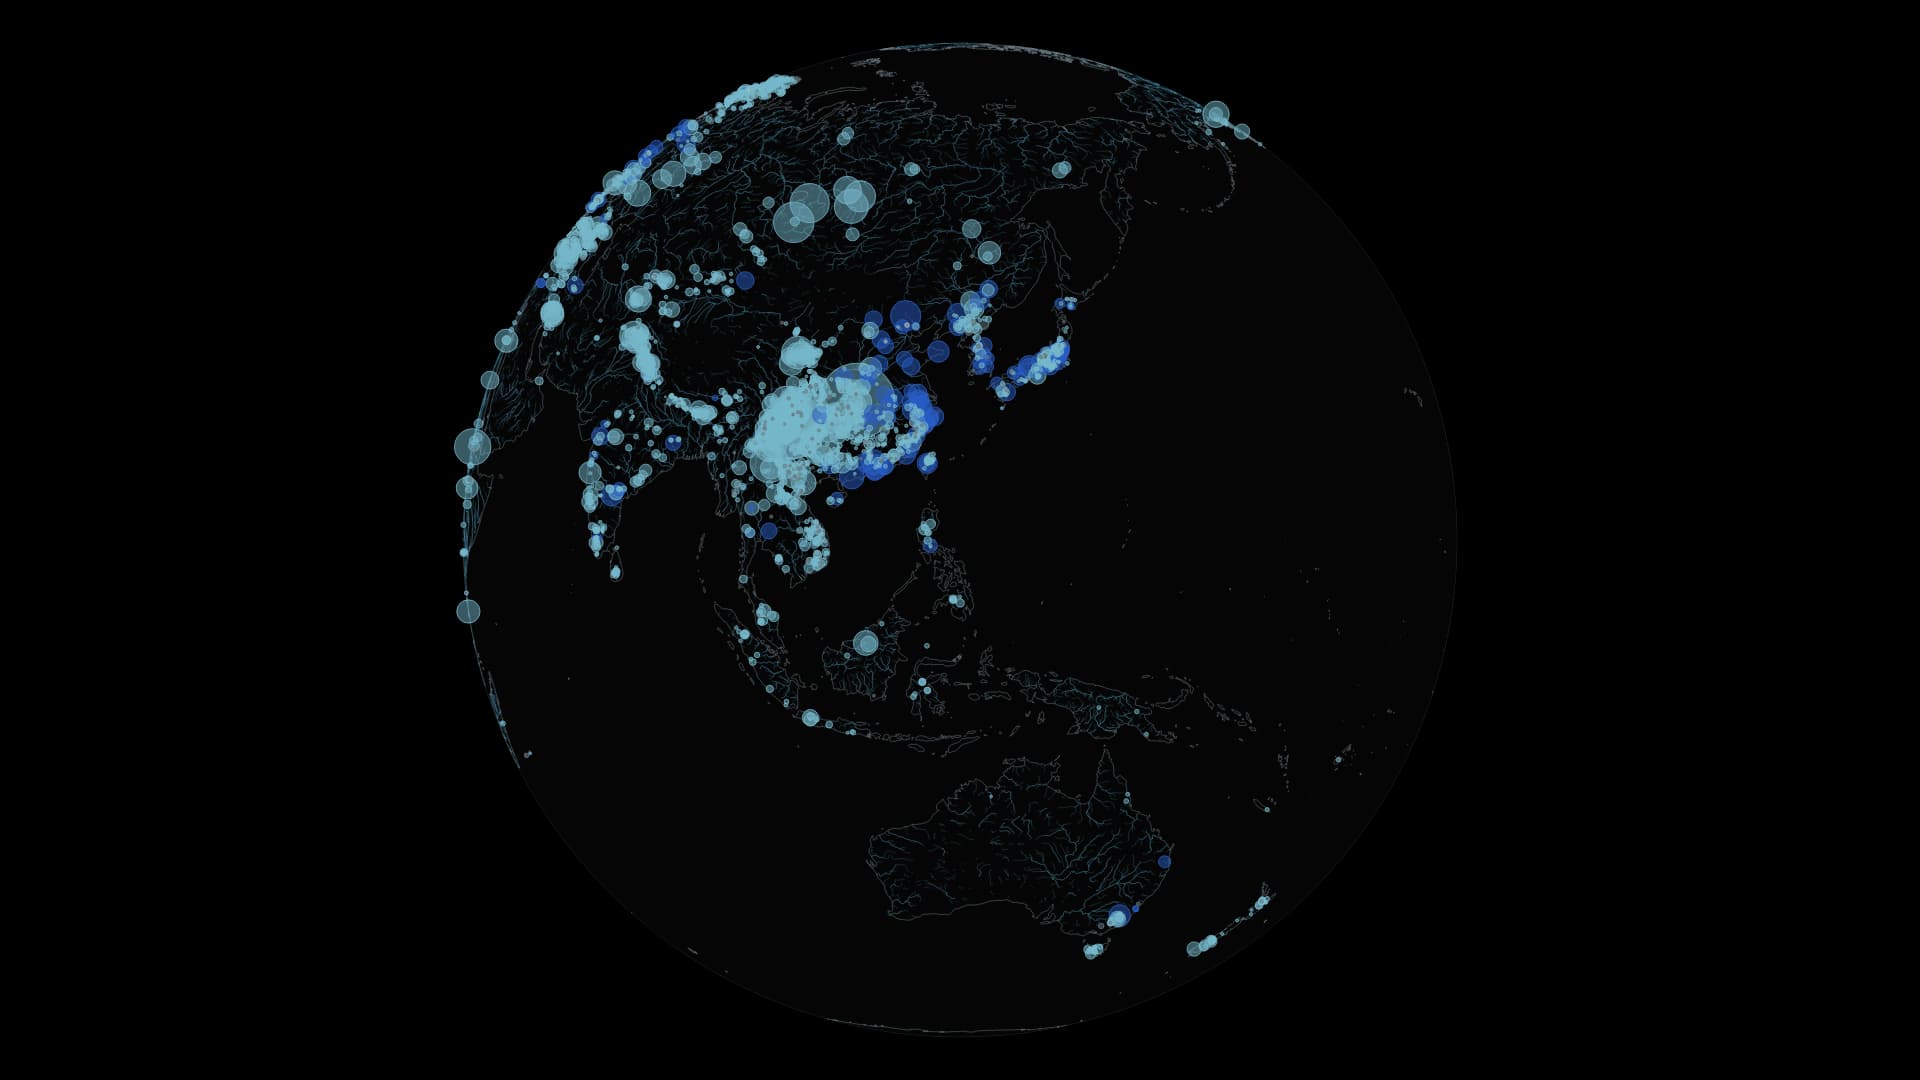
Compare conventional hydropower and pumped storage across the world.
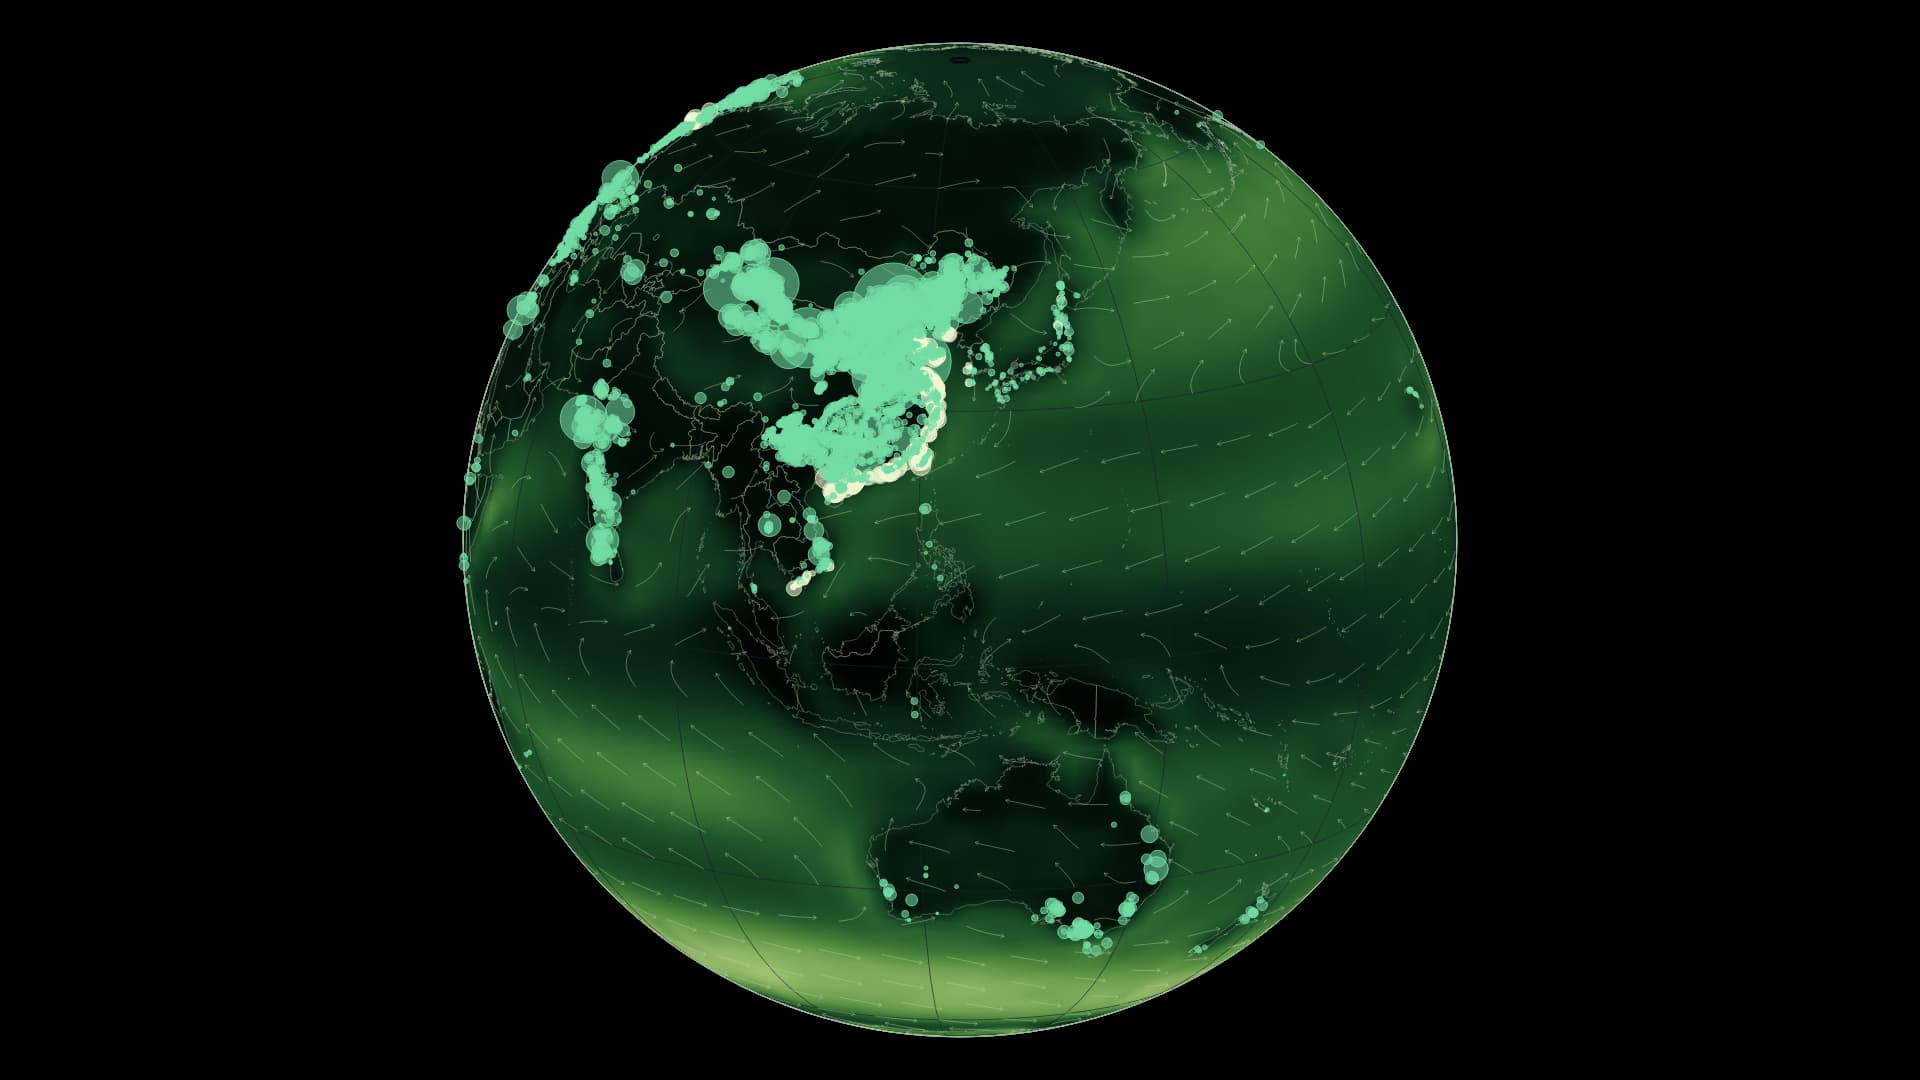
Onshore and offshore wind farms meet a global climatology of wind speed and direction.
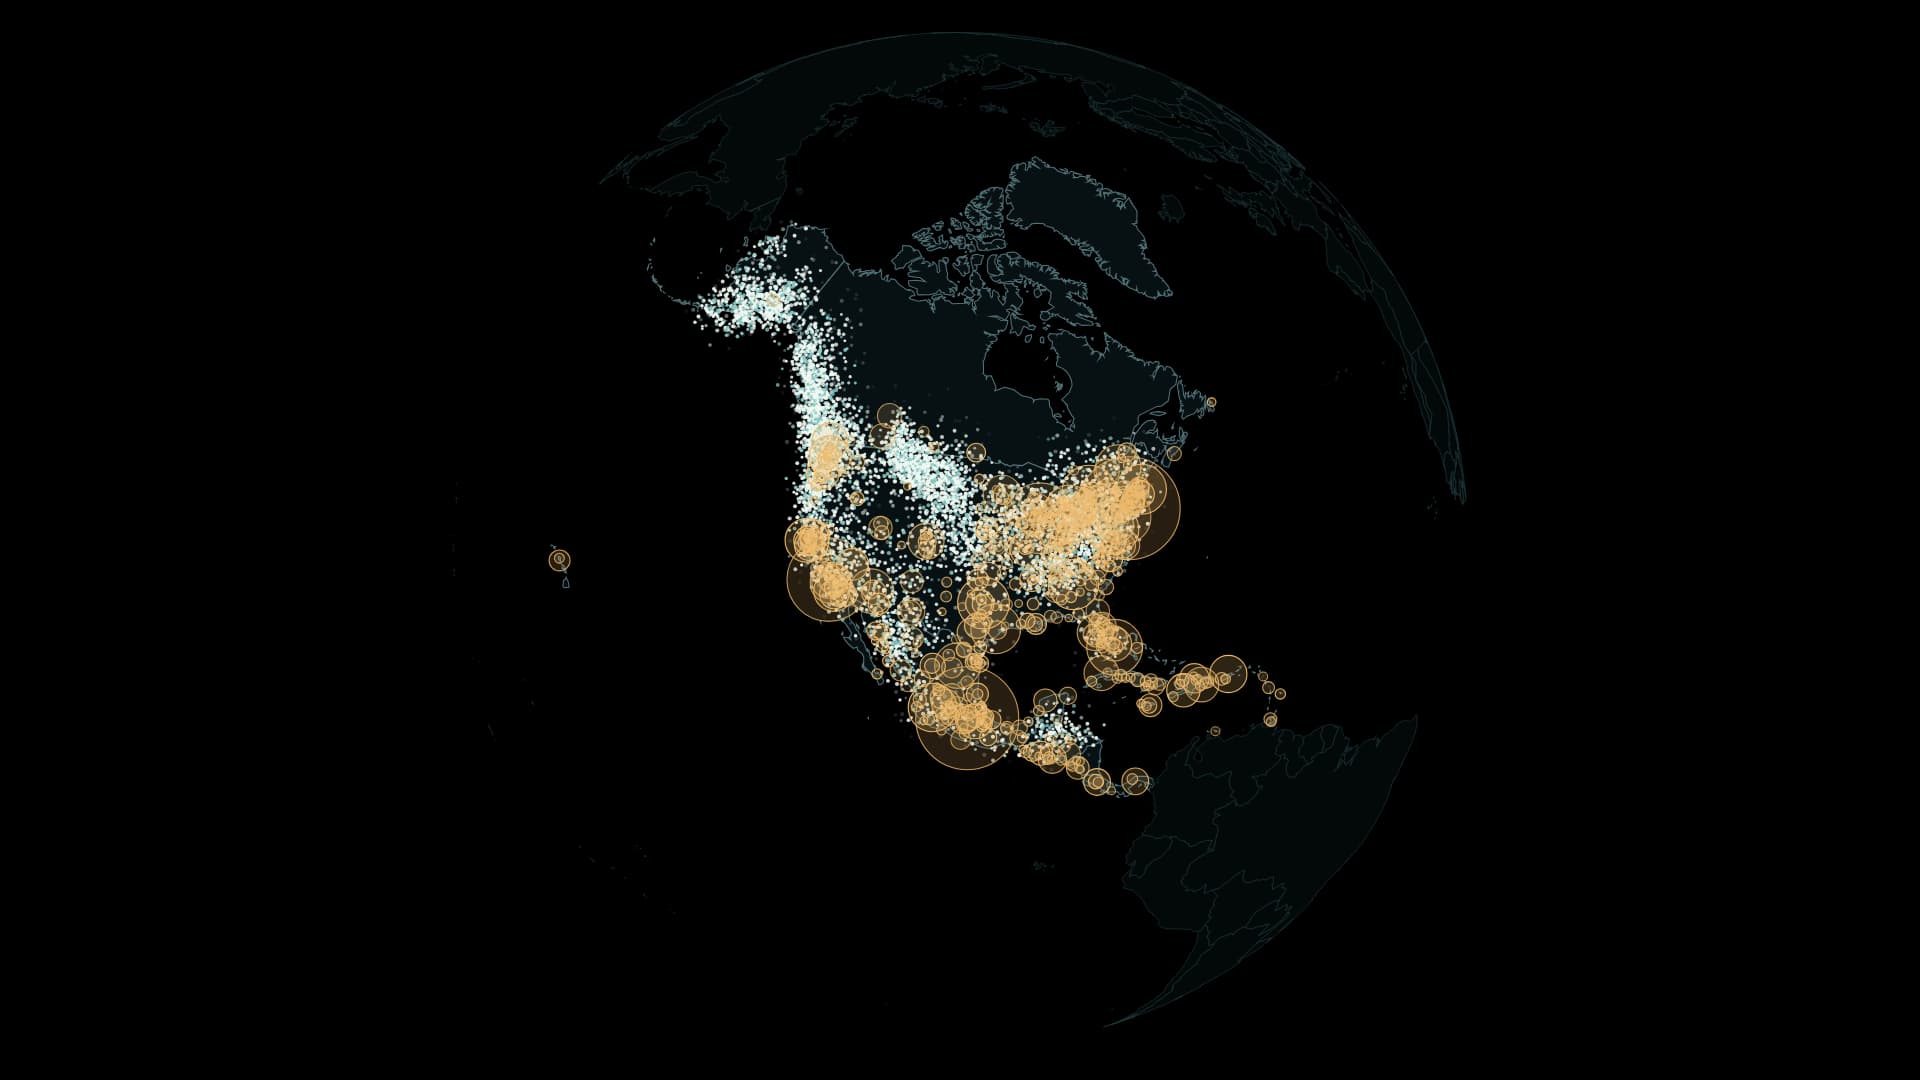
Across North America, from spring to winter. Quiet particles reveal changing seasonal distributions from weekly models of six species.
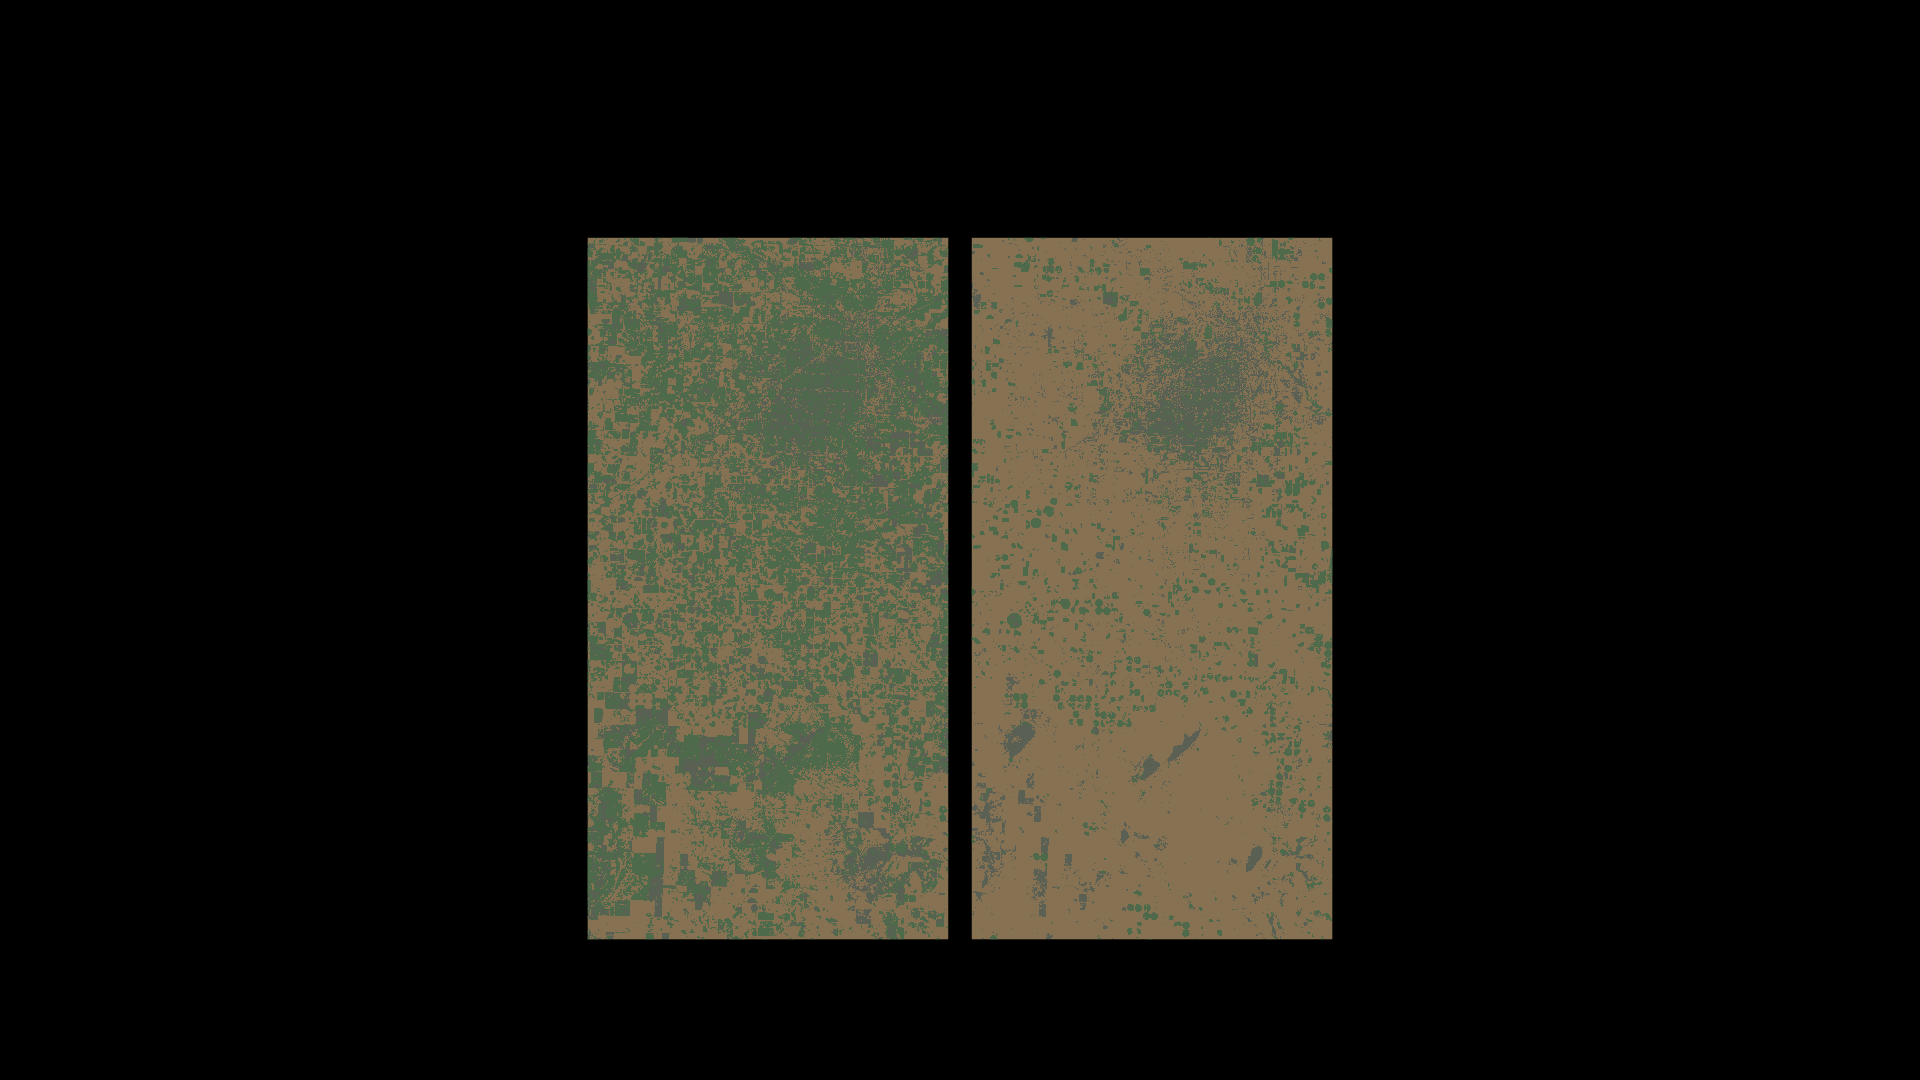
The same landscape in September 2025 and 2026. Circular irrigation fields bring the water behind cotton into view.
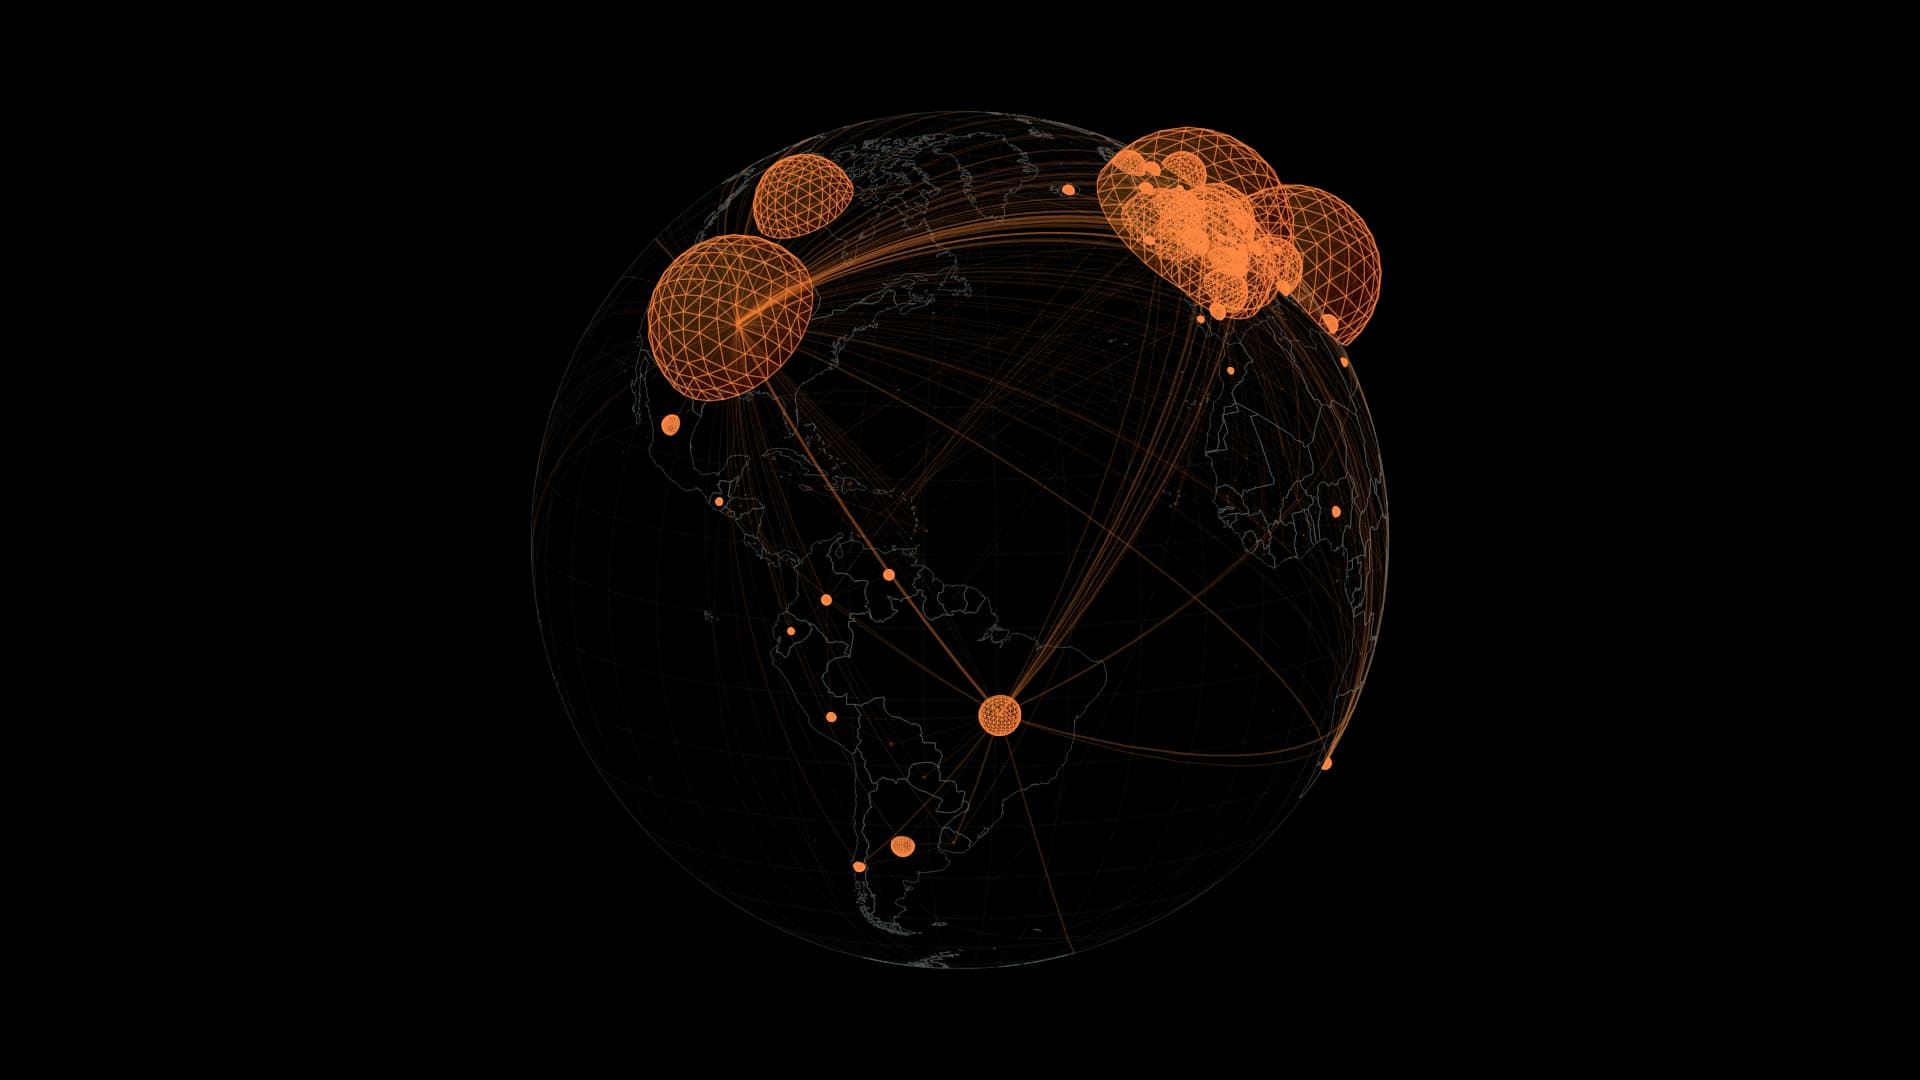
Transparent red–orange domes and the networks connecting the world. Follow a year of global daily reports on the timeline.
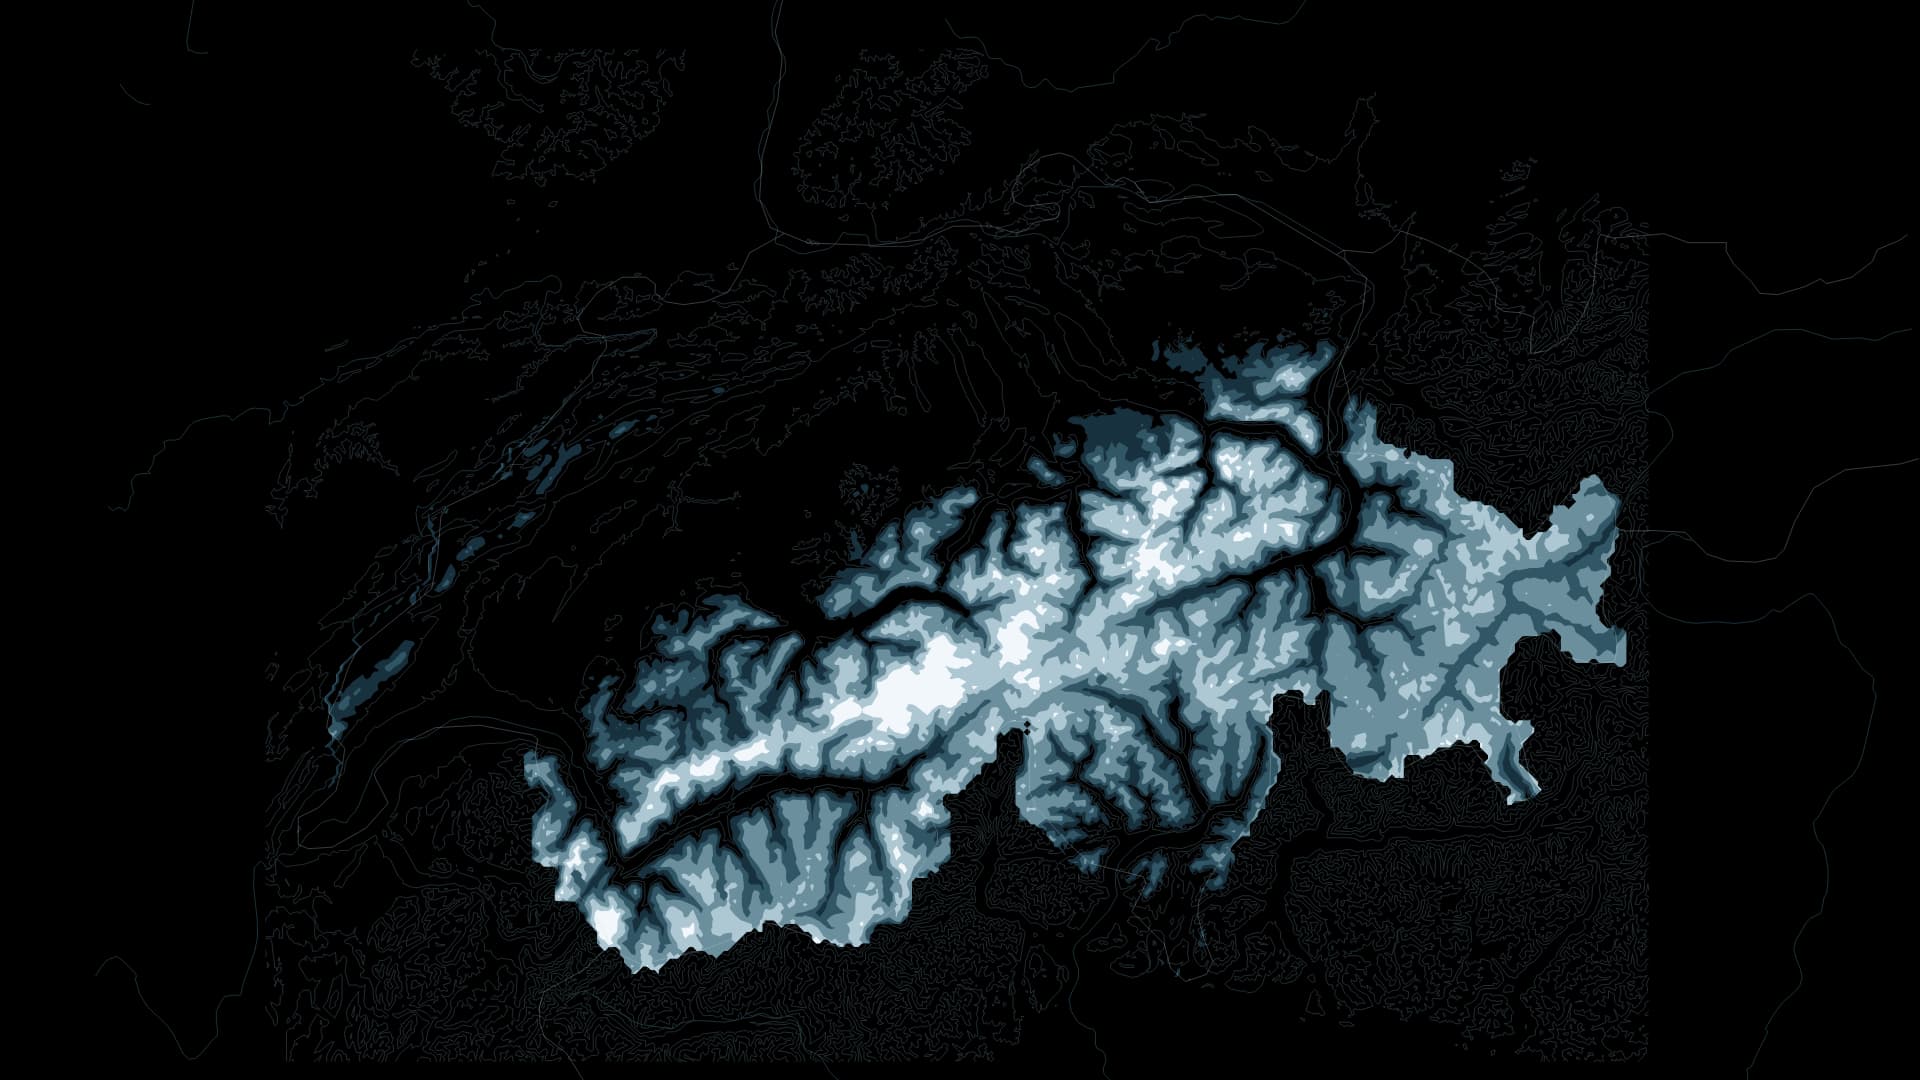
Across 40 years, 1982–2021, visit the day with the smallest estimated snow area in each March and follow the water held in snow across the Swiss Alps and their surroundings.
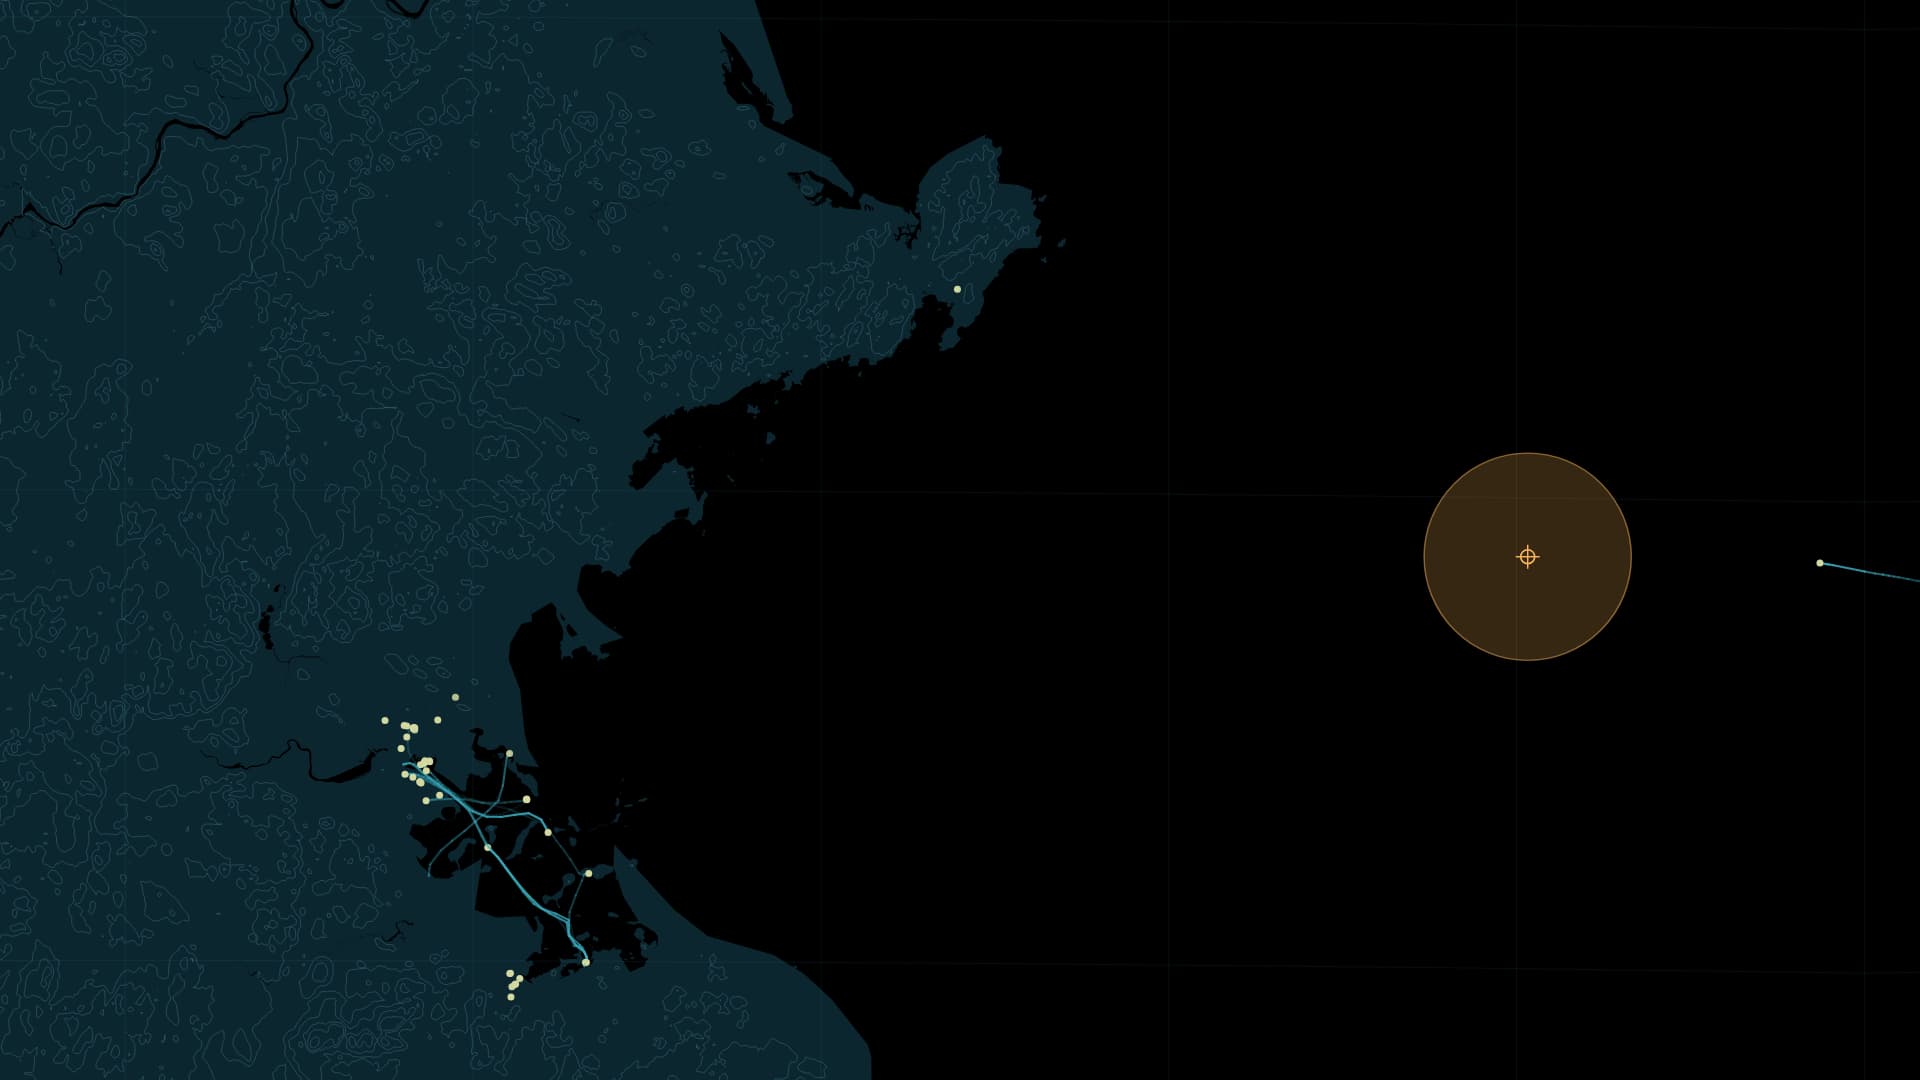
Vessel positions above the surface and a hydrophone below it share one clock: 23 November 2020, off Boston.
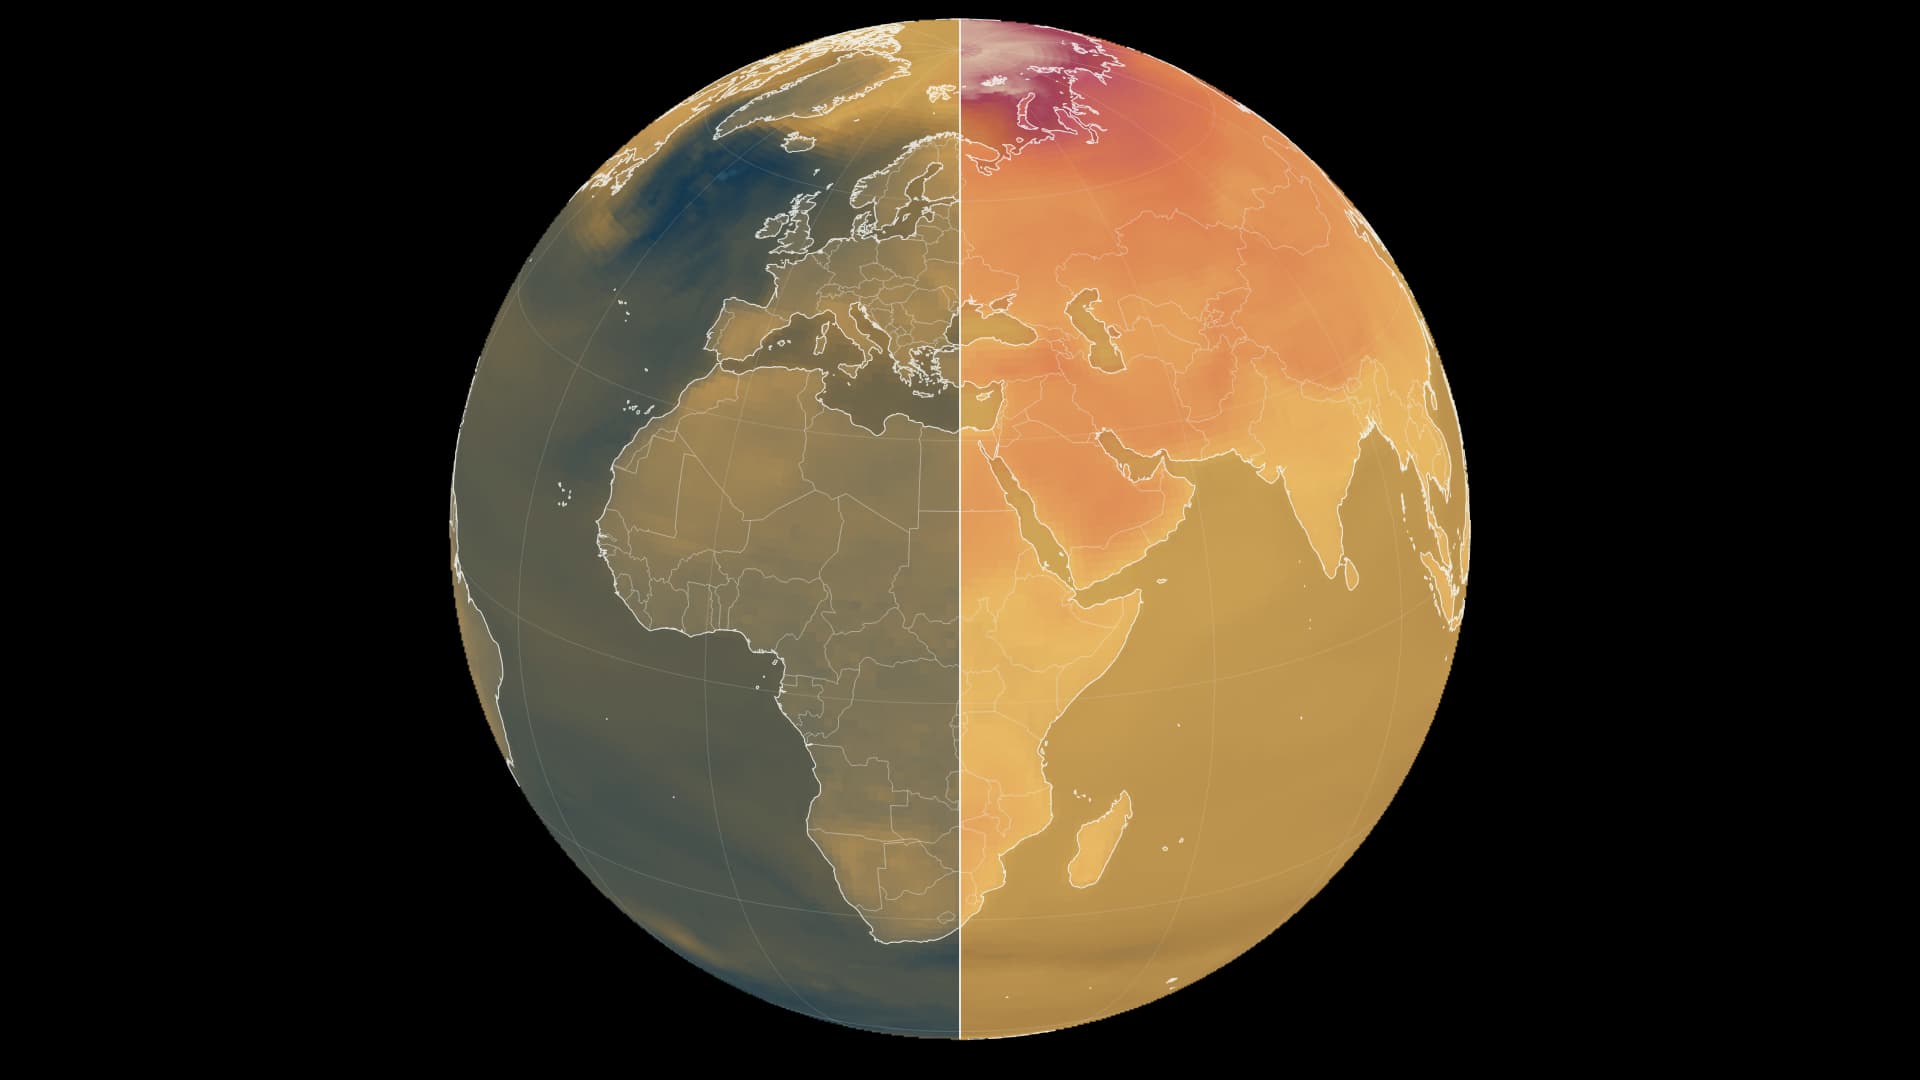
Two emissions pathways, one shared colour scale. Compare warming relative to 1995–2014.
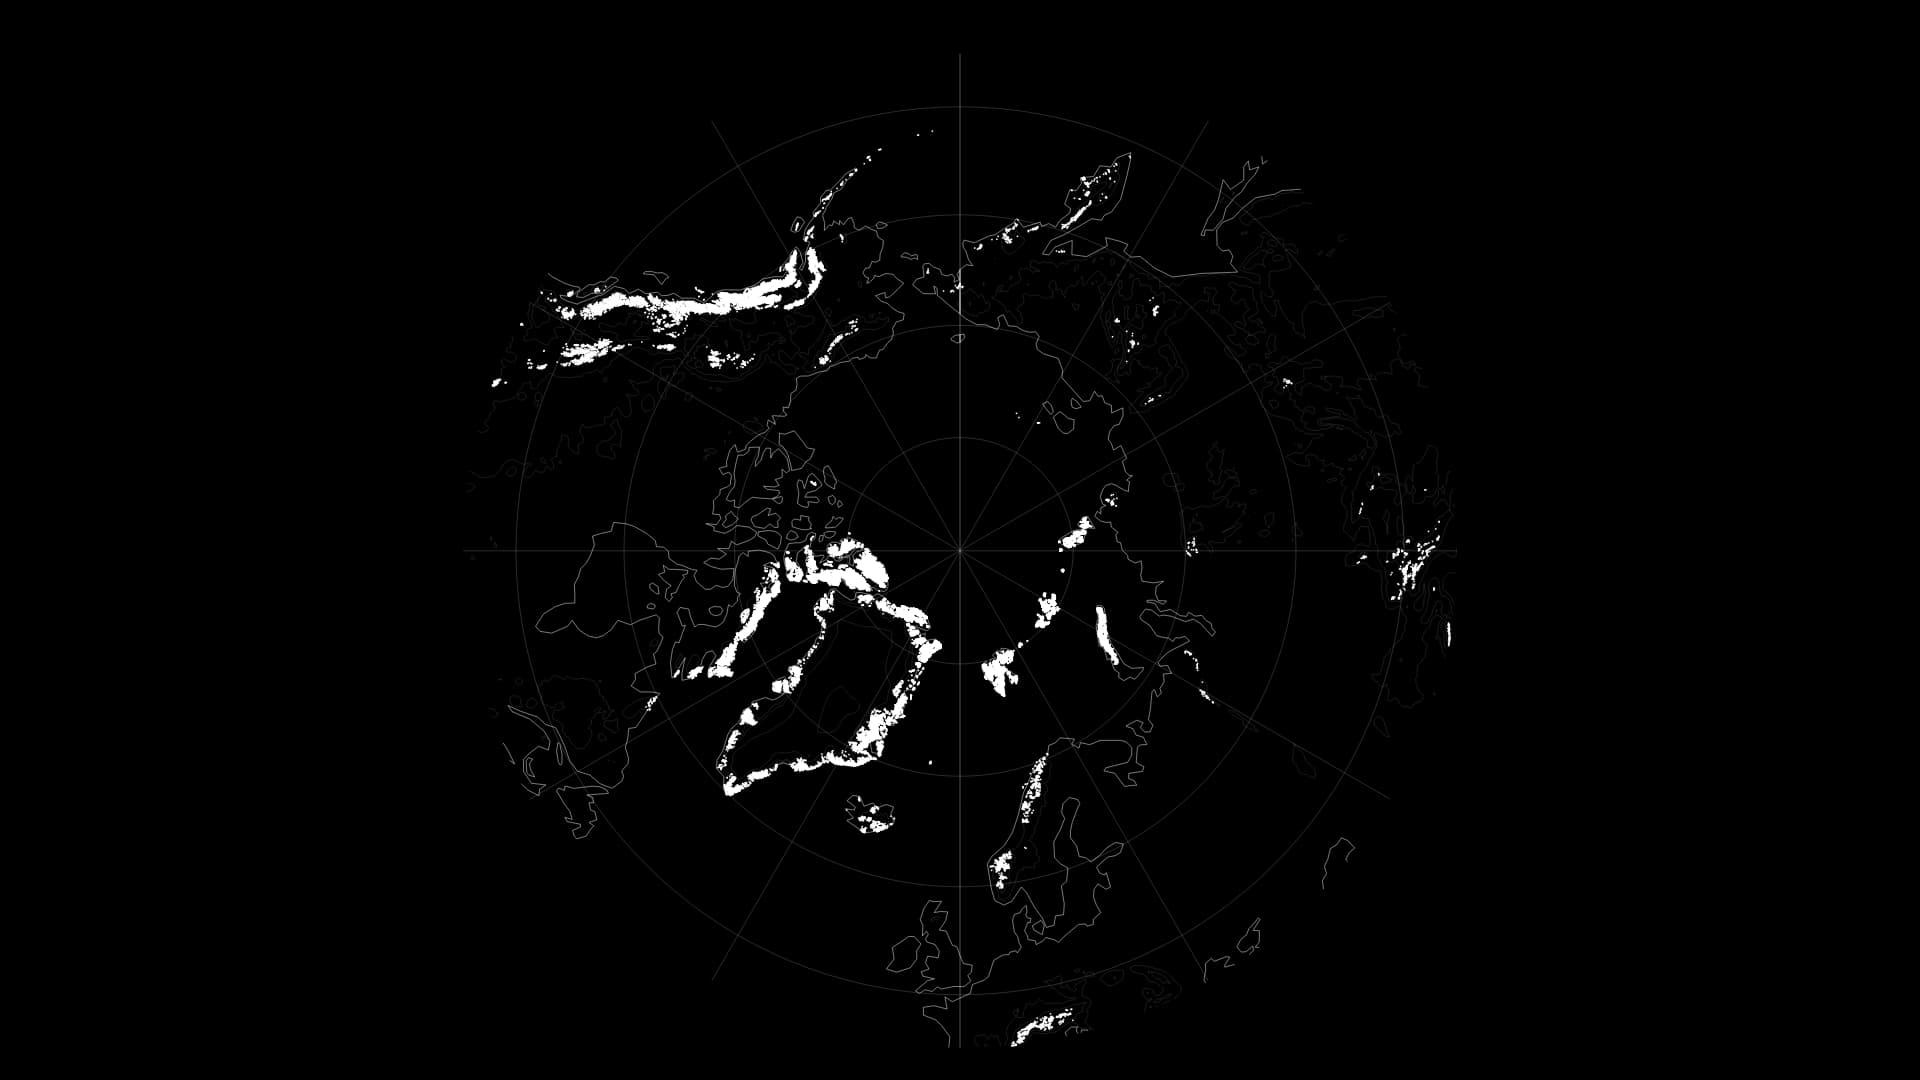
Open the Earth around the North Pole and Alaska, Canada’s islands, Greenland’s margins and Svalbard surround one ocean. Their glaciers have accumulated winter snow and released water through the warmer season. Looking at their mass changes asks a different question from simply tracing their white outlines: how much ice remains stored there?
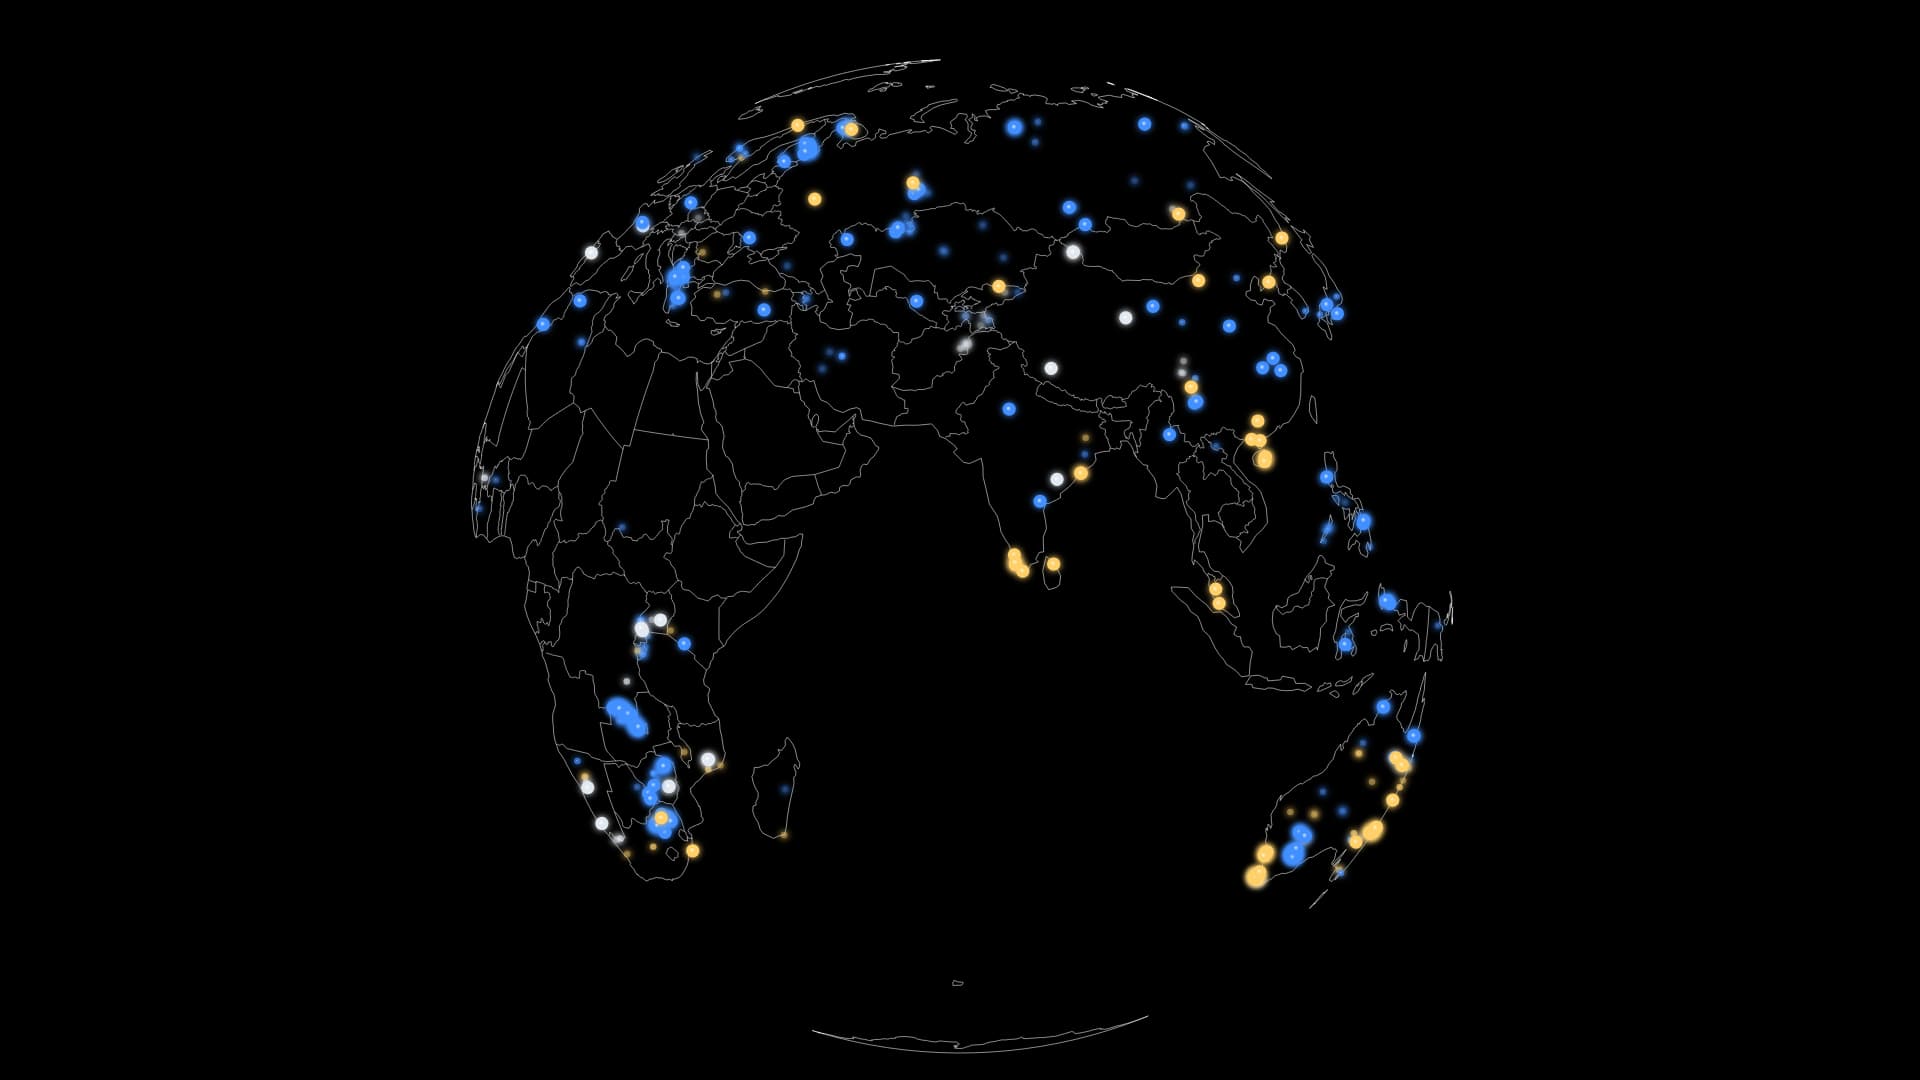
A phone charges. A train motor turns. Behind these familiar actions lie rocks formed long ago and people extracting useful materials from them. Starting with rare earths used in motor magnets, we also follow lithium and cobalt used in batteries. Mapping these resources brings their different roles in everyday products back to particular places.
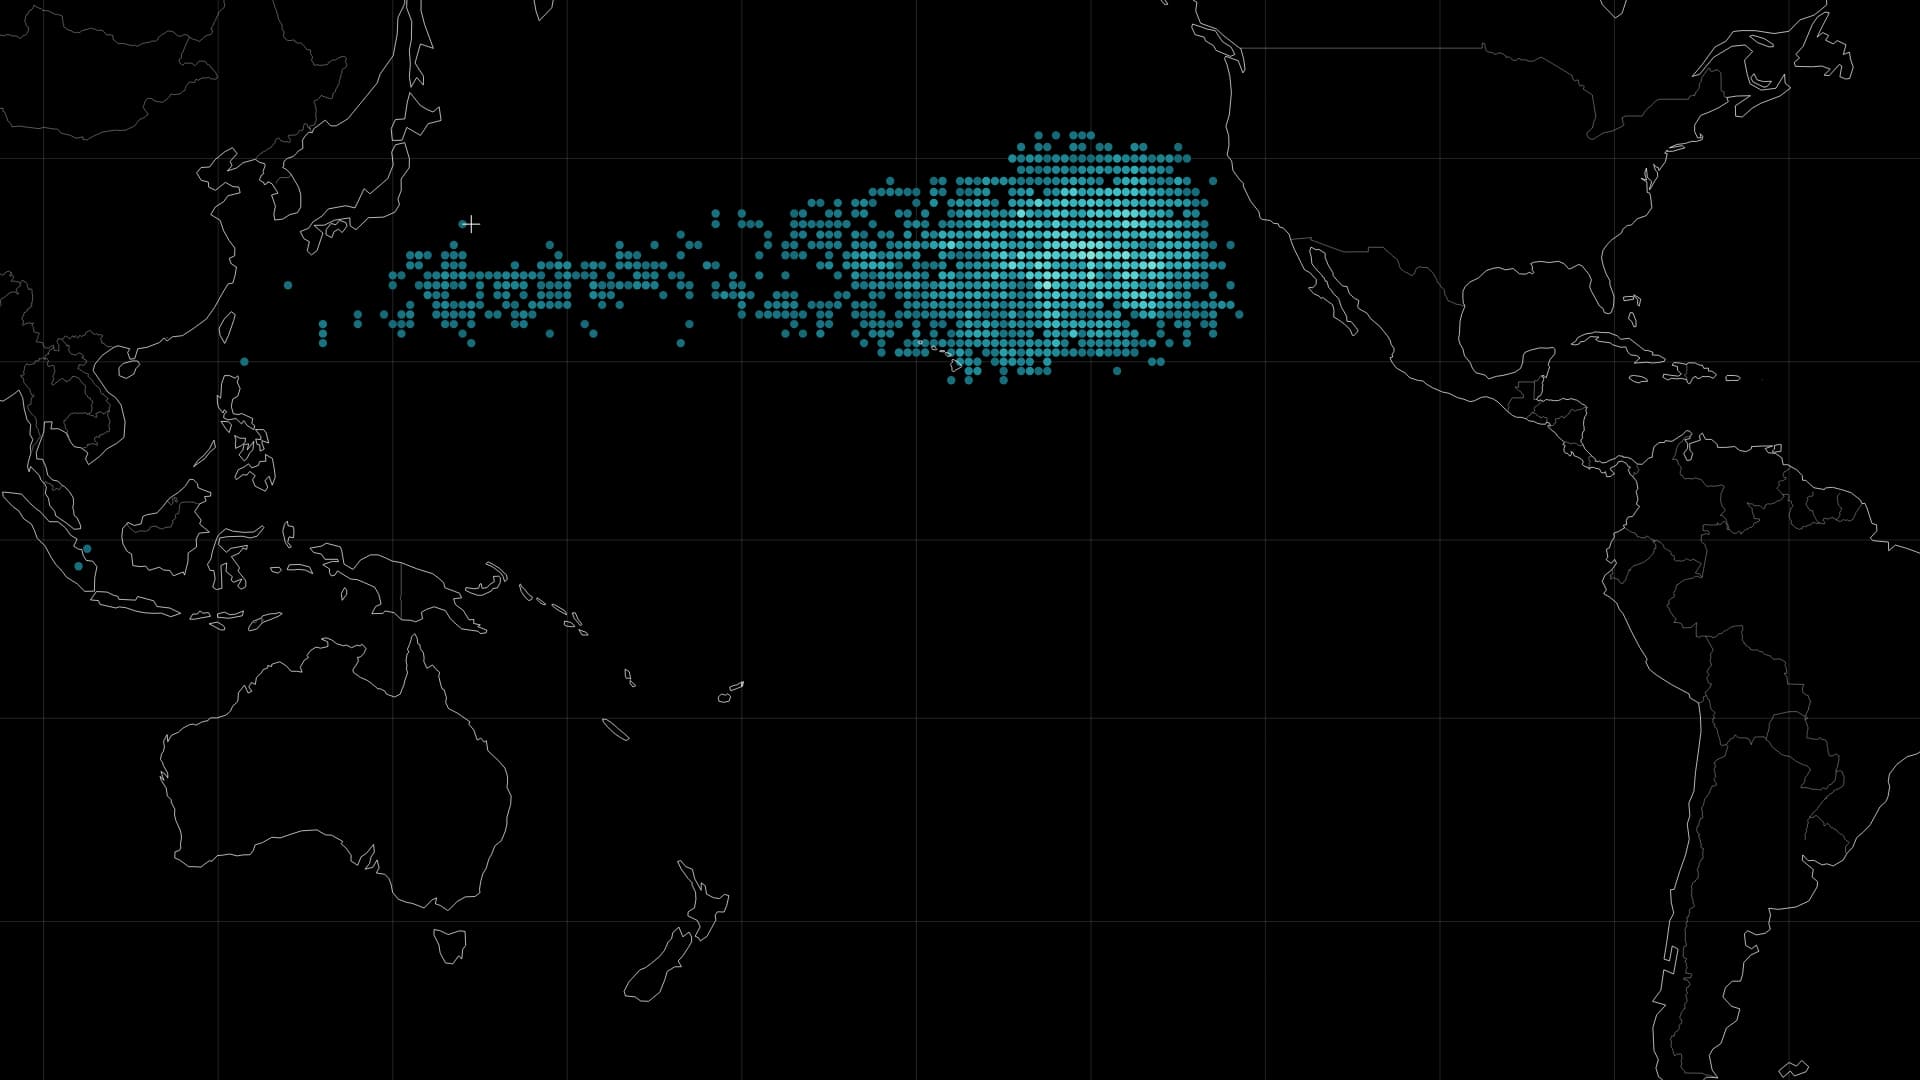
Plastic has a journey after we lose sight of it at the shore. A fragment moving with the waves knows neither city boundaries nor national borders. Following a release east of Japan into the Pacific brings a distant environmental problem back to the things people use and discard on land.
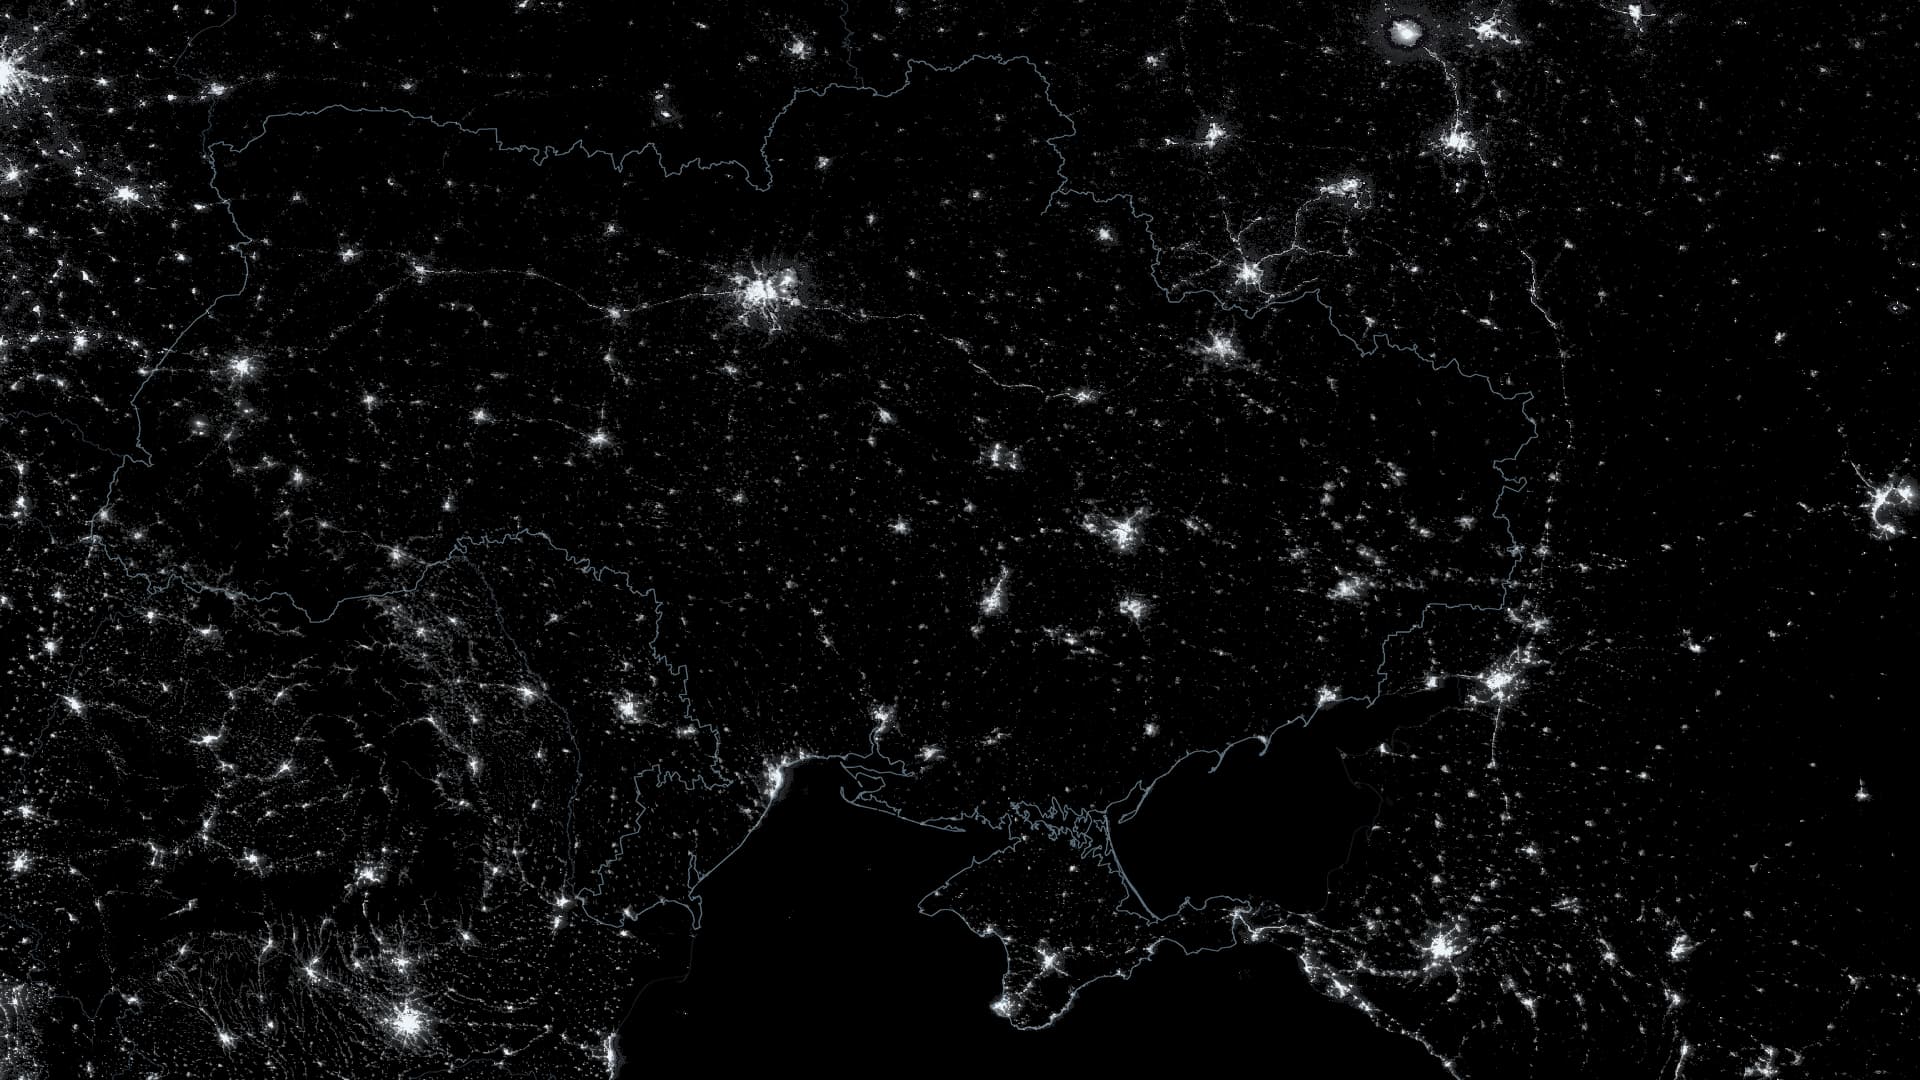
From September 2021 to autumn 2023, begin with Ukraine’s lights before the full-scale invasion of 24 February 2022, and follow their changes alongside the work needed to keep electricity reaching people.
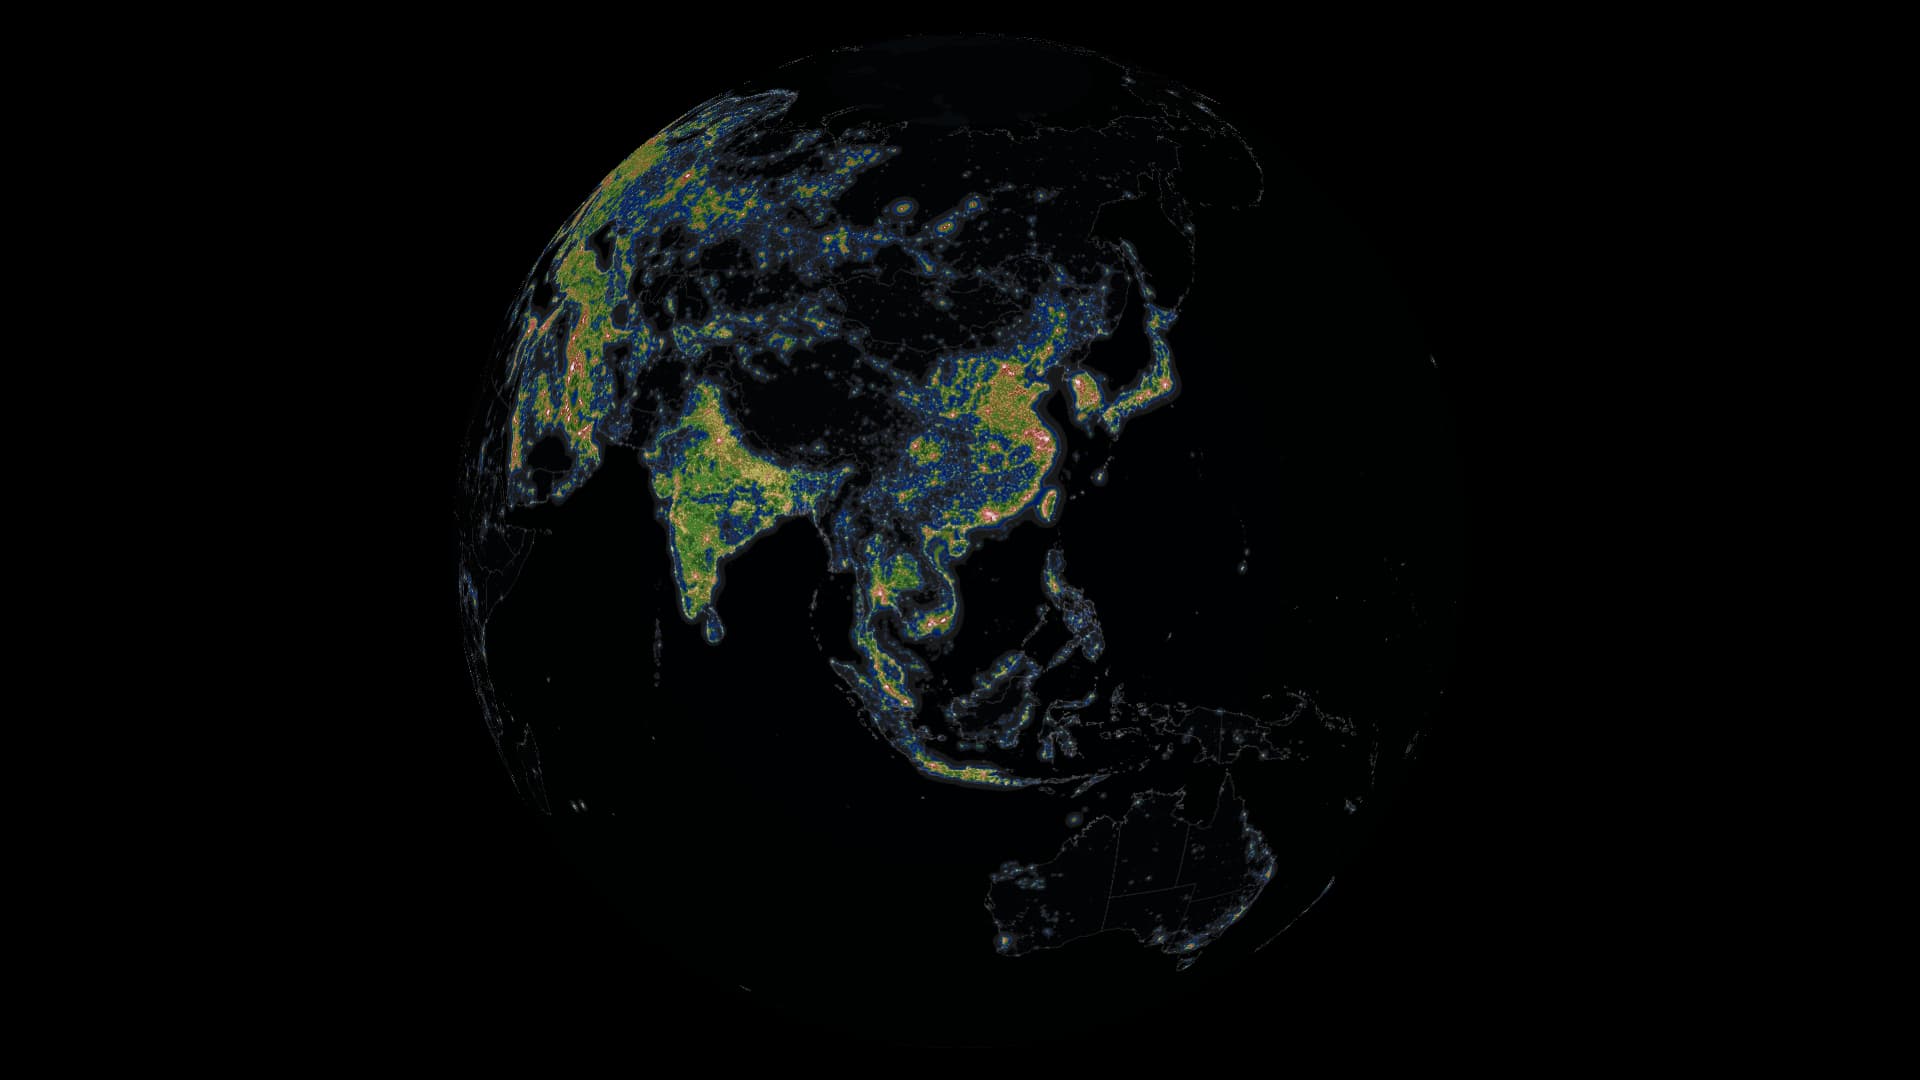
Citizen observations from 2011–2022 revealed a change in star visibility equivalent to average annual sky brightening of 9.6%. Light created in a city can spread into the sky far beyond it.
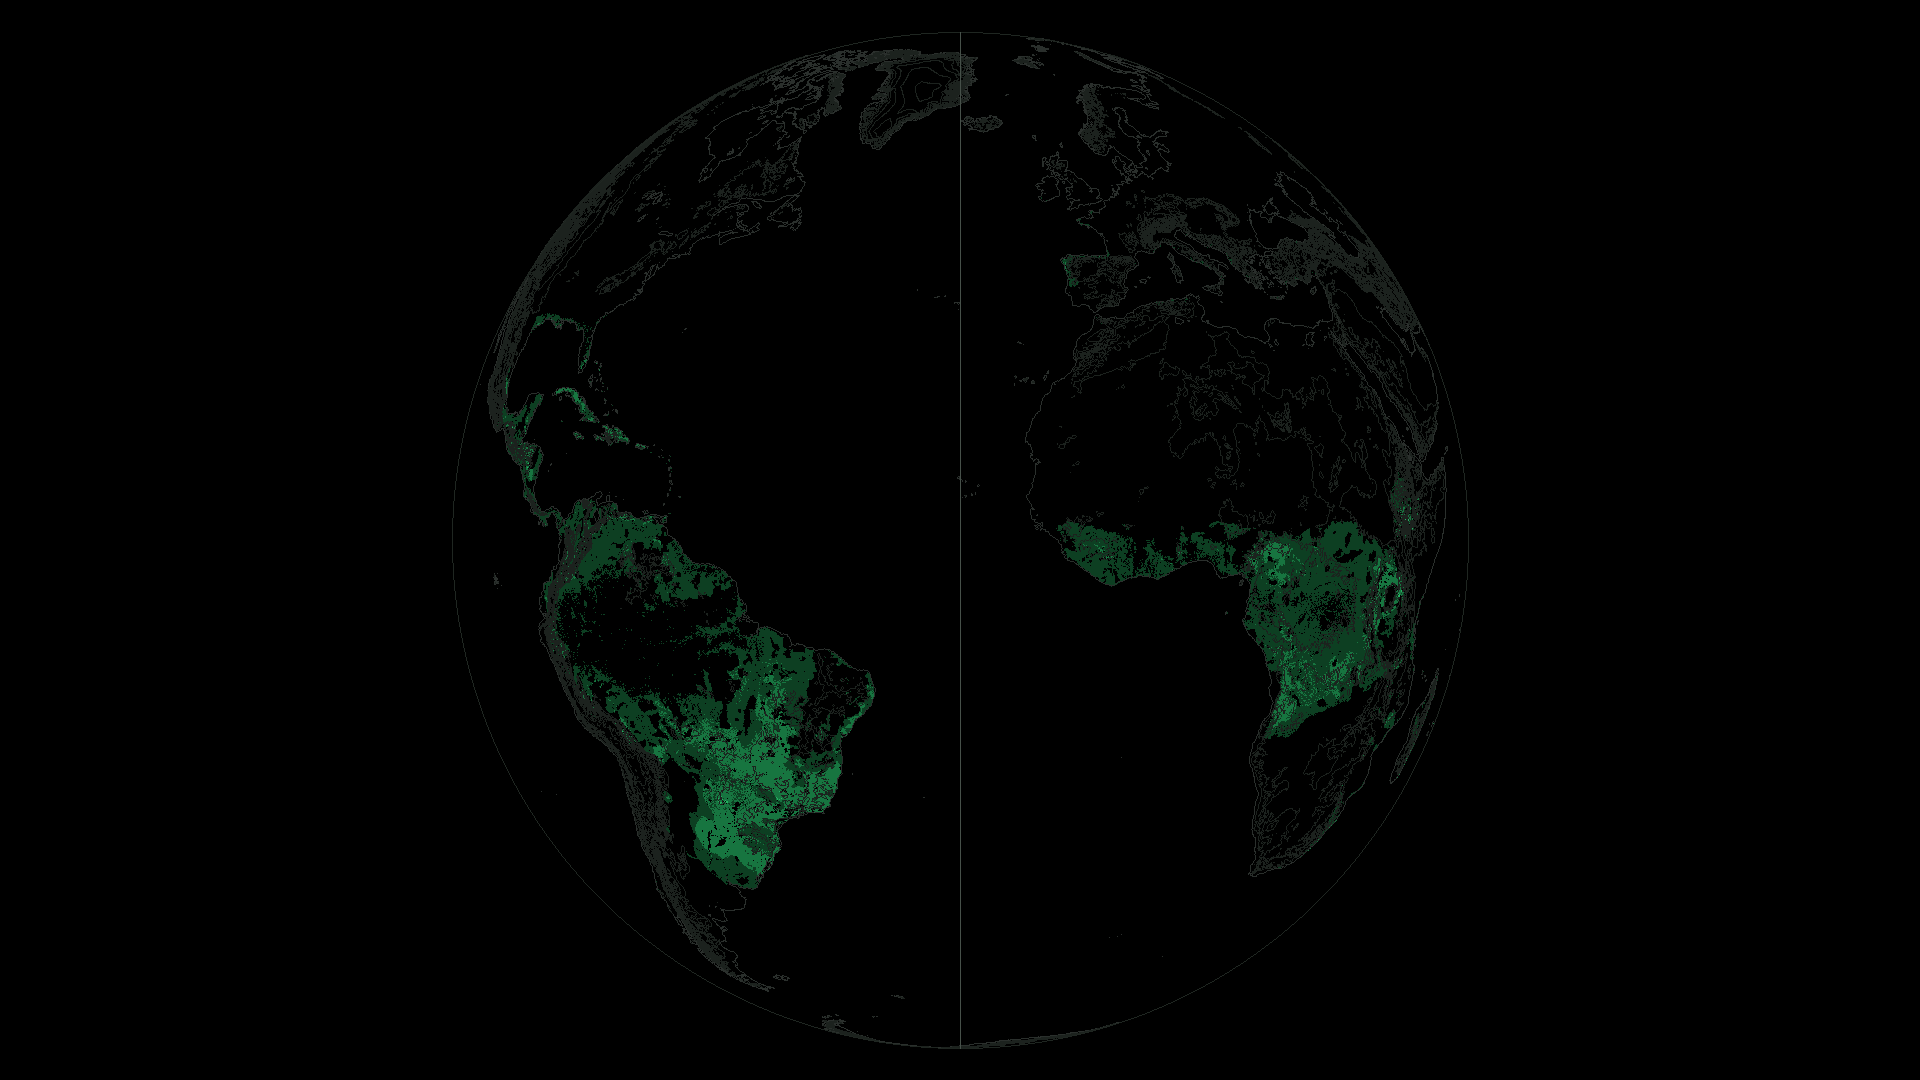
Land in the highest suitability class for rainfed Arabica could shrink by 53.7% worldwide around 2050. One climate scenario puts a number on a change facing both coffee trees and the people who grow them.
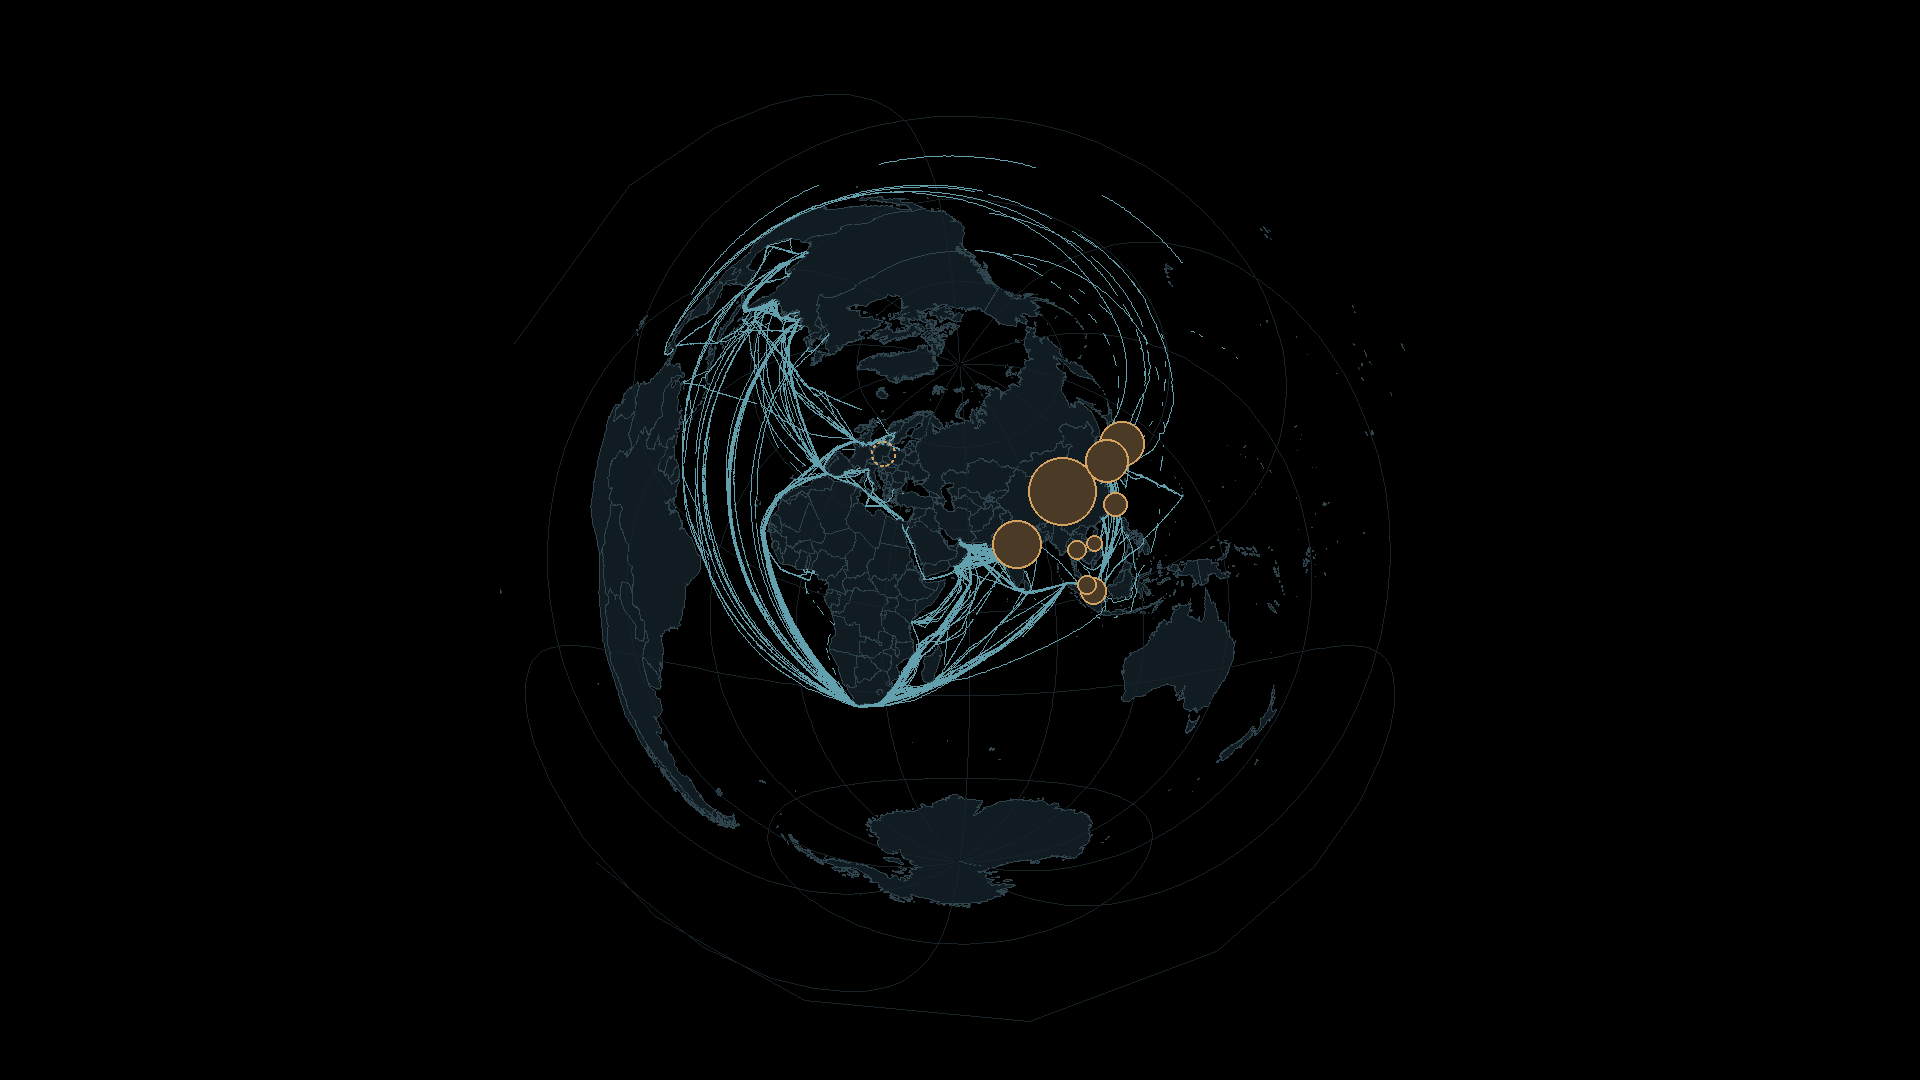
Place the Strait of Hormuz at the centre of the globe. Ship observations and crude-oil destinations from 2025 show how a small passage reaches into distant lives.
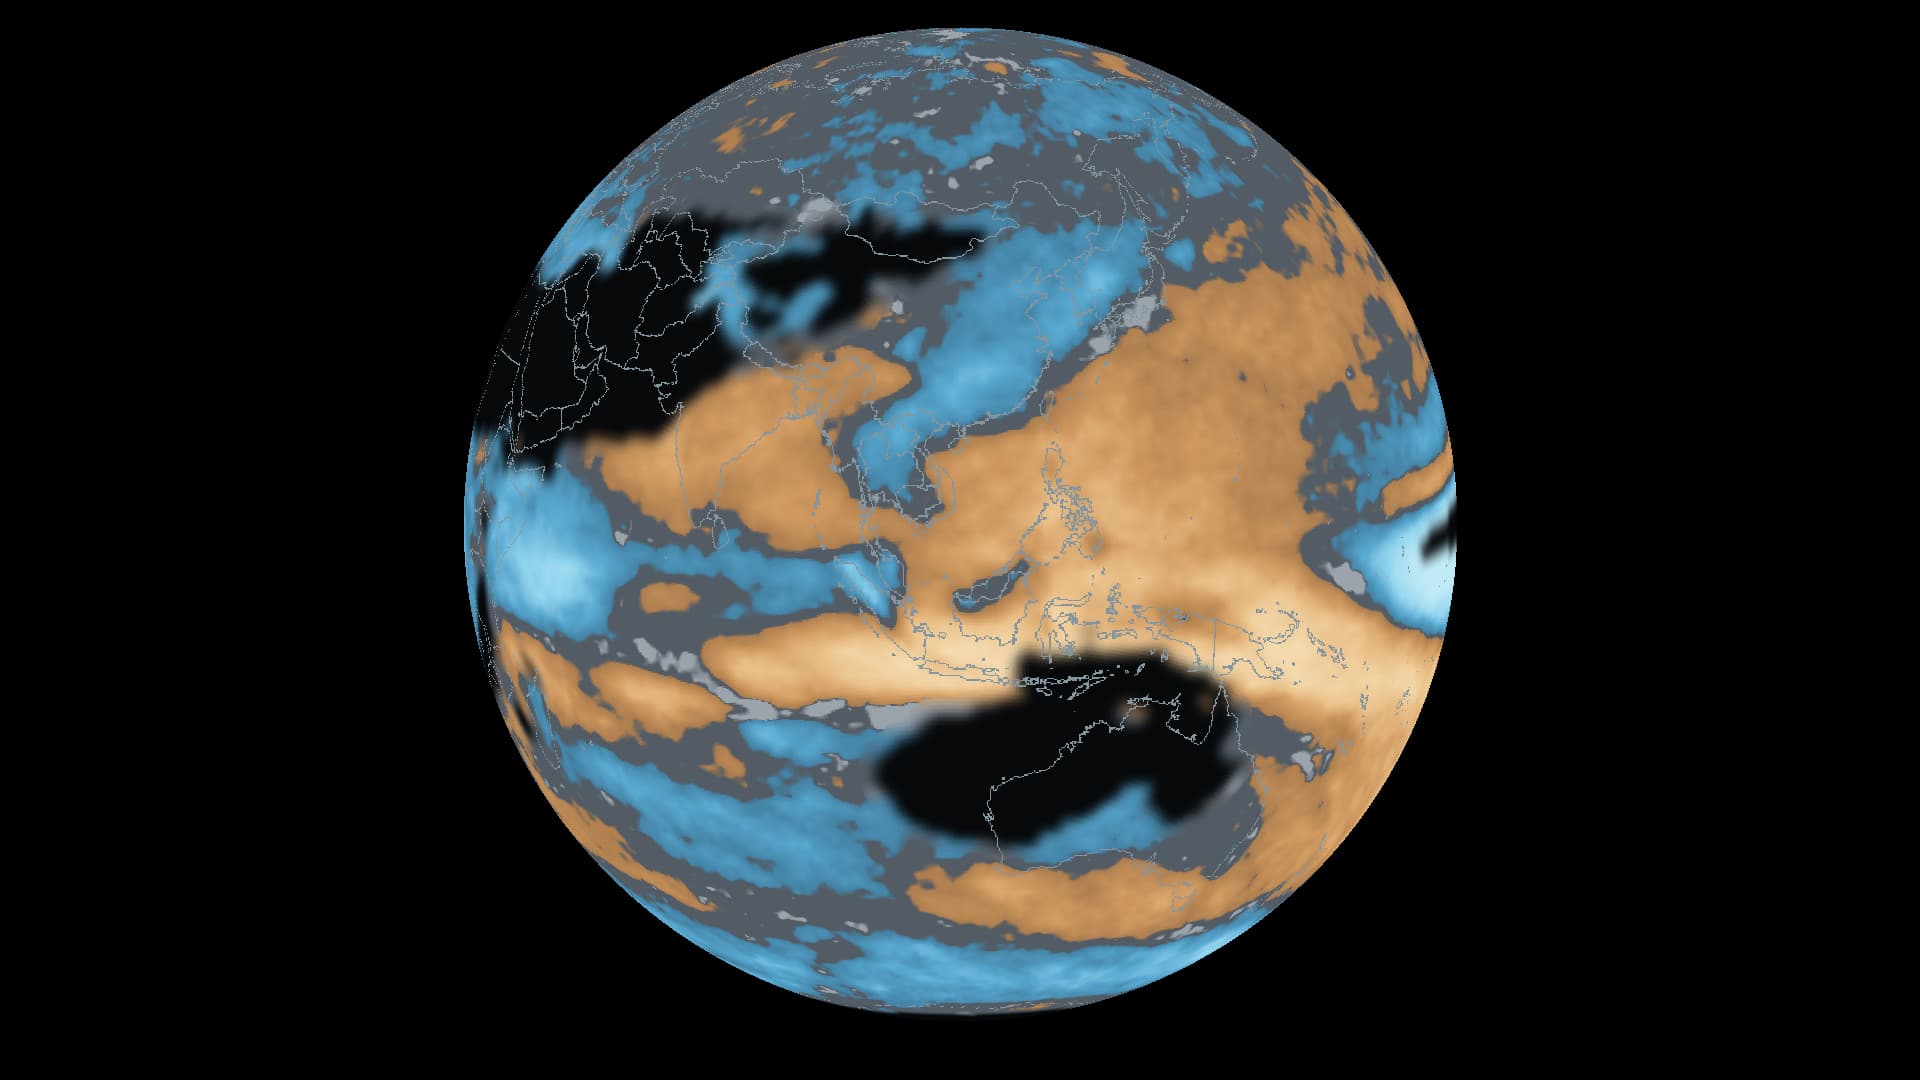
Watch the same globe across six forecast months, from autumn 2026 to spring 2027. The places leaning wetter or drier change with the season.
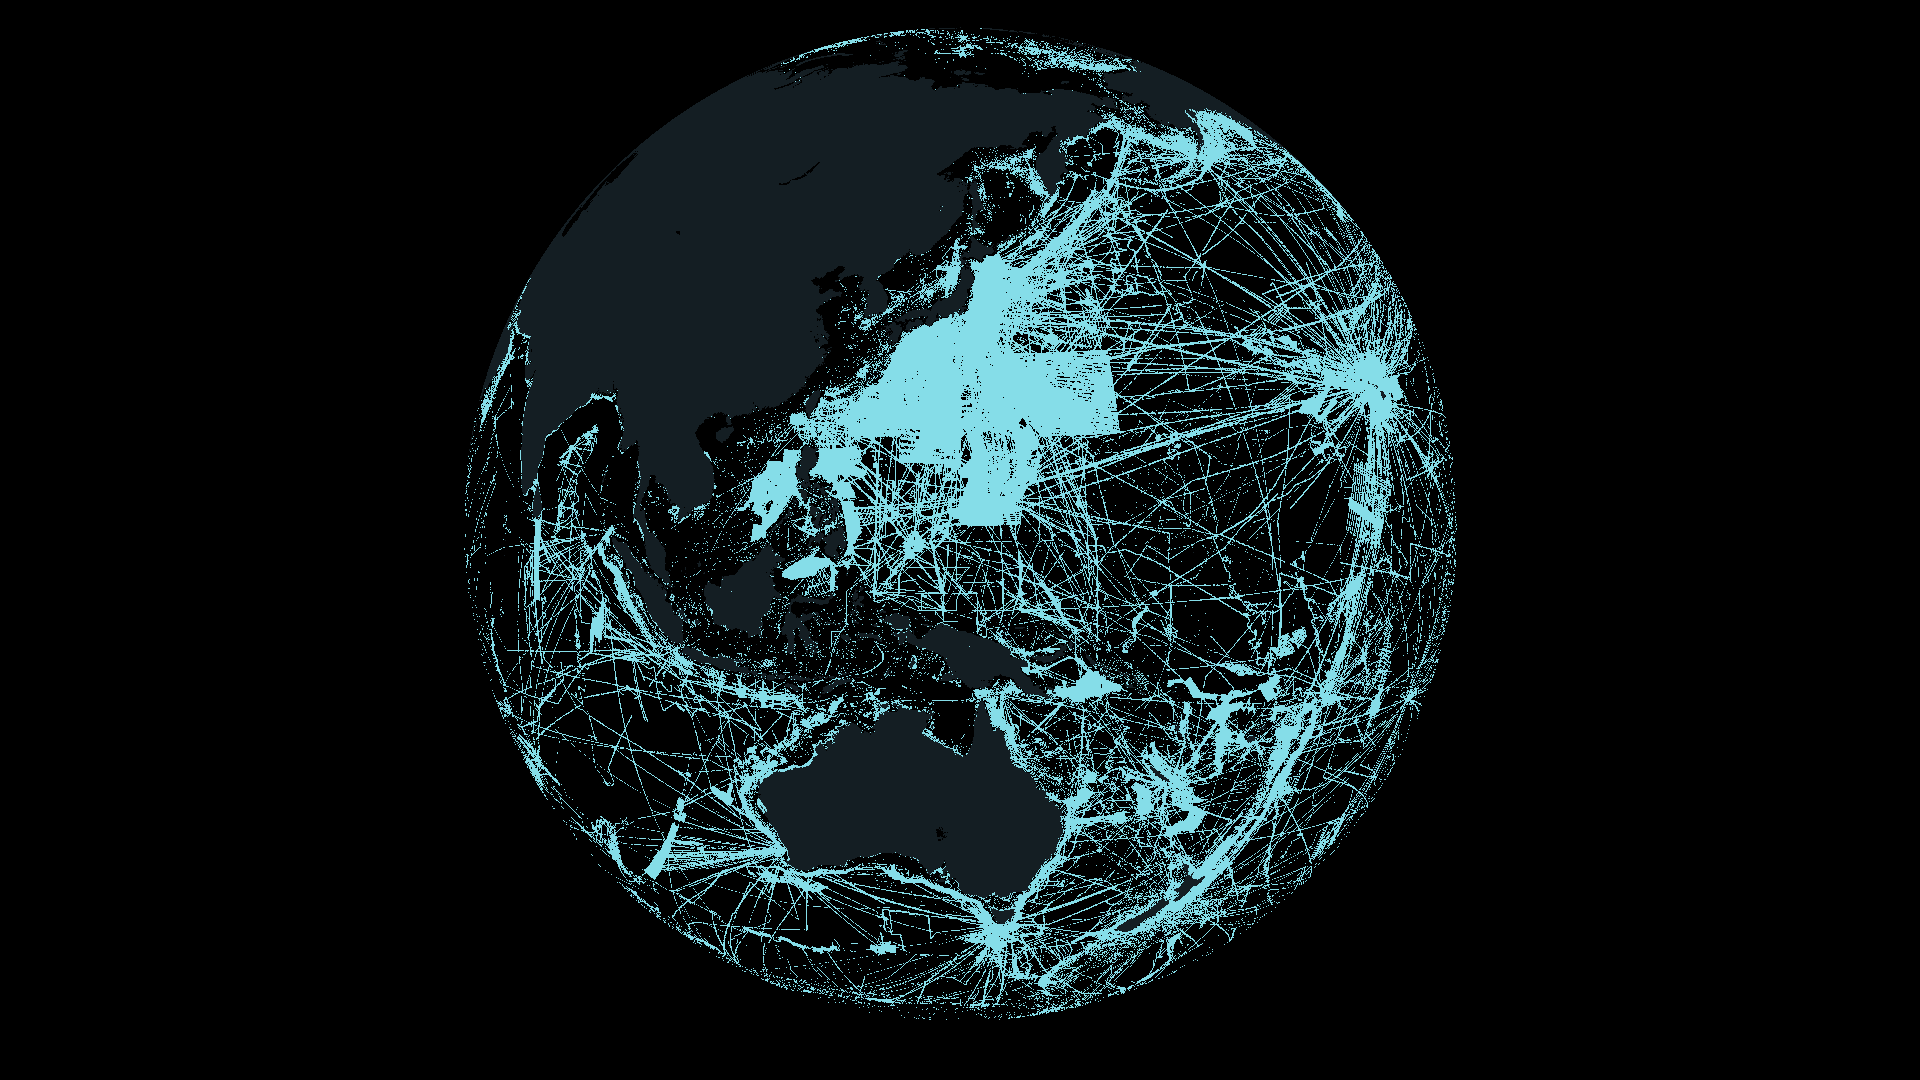
28.7% of the world’s seafloor is mapped to the target standard. The figure announced on 20 April 2026 opens a view of how we have measured the ocean—and how much remains to resolve.
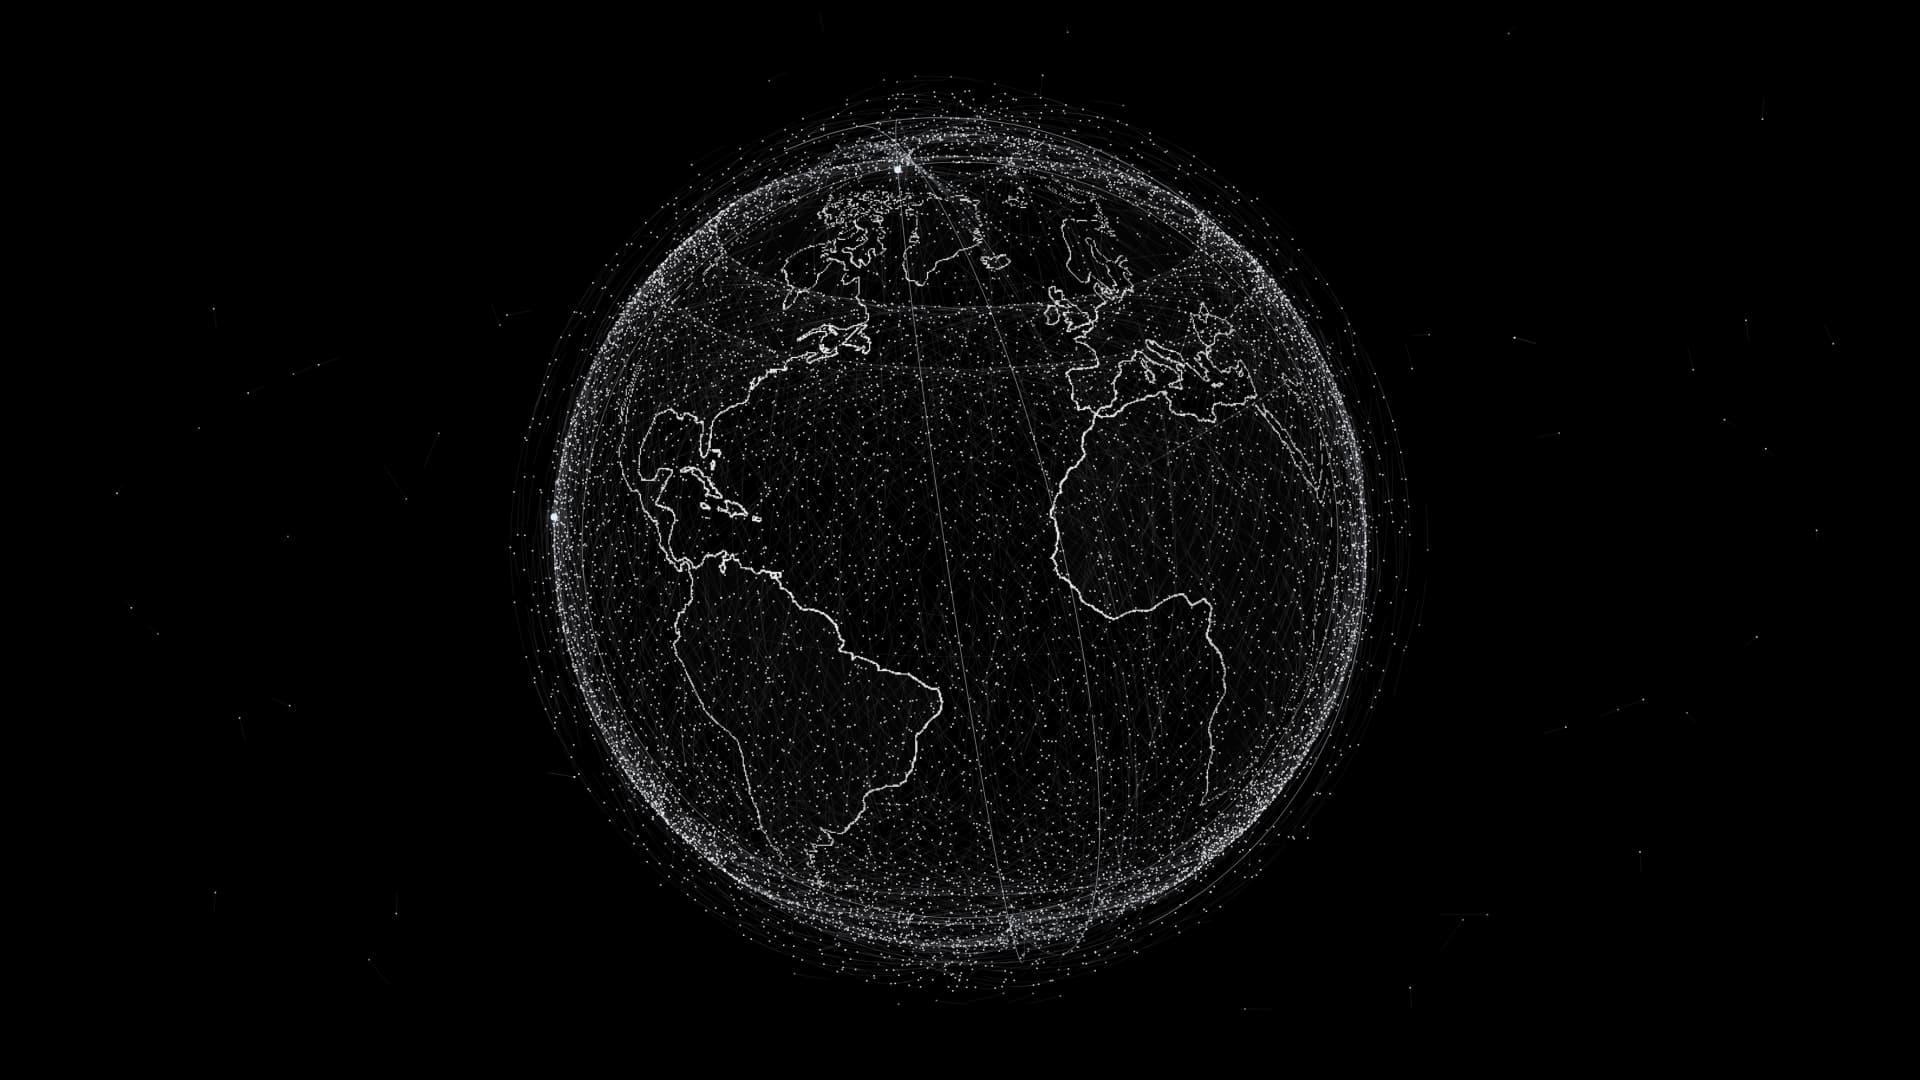
The predicted positions of 16,604 satellites reveal an orbital infrastructure serving communication, weather and navigation—and the work of keeping space usable.
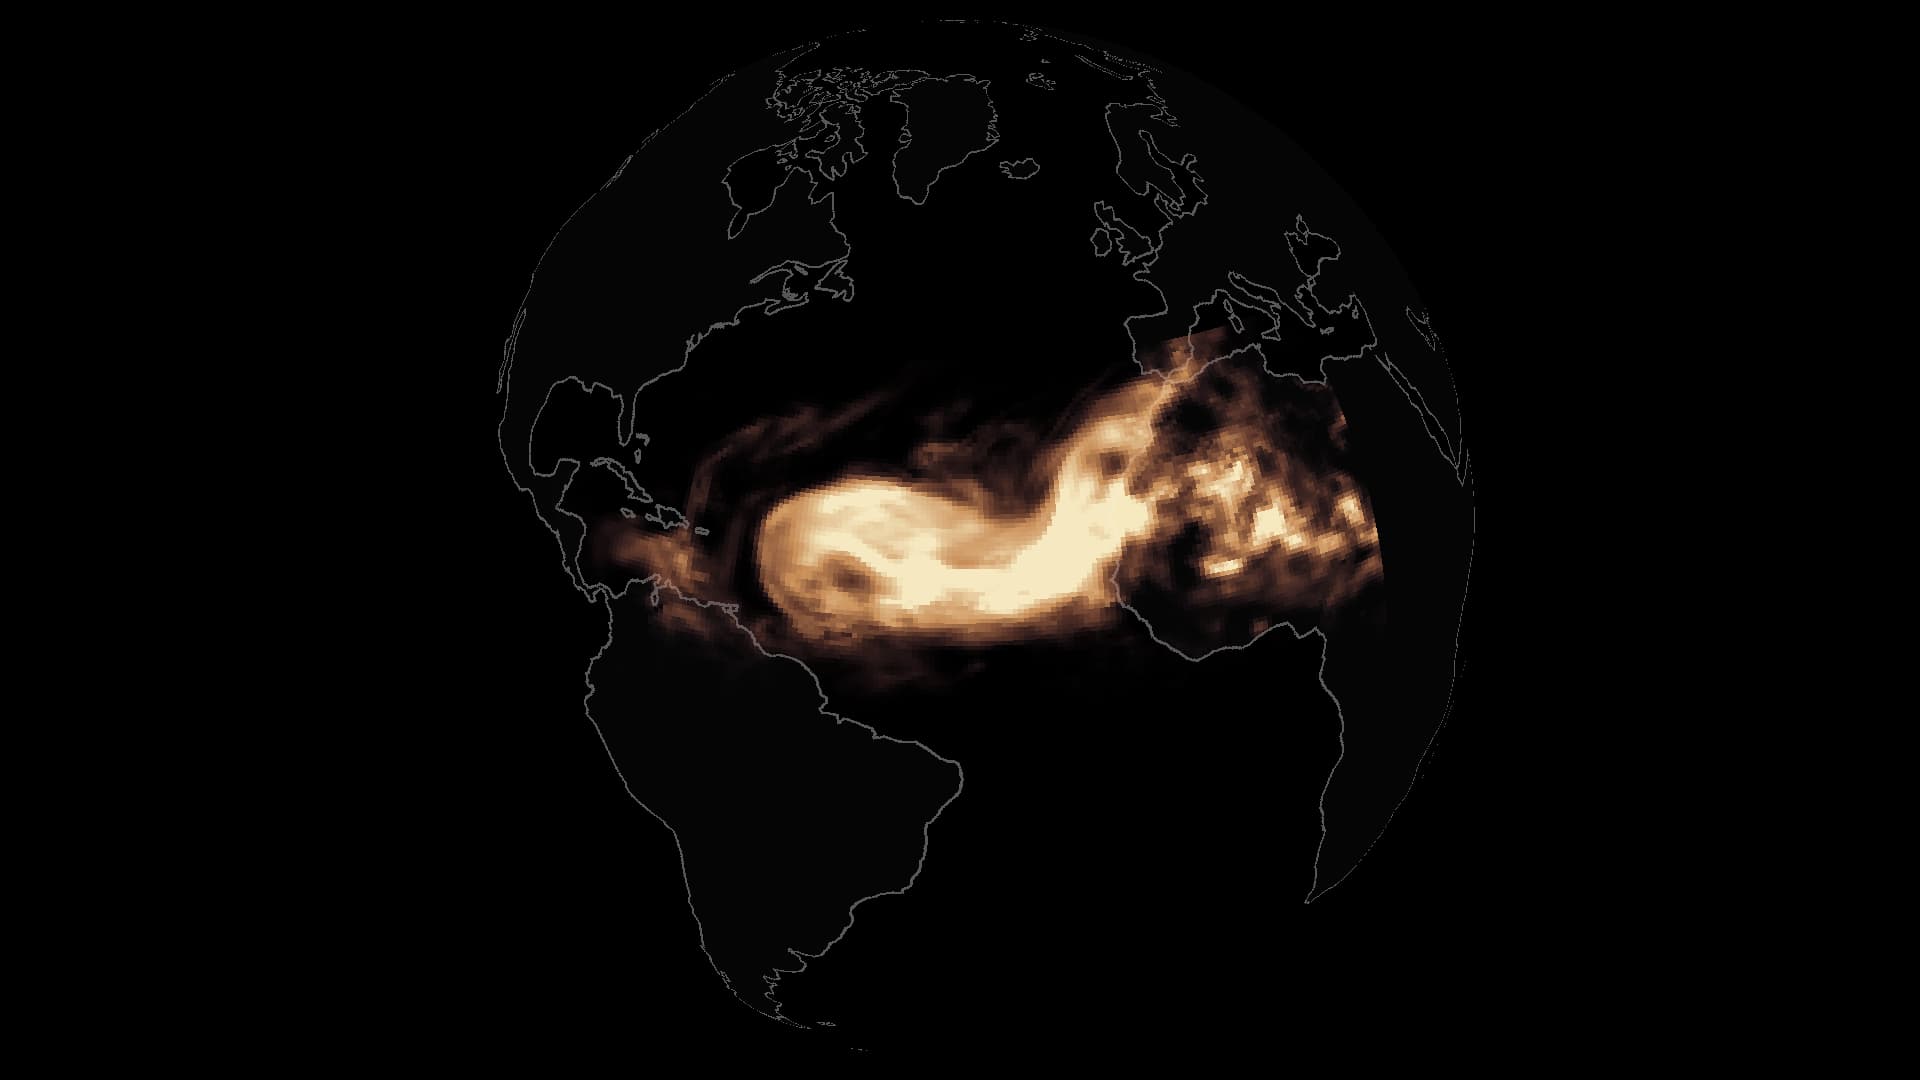
Dust fields from September 2026 reveal an atmospheric connection between West Africa, the Caribbean and a distant rainforest.
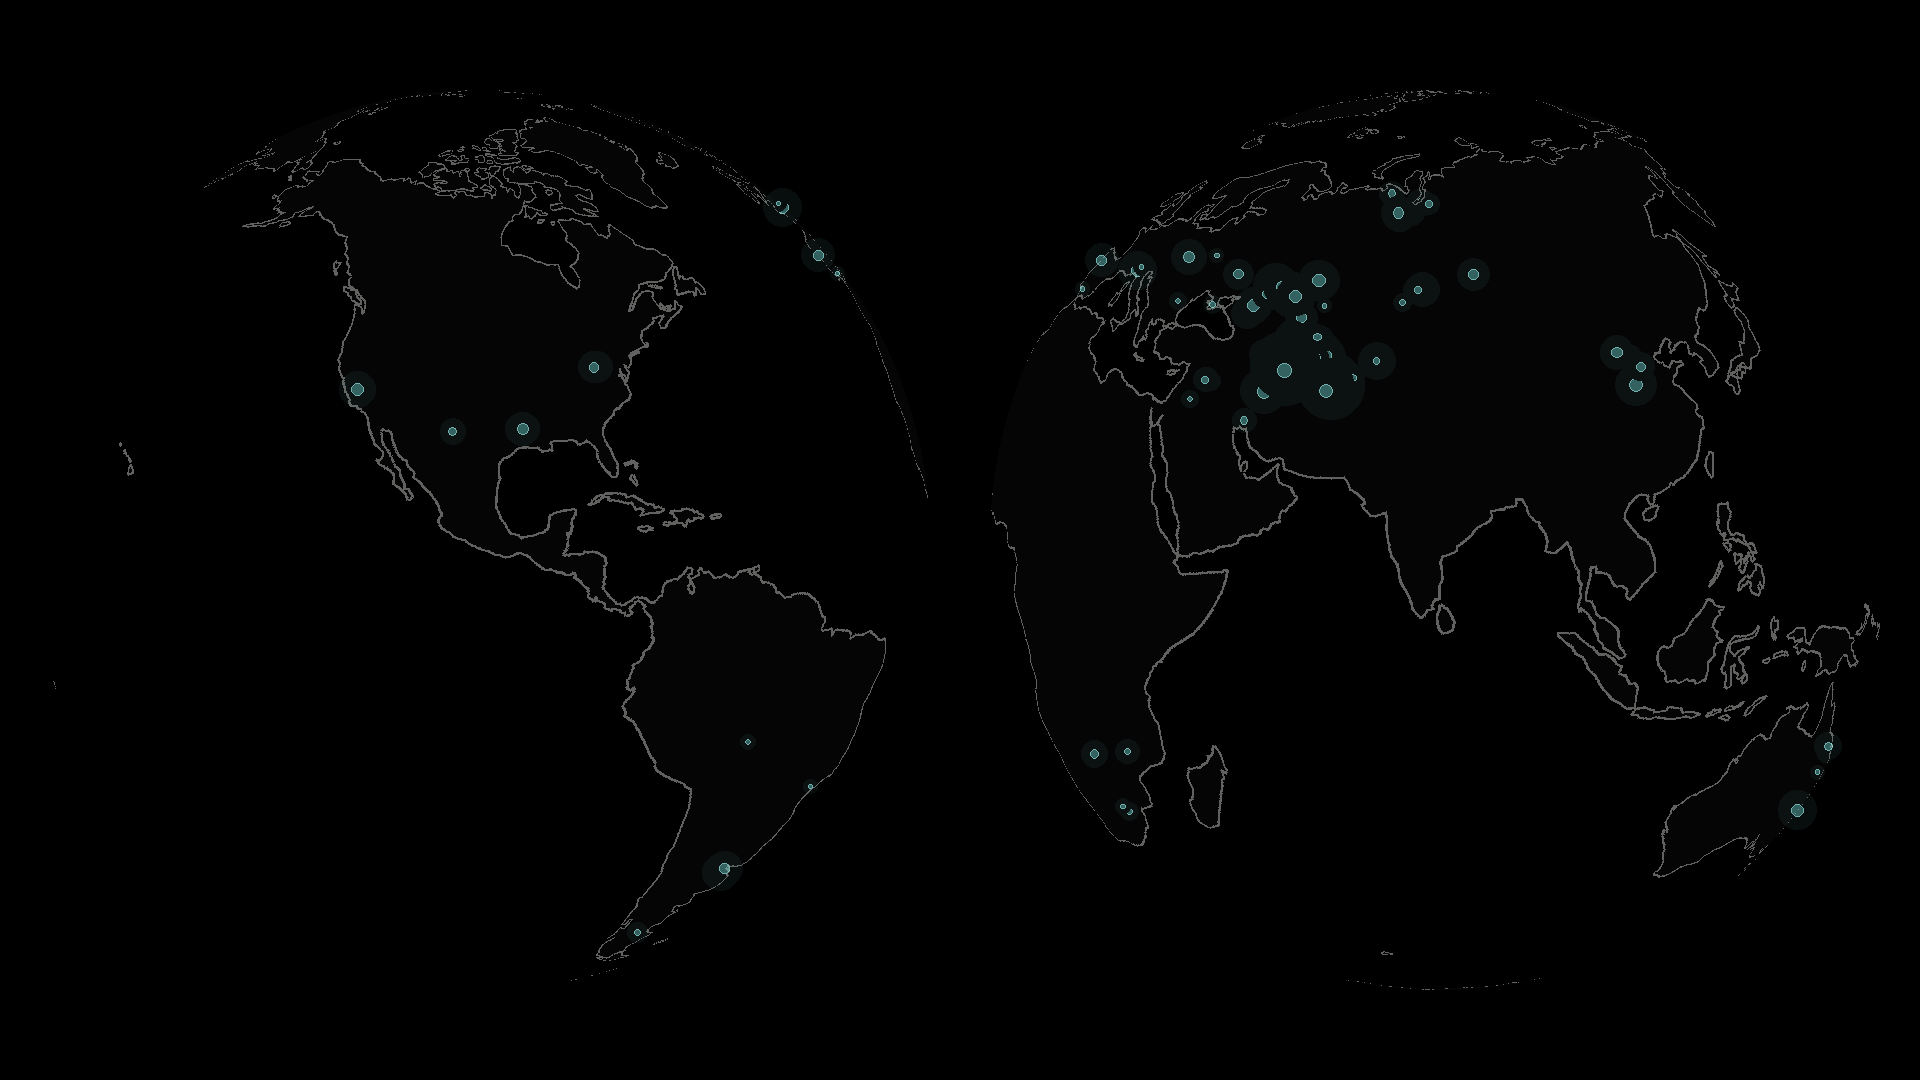
5,094 detections from 2024–2026 reveal the distance between observing a methane emission from orbit and reducing it on the ground.
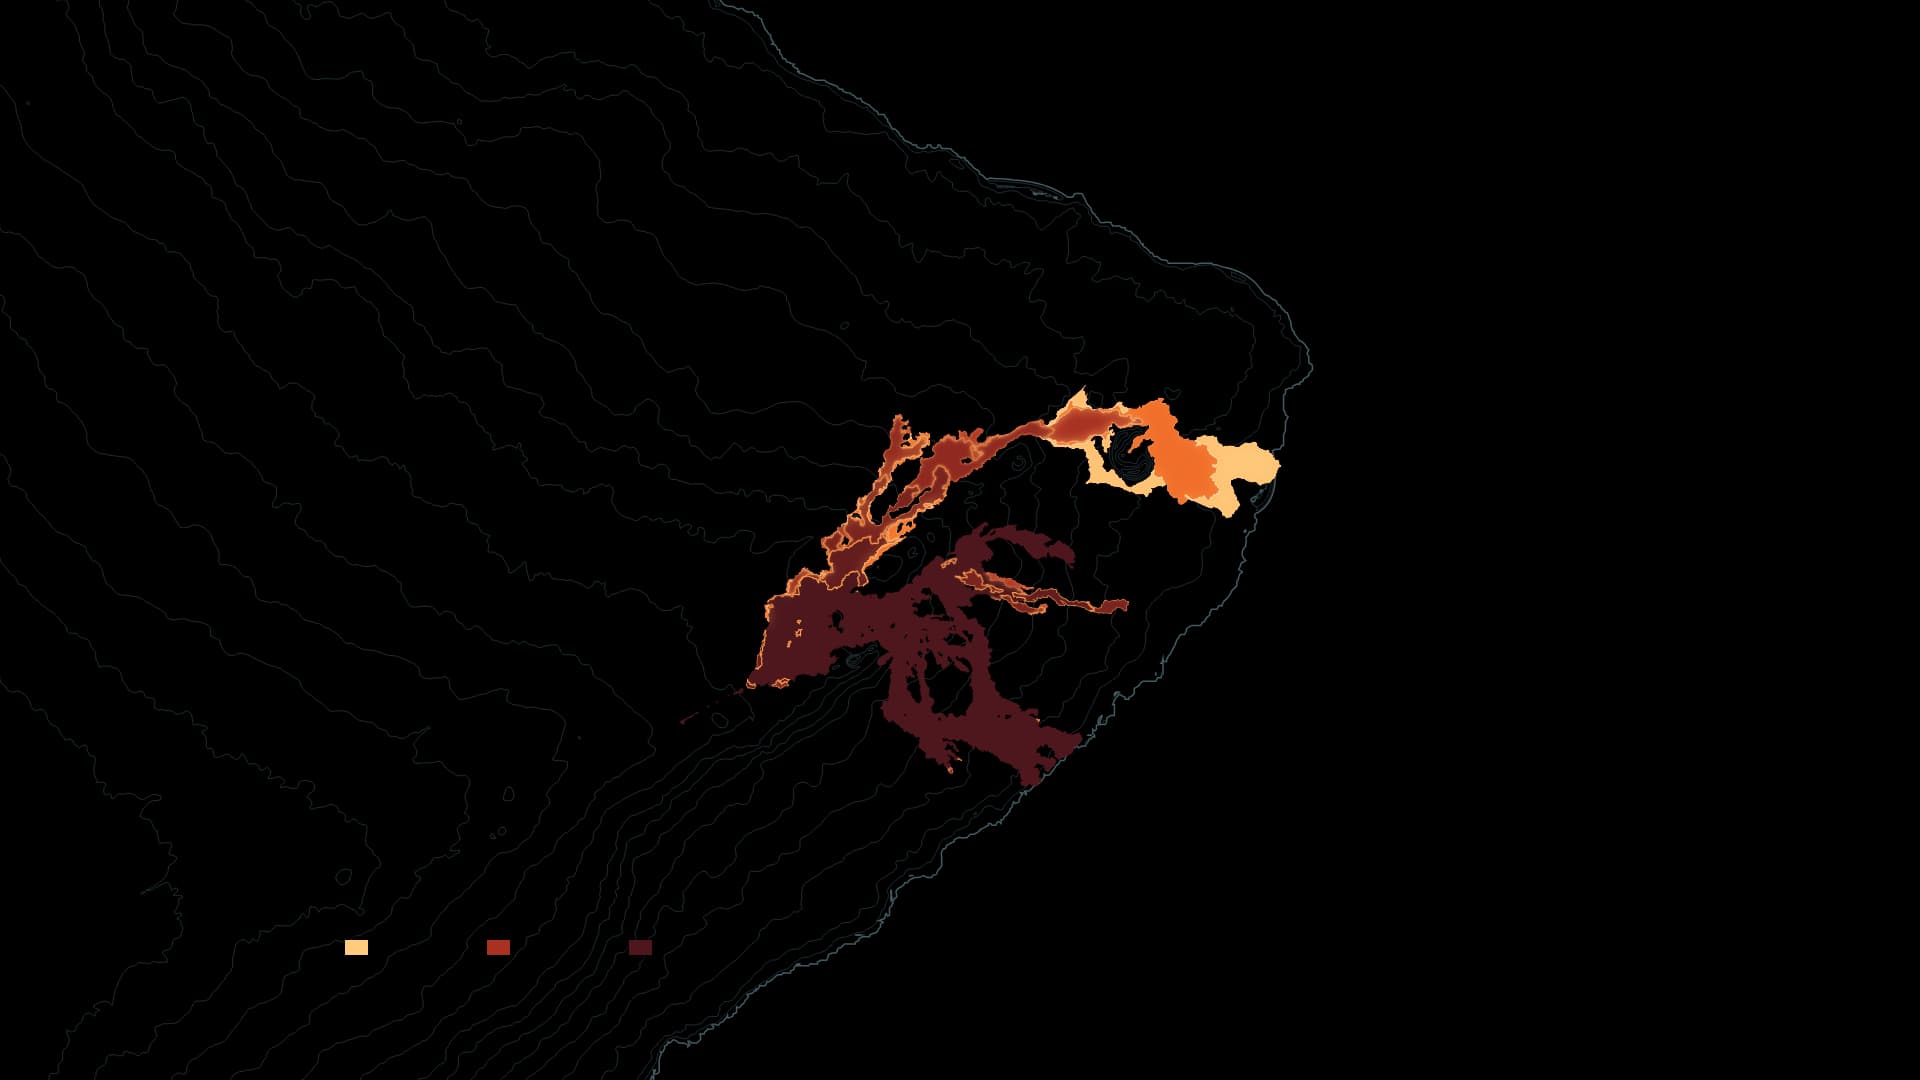
In 2018, lava reached the ocean and changed Hawaiʻi’s coastline. Since December 2024, renewed summit activity has been building ground inside the crater. Eruption records through September 2026, alongside an October 2 update, show an island still taking shape.
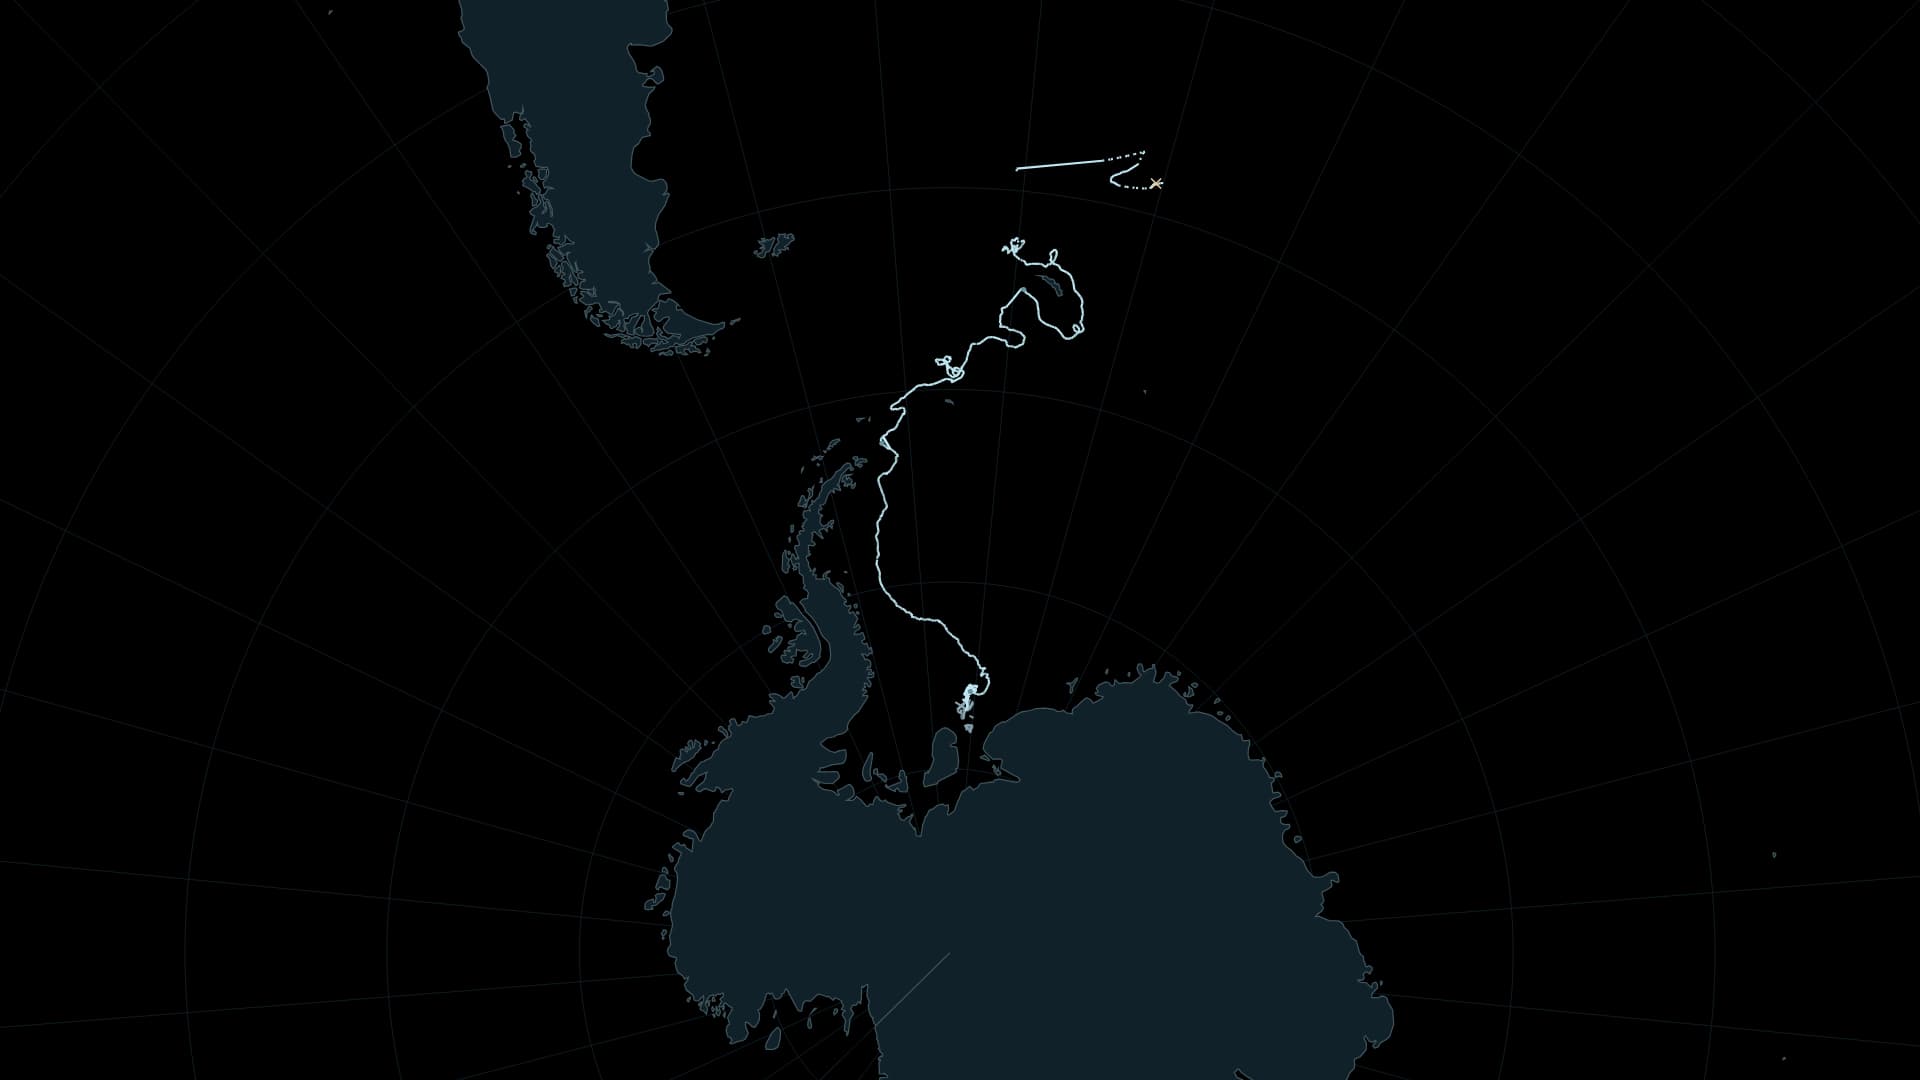
Calved from Antarctica in 1986, grounded for decades, then drifting into the South Atlantic: follow the forty-year life of the iceberg named A23a, ending in fragmentation in April 2026.
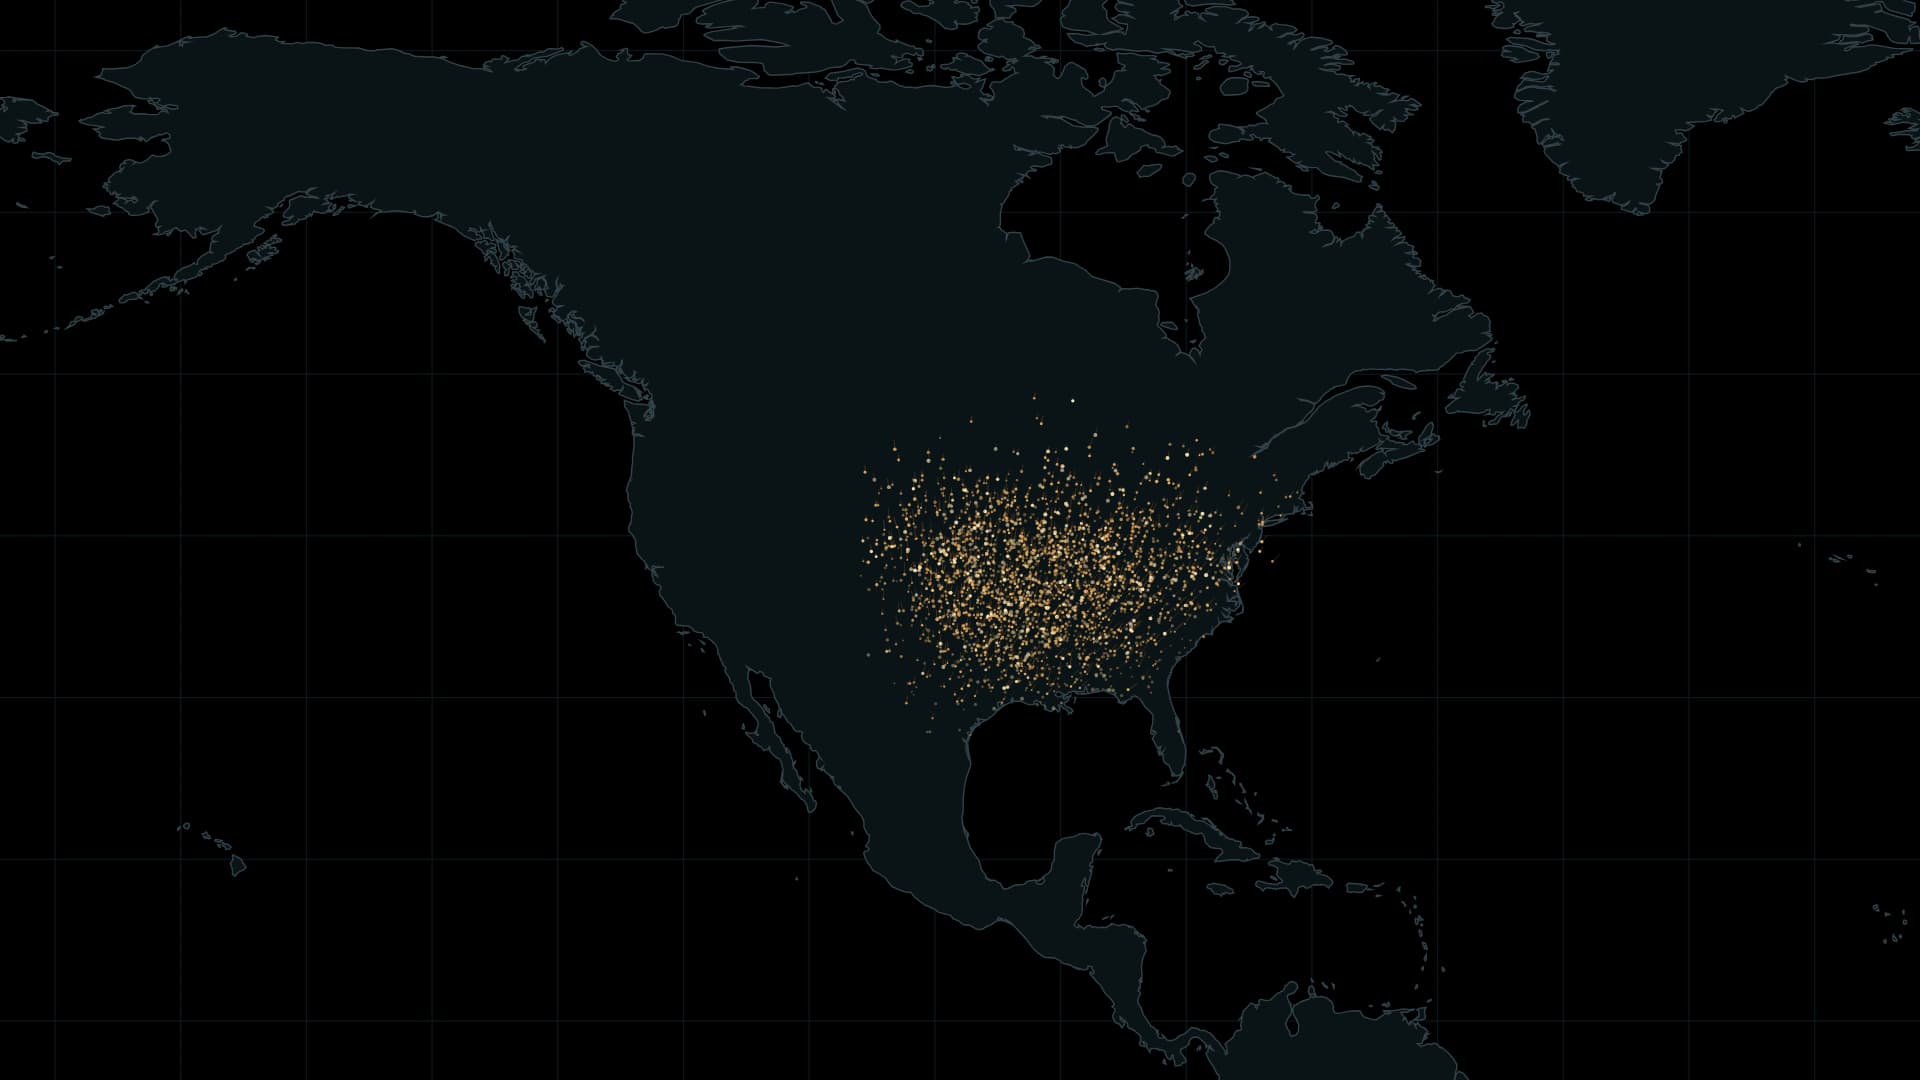
Eastern monarchs connect a vast summer range with mountain forests in central Mexico. A seasonal map brings the scale of that journey into view.
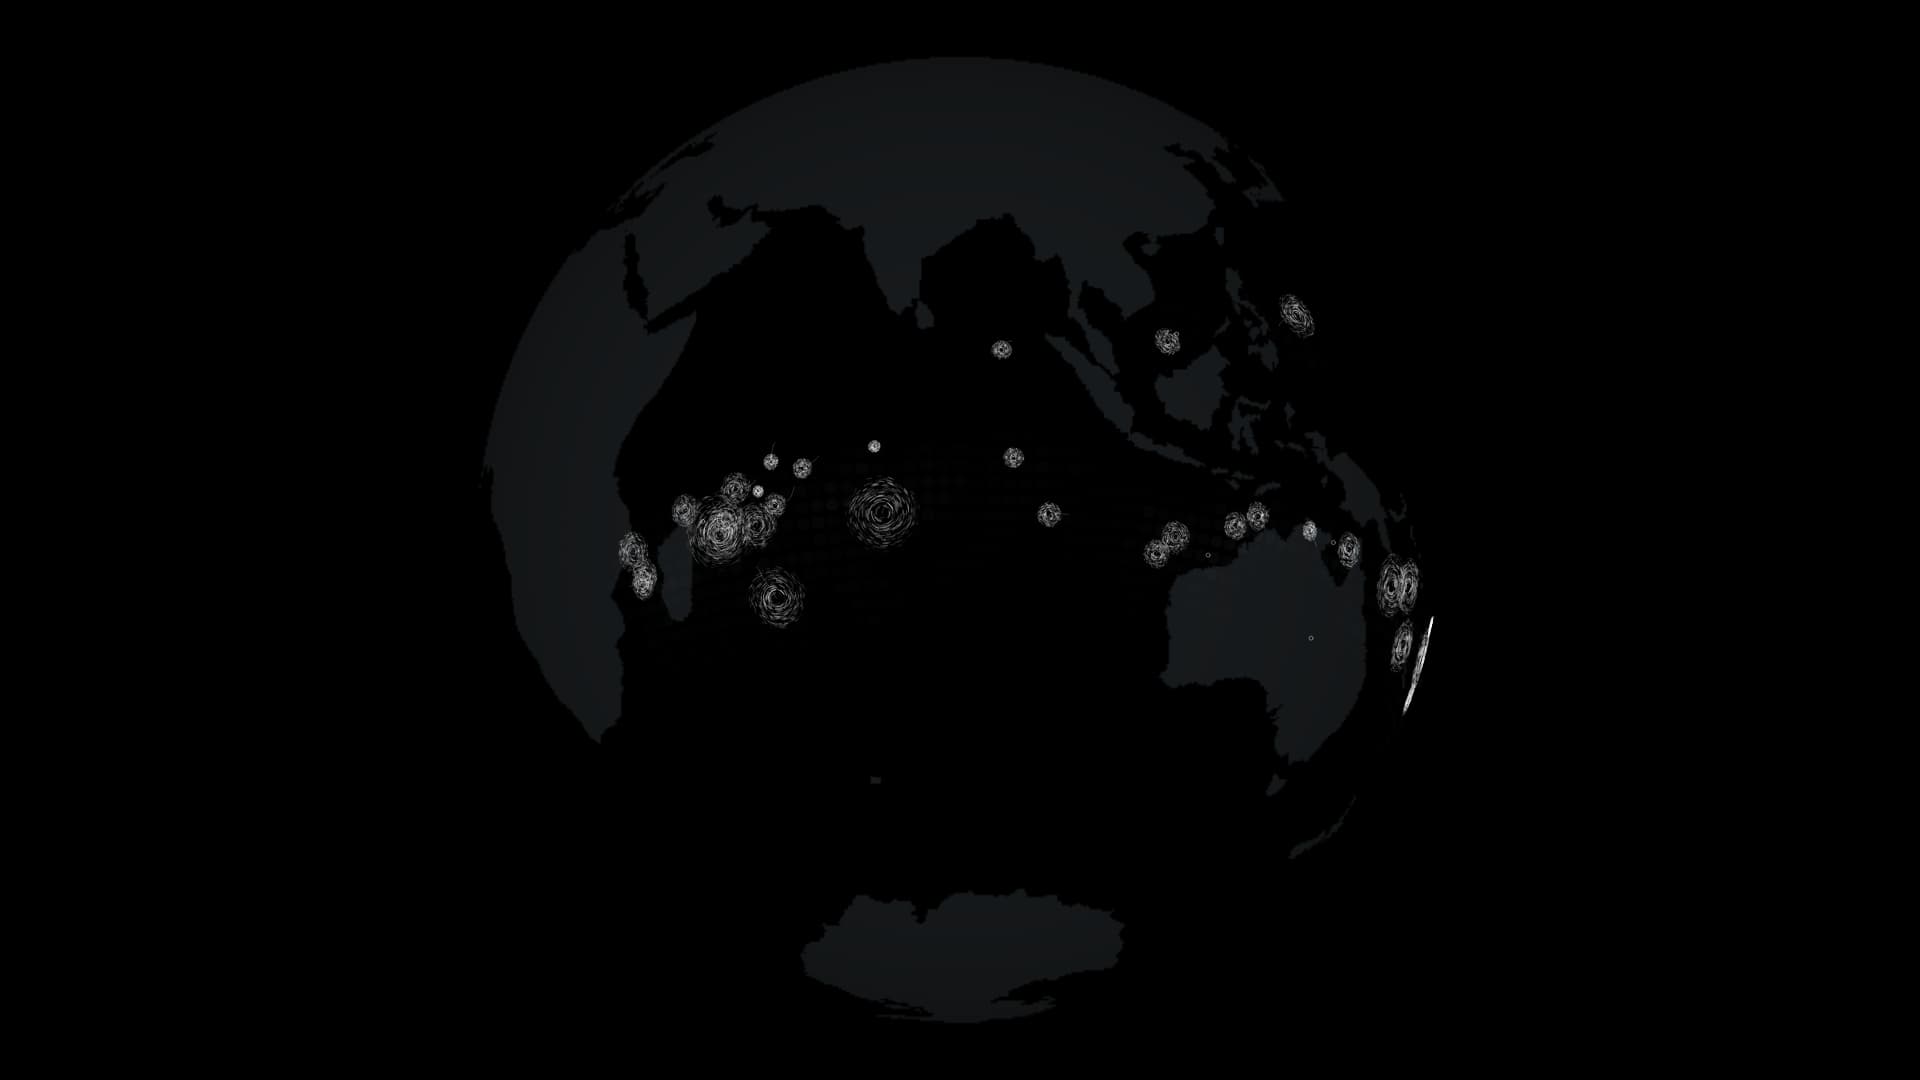
How does ocean heat feed a vast rotating storm? Thirty years of records connect storm formation, seasonal geography and the names typhoon, hurricane and cyclone.
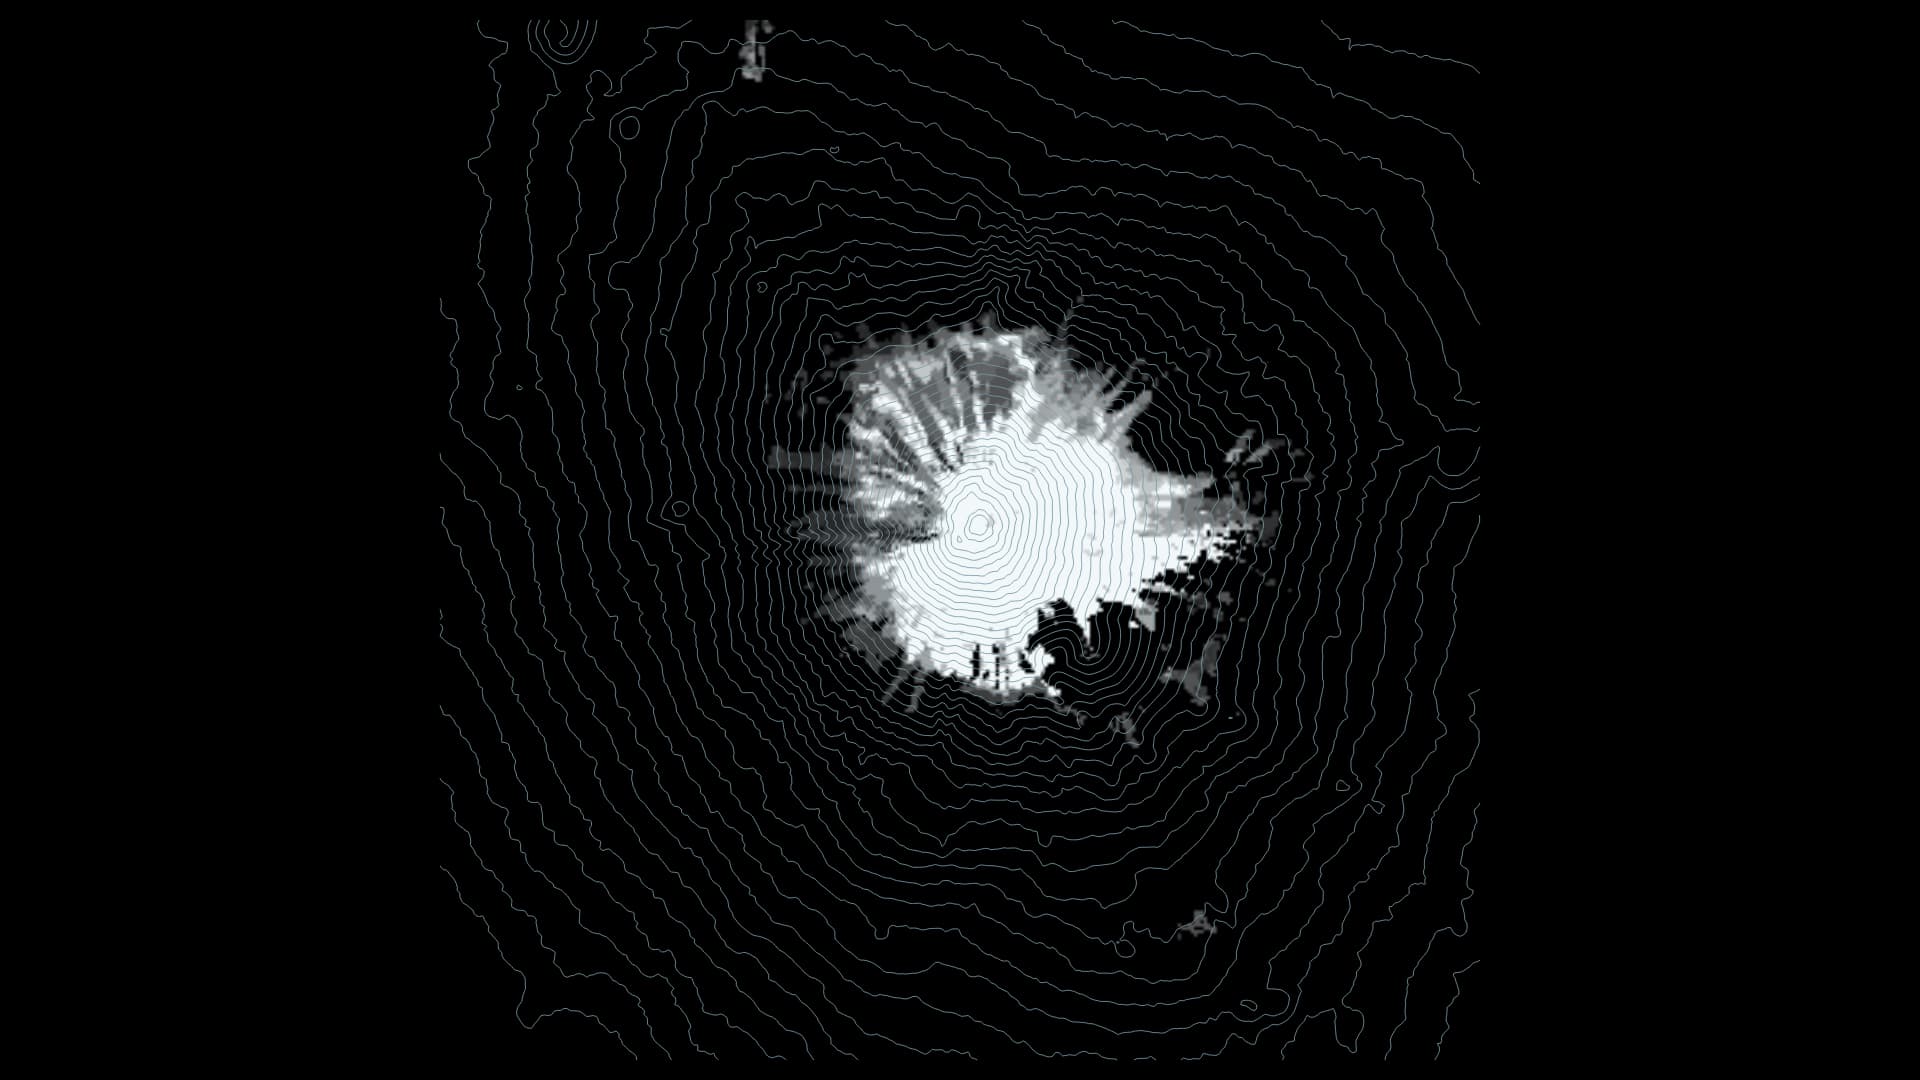
Mount Fuji is a symbol of Japan and one of the world’s most iconic mountains. Monthly snow observations, visibility records and 132 first-snowcap dates help us look closer.
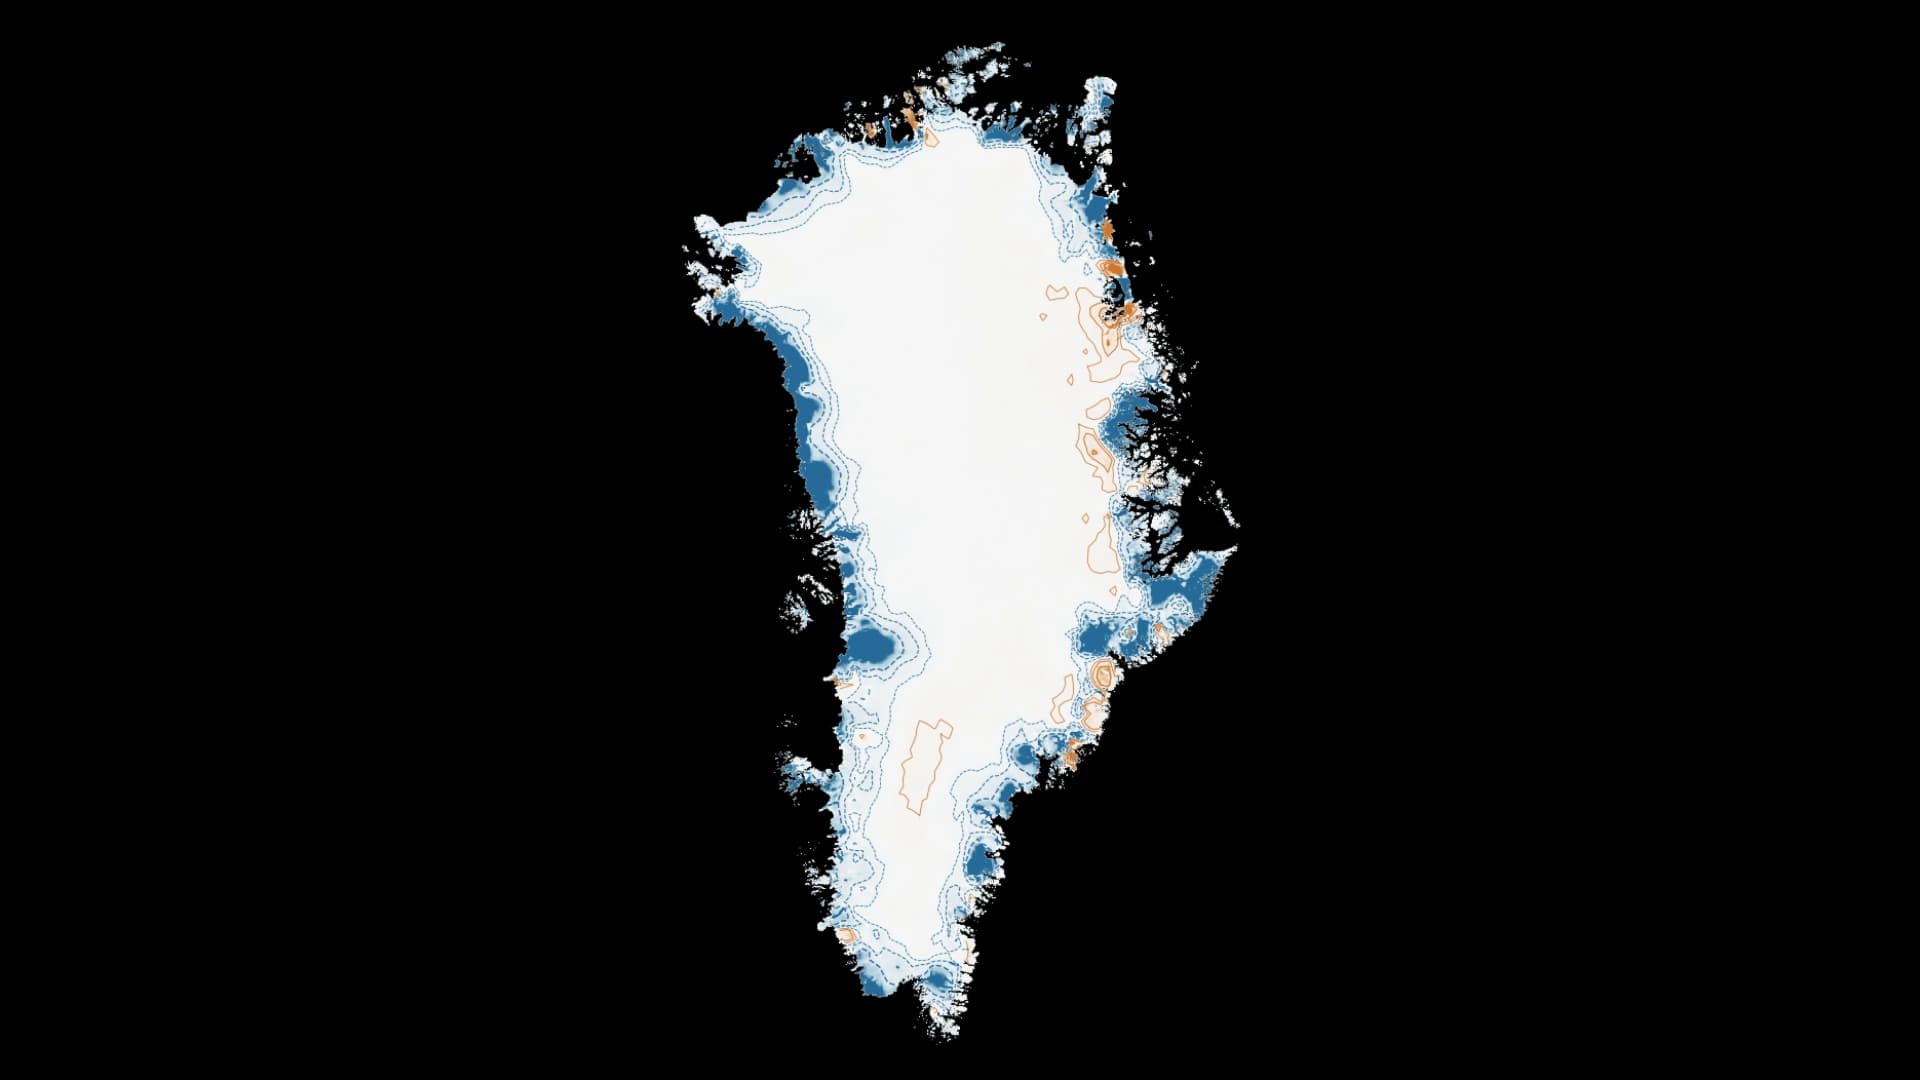
On September 22, 2026, the United States, Greenland and Denmark signed an Arctic and North Atlantic security agreement. Thirty-two annual maps show how the ice surface changed against a 1992 baseline.
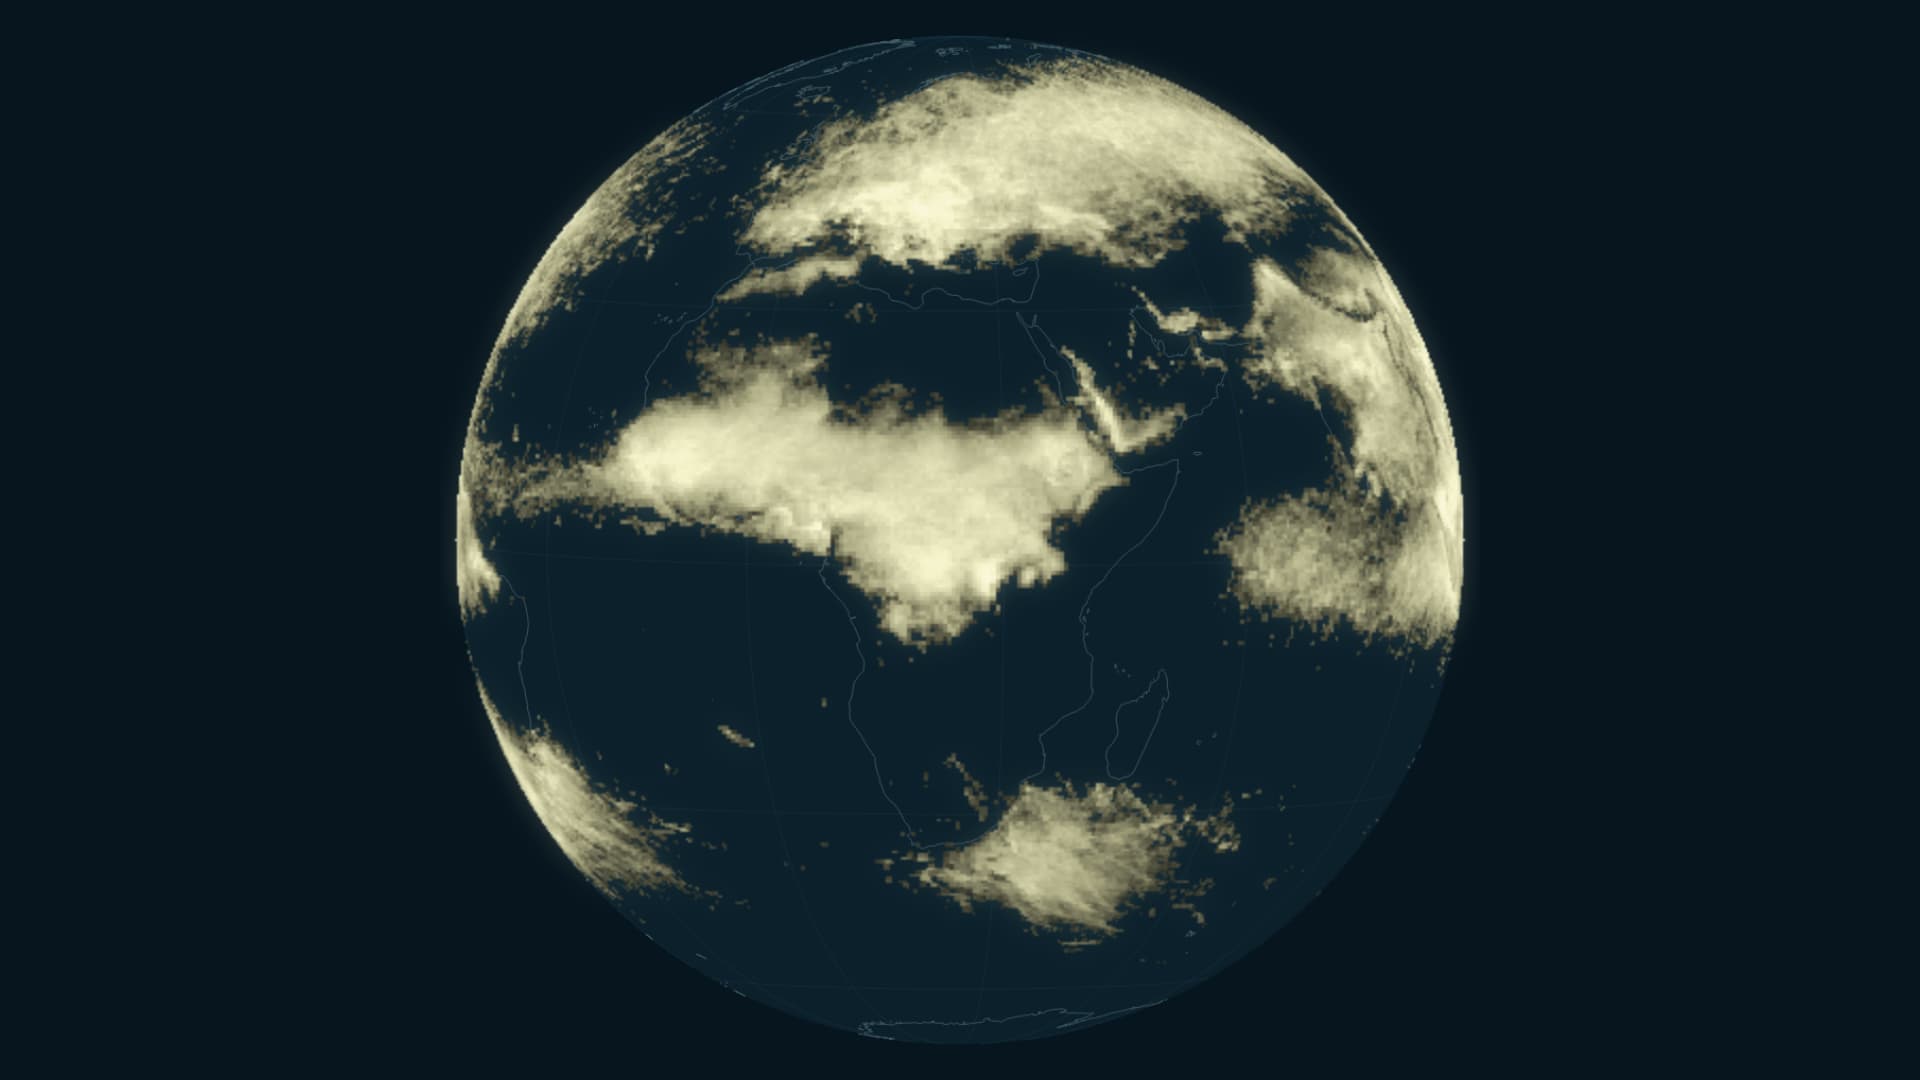
Ten years of observations turn brief flashes into a map of how activity changes through the calendar.
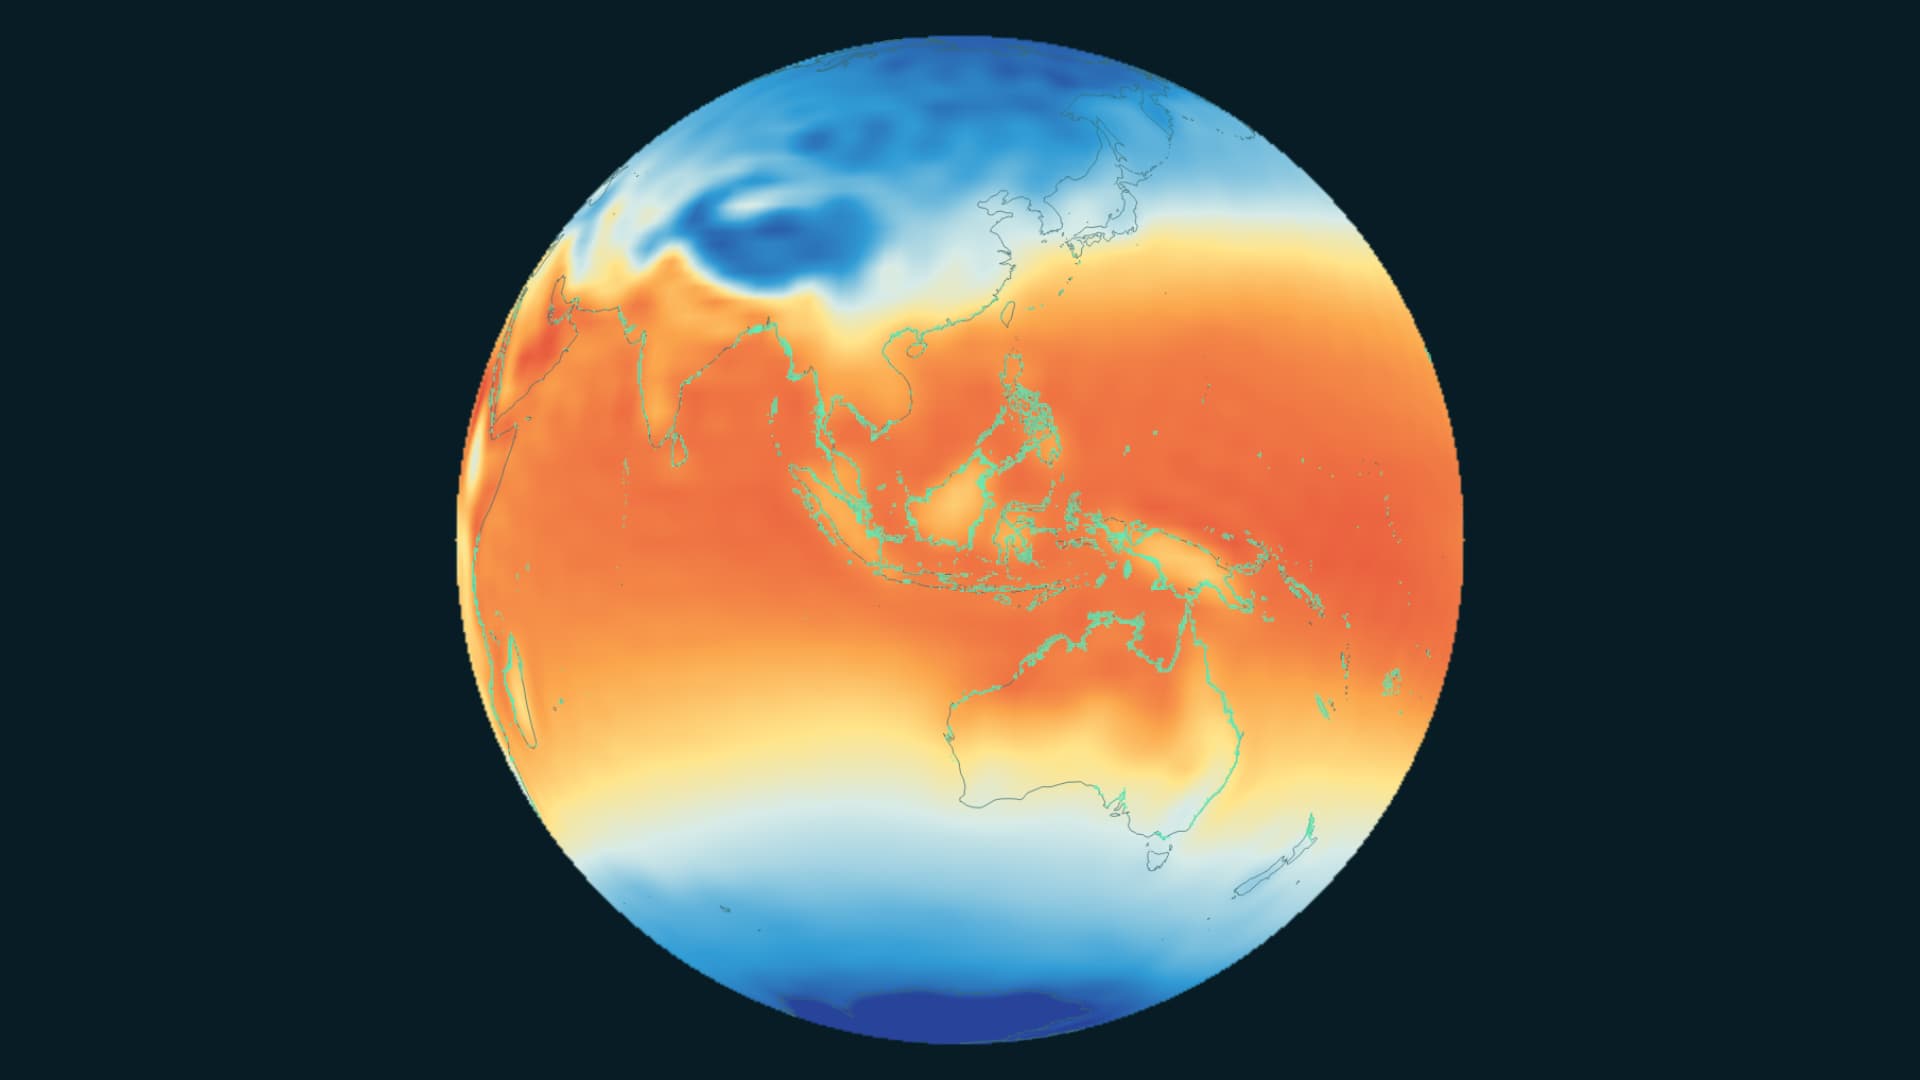
A global view of mangroves and air temperature, sharing a timeline from 1985 to 2025.
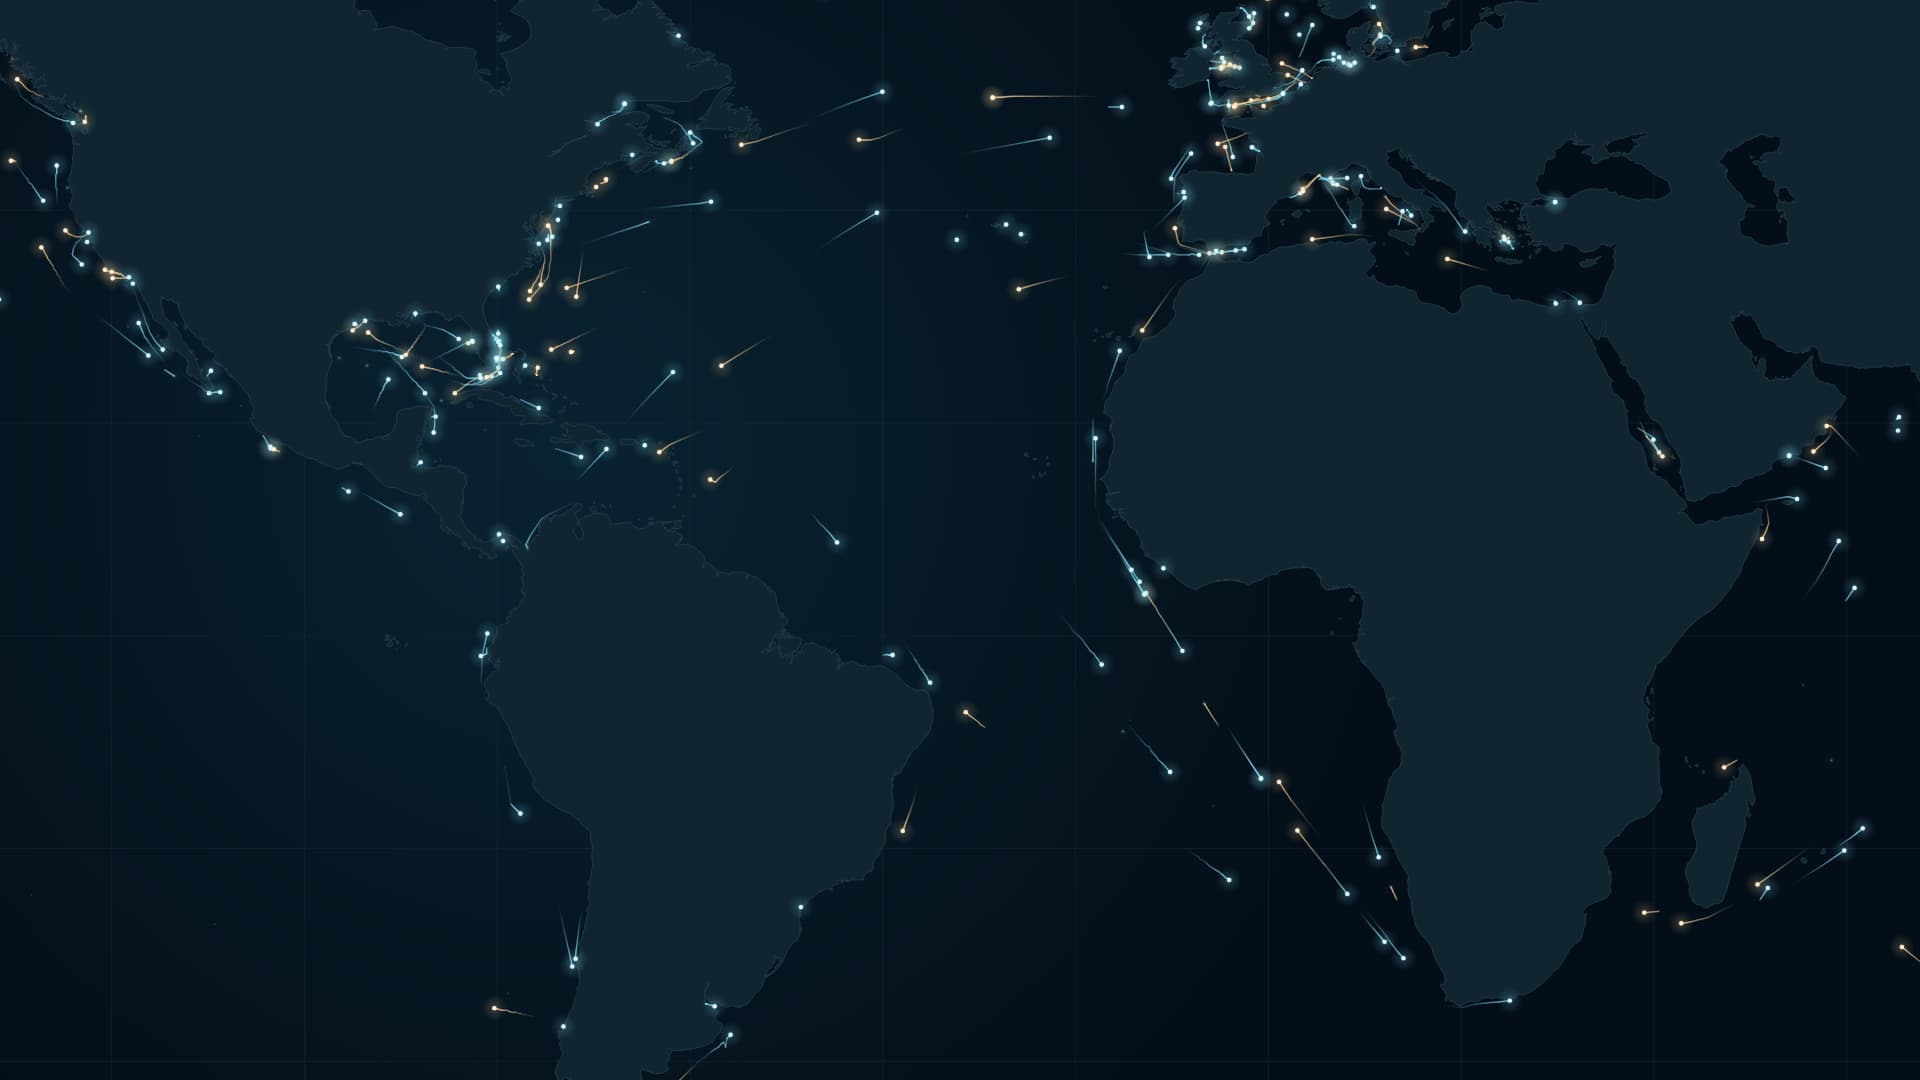
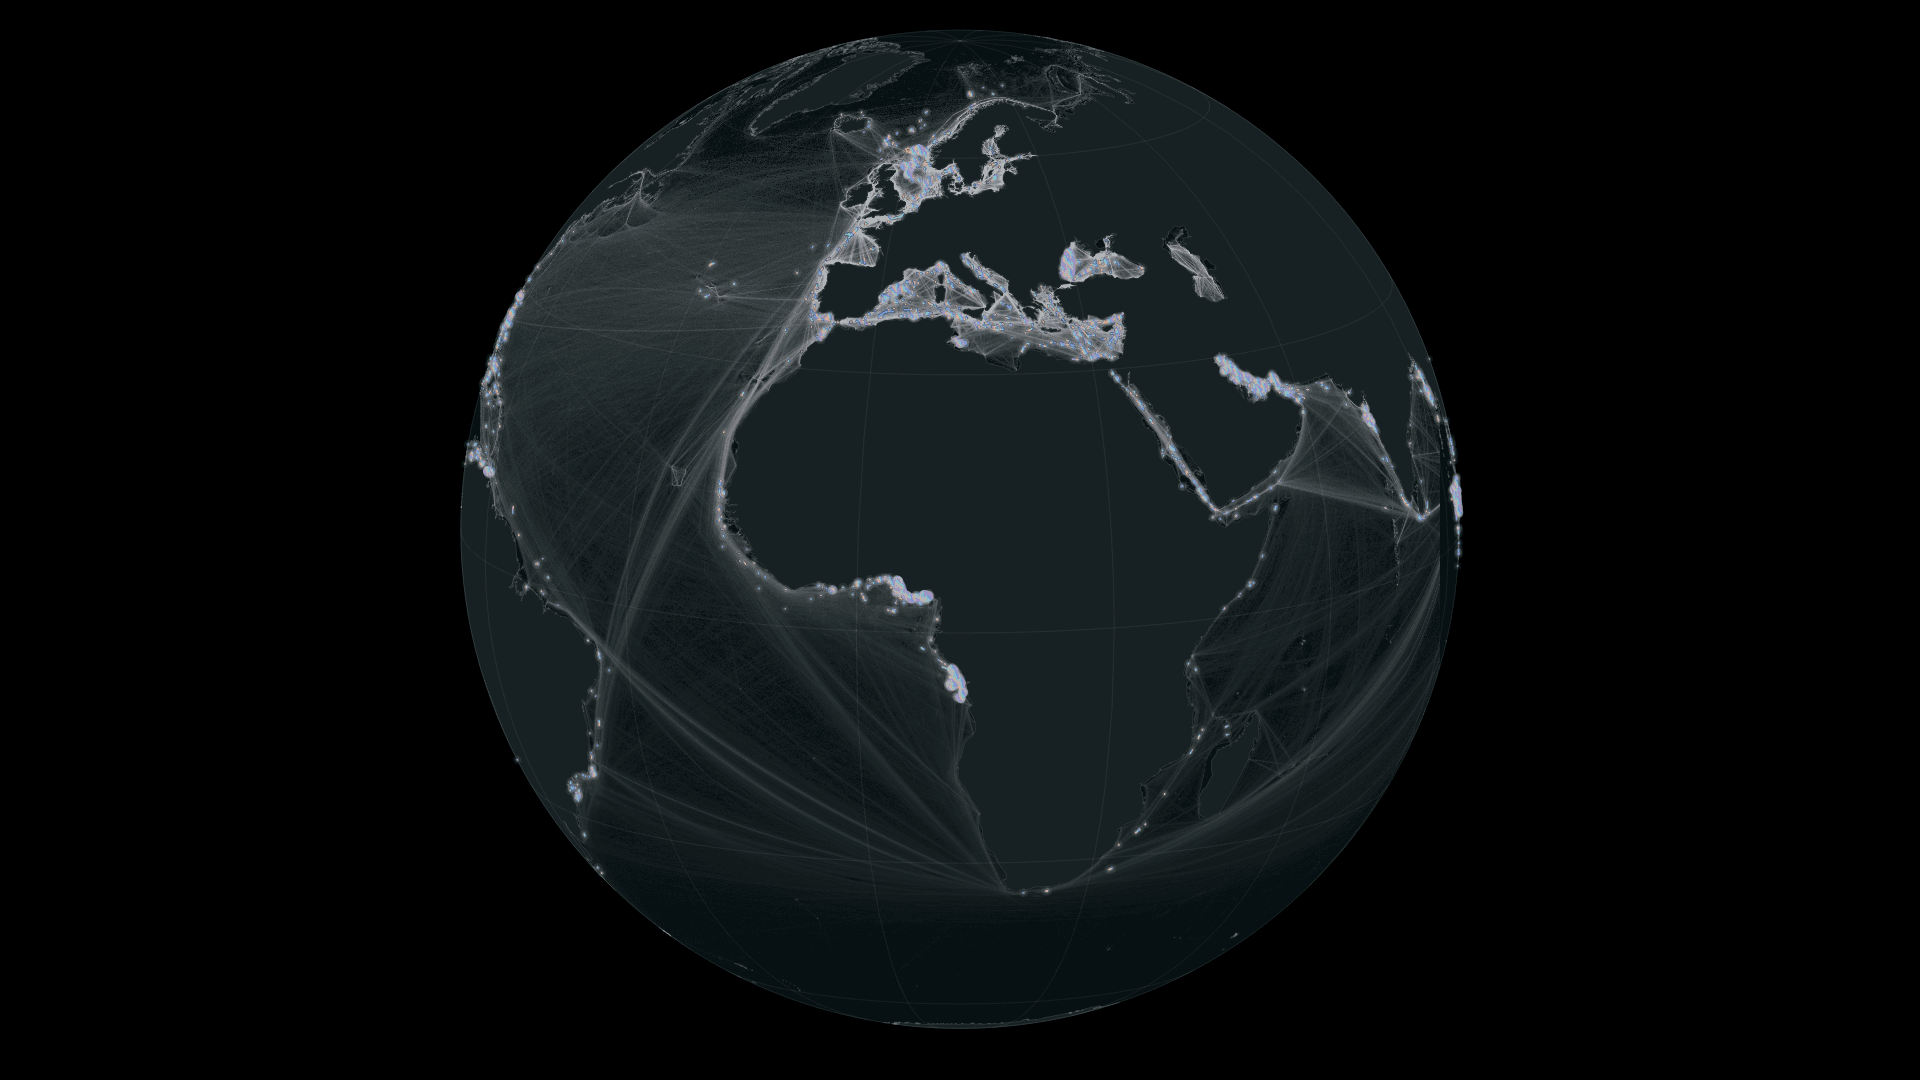
Beyond every port are people’s lives. Atlantic ship movements offer a way into trade, cultural exchange and knowledge of the sea.
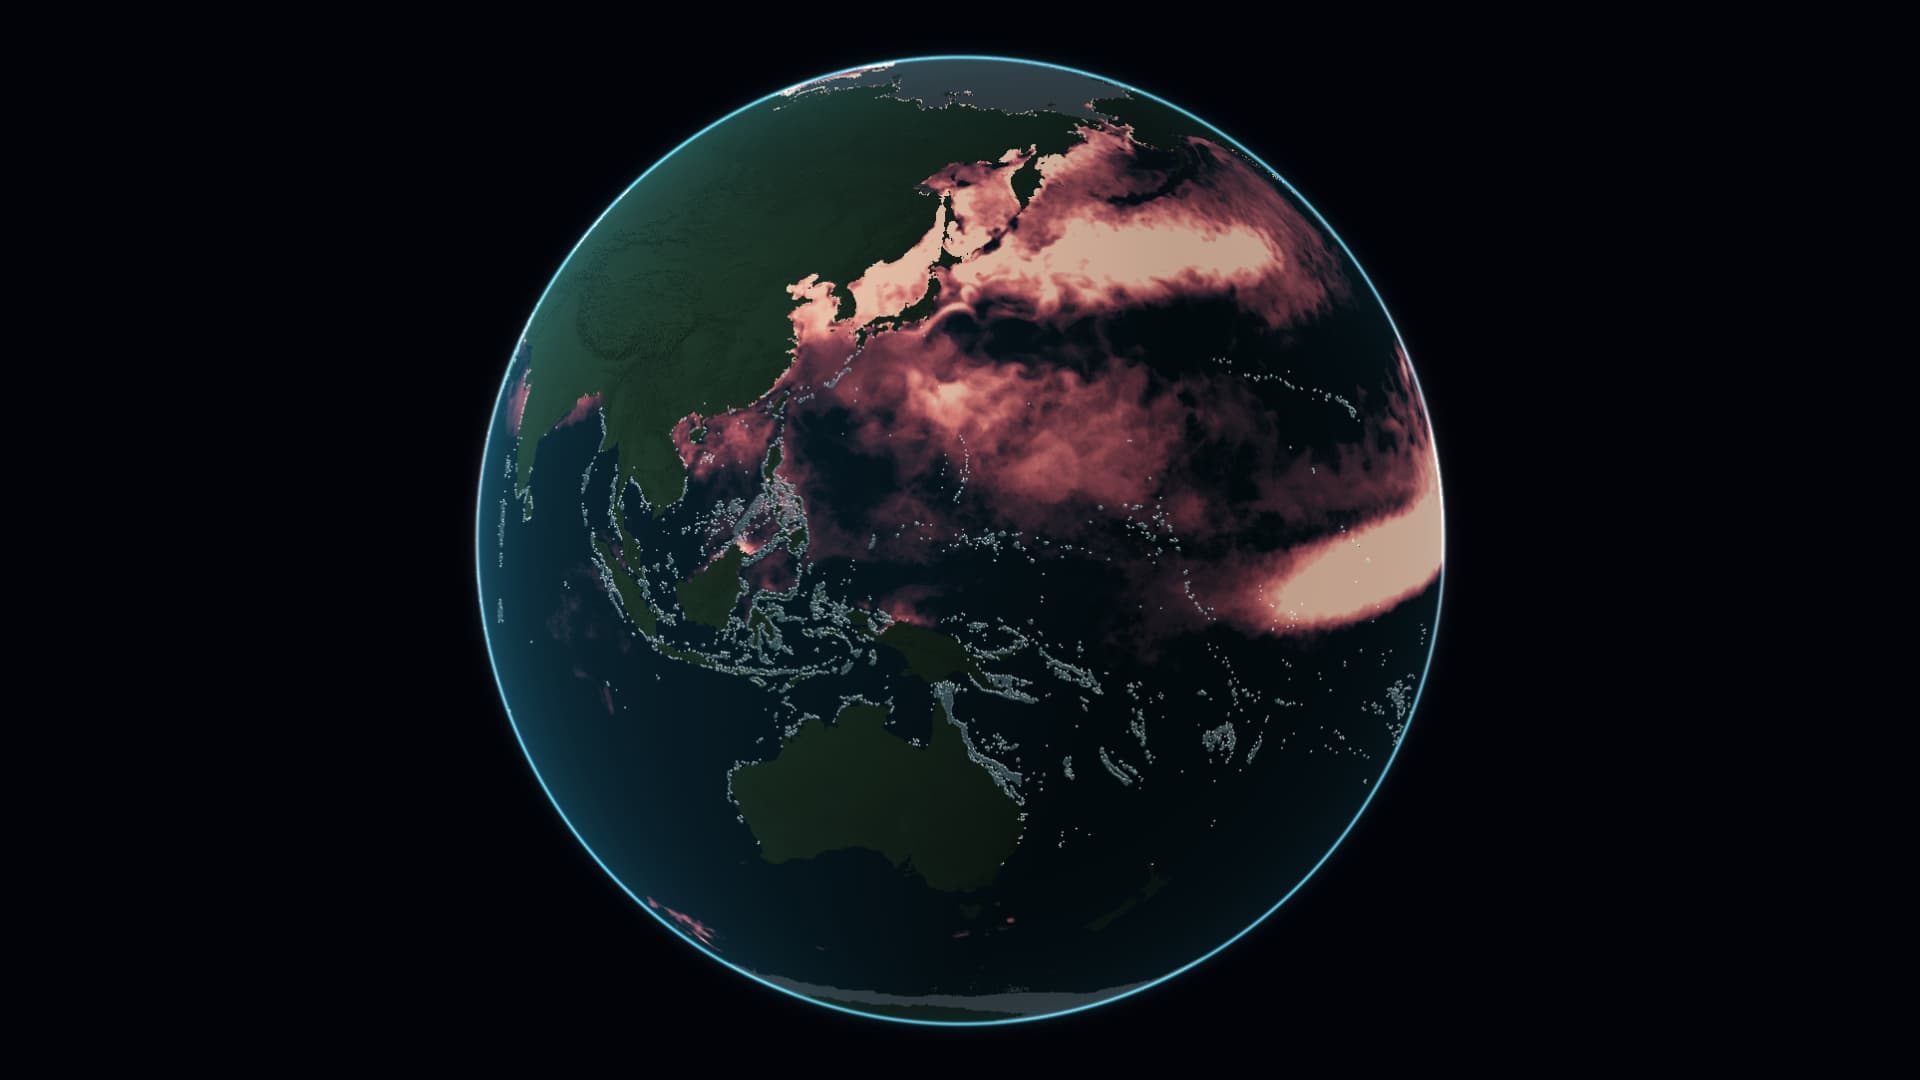
Keep reef locations visible, then overlay accumulated thermal stress during June–August 2026. A view of ocean heat that includes time.
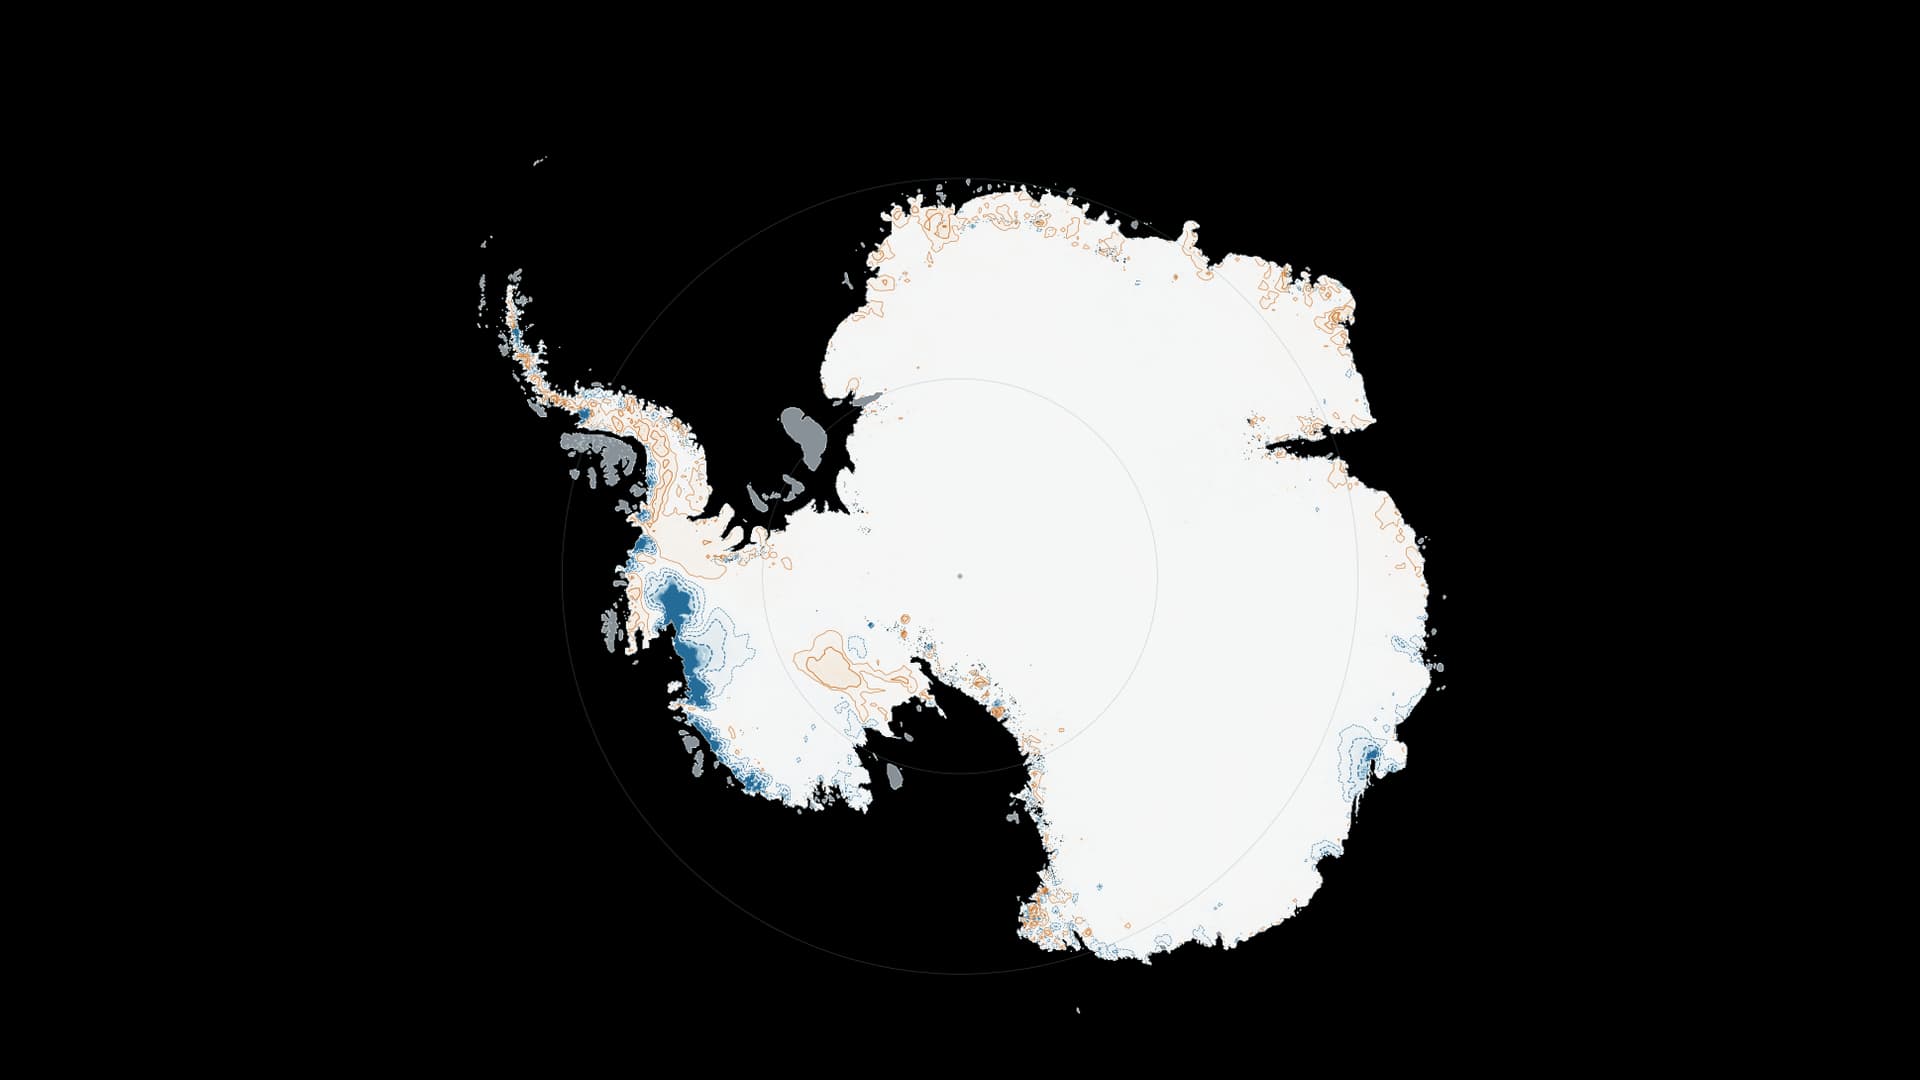
Hold the continent still, and watch its surface change. A common 1995 baseline reveals where the ice sheet has become lower or higher.
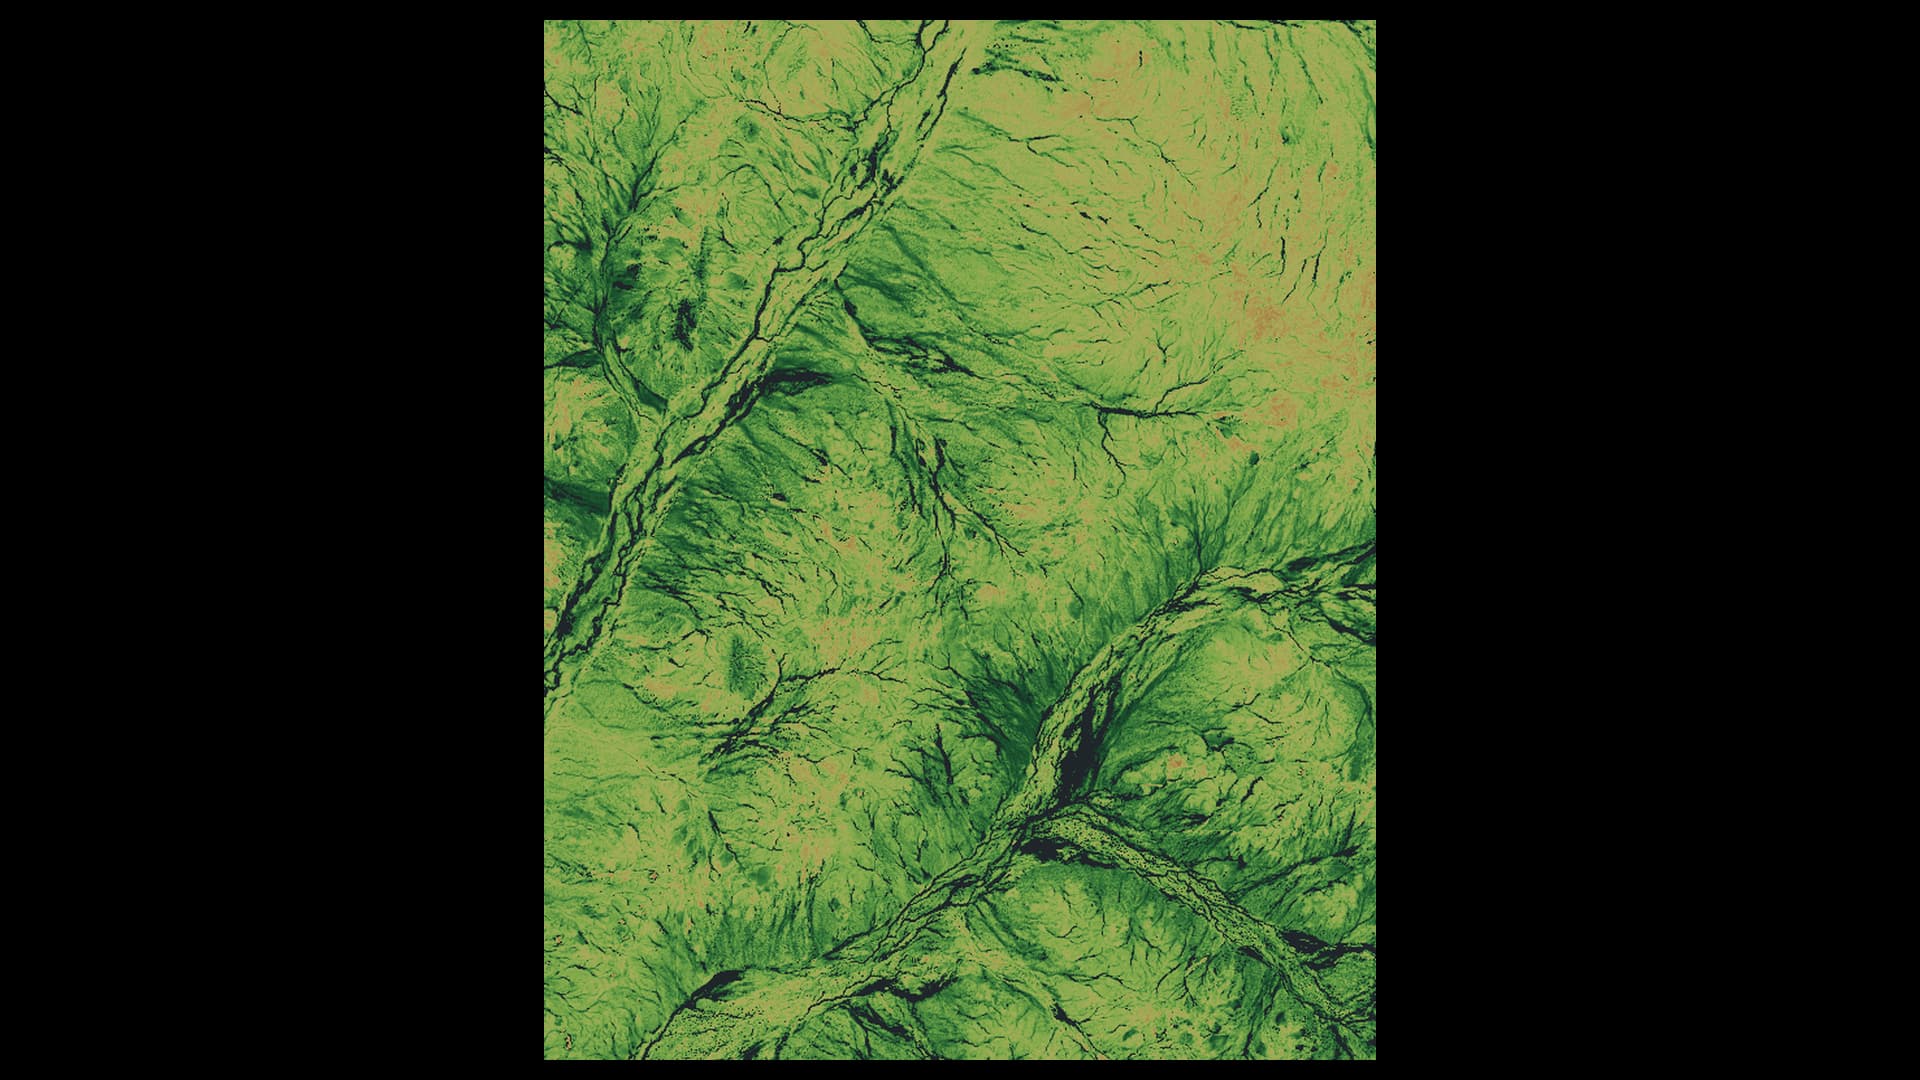
In the Murchison, seeds wait below dry ground for a flowering season. The landscape’s response in 2026 connects a distinctive place with the water conditions that a warming climate can change.
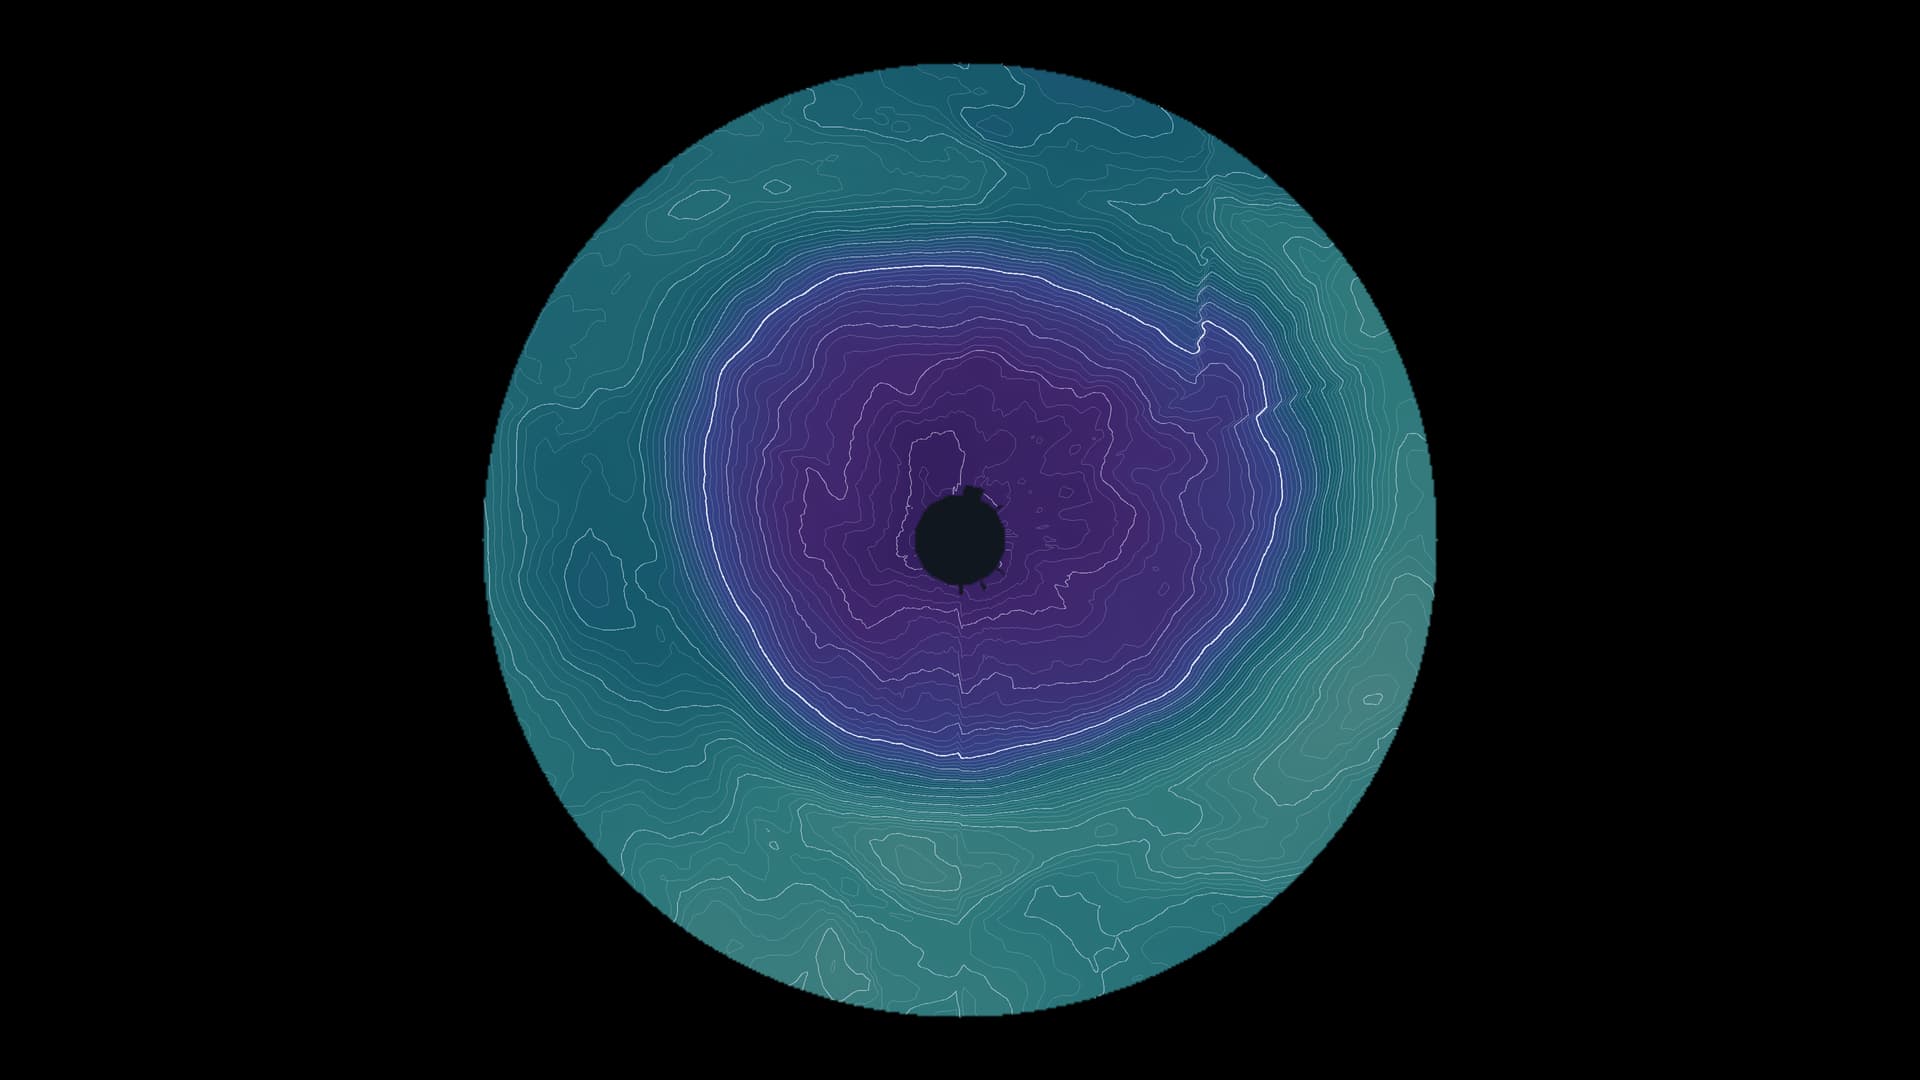
From its discovery in 1985 to international controls and today’s observations: two timescales reveal why recovery does not mean the hole has already disappeared.
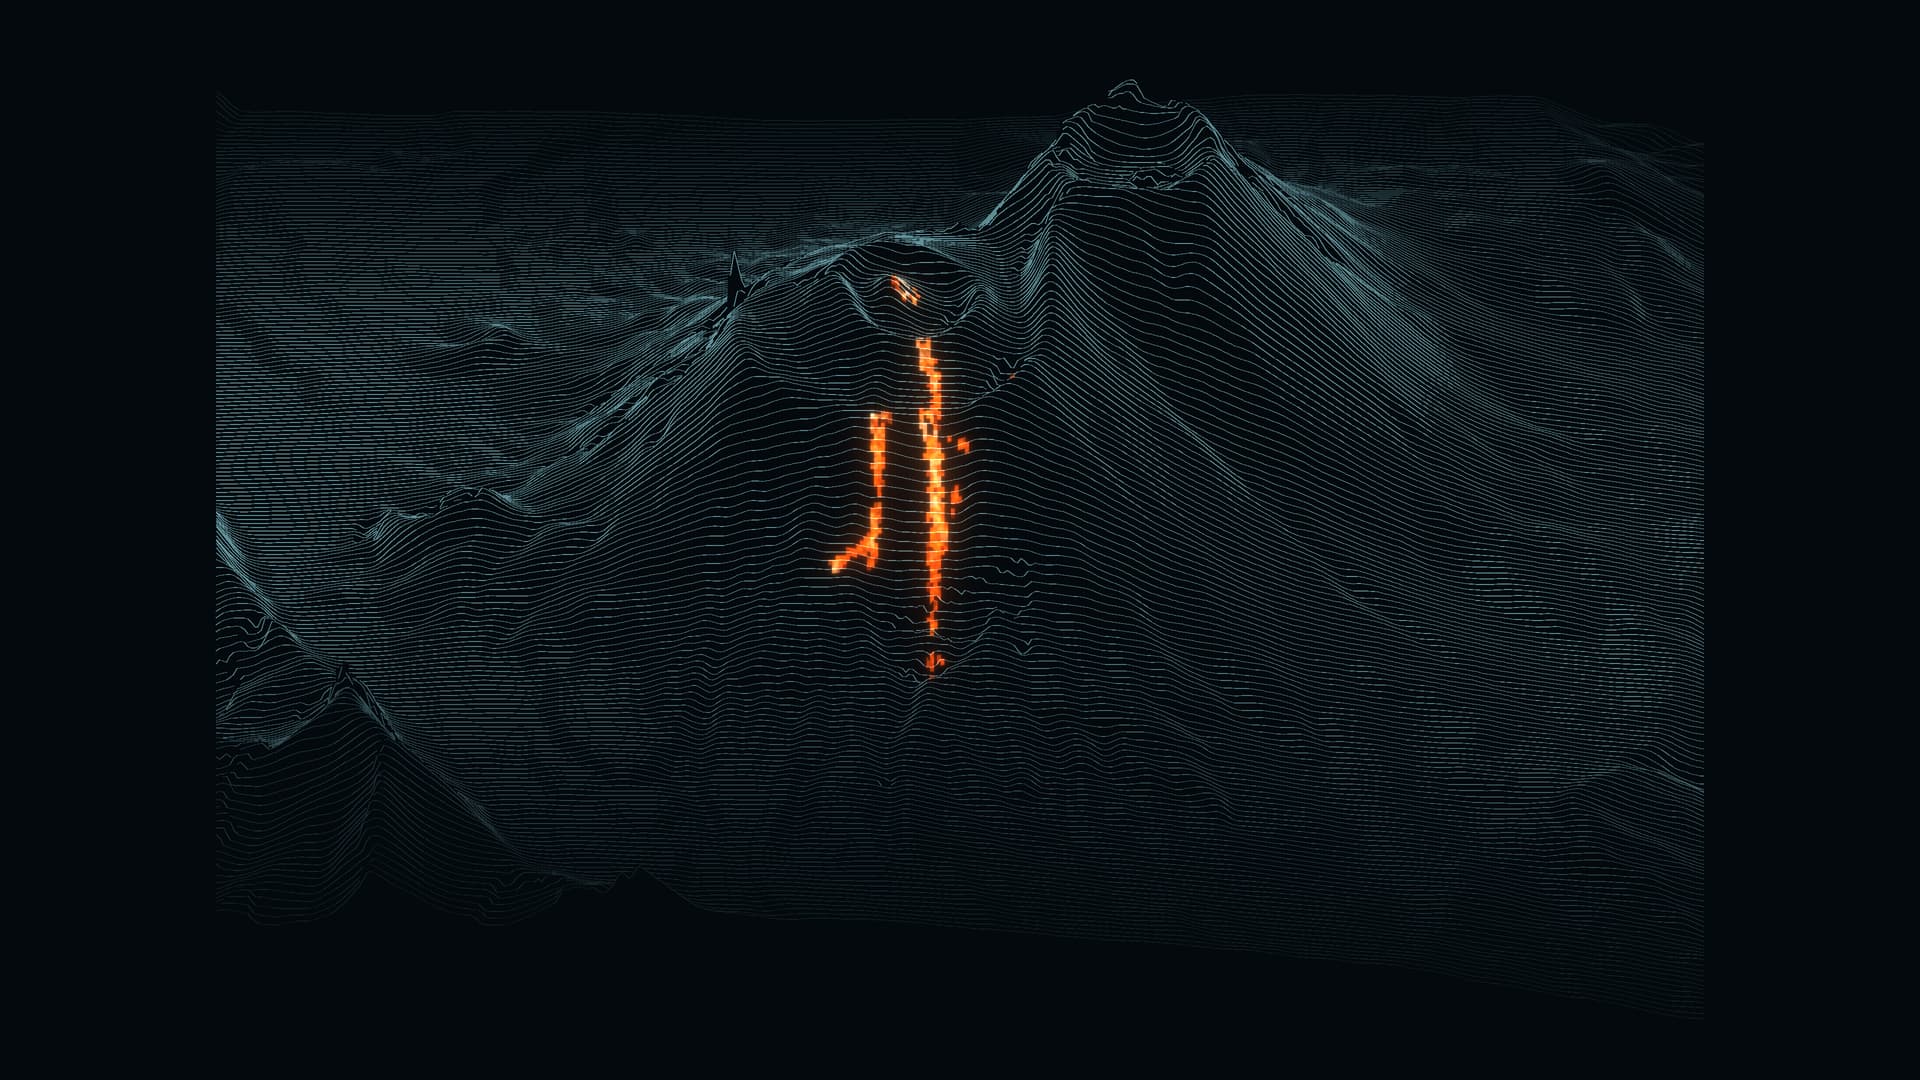
A giant earthquake struck offshore Kamchatka on 30 July 2025. Days later, Krasheninnikov erupted. Ground deformation detected between the two events offers a clue to their possible connection.
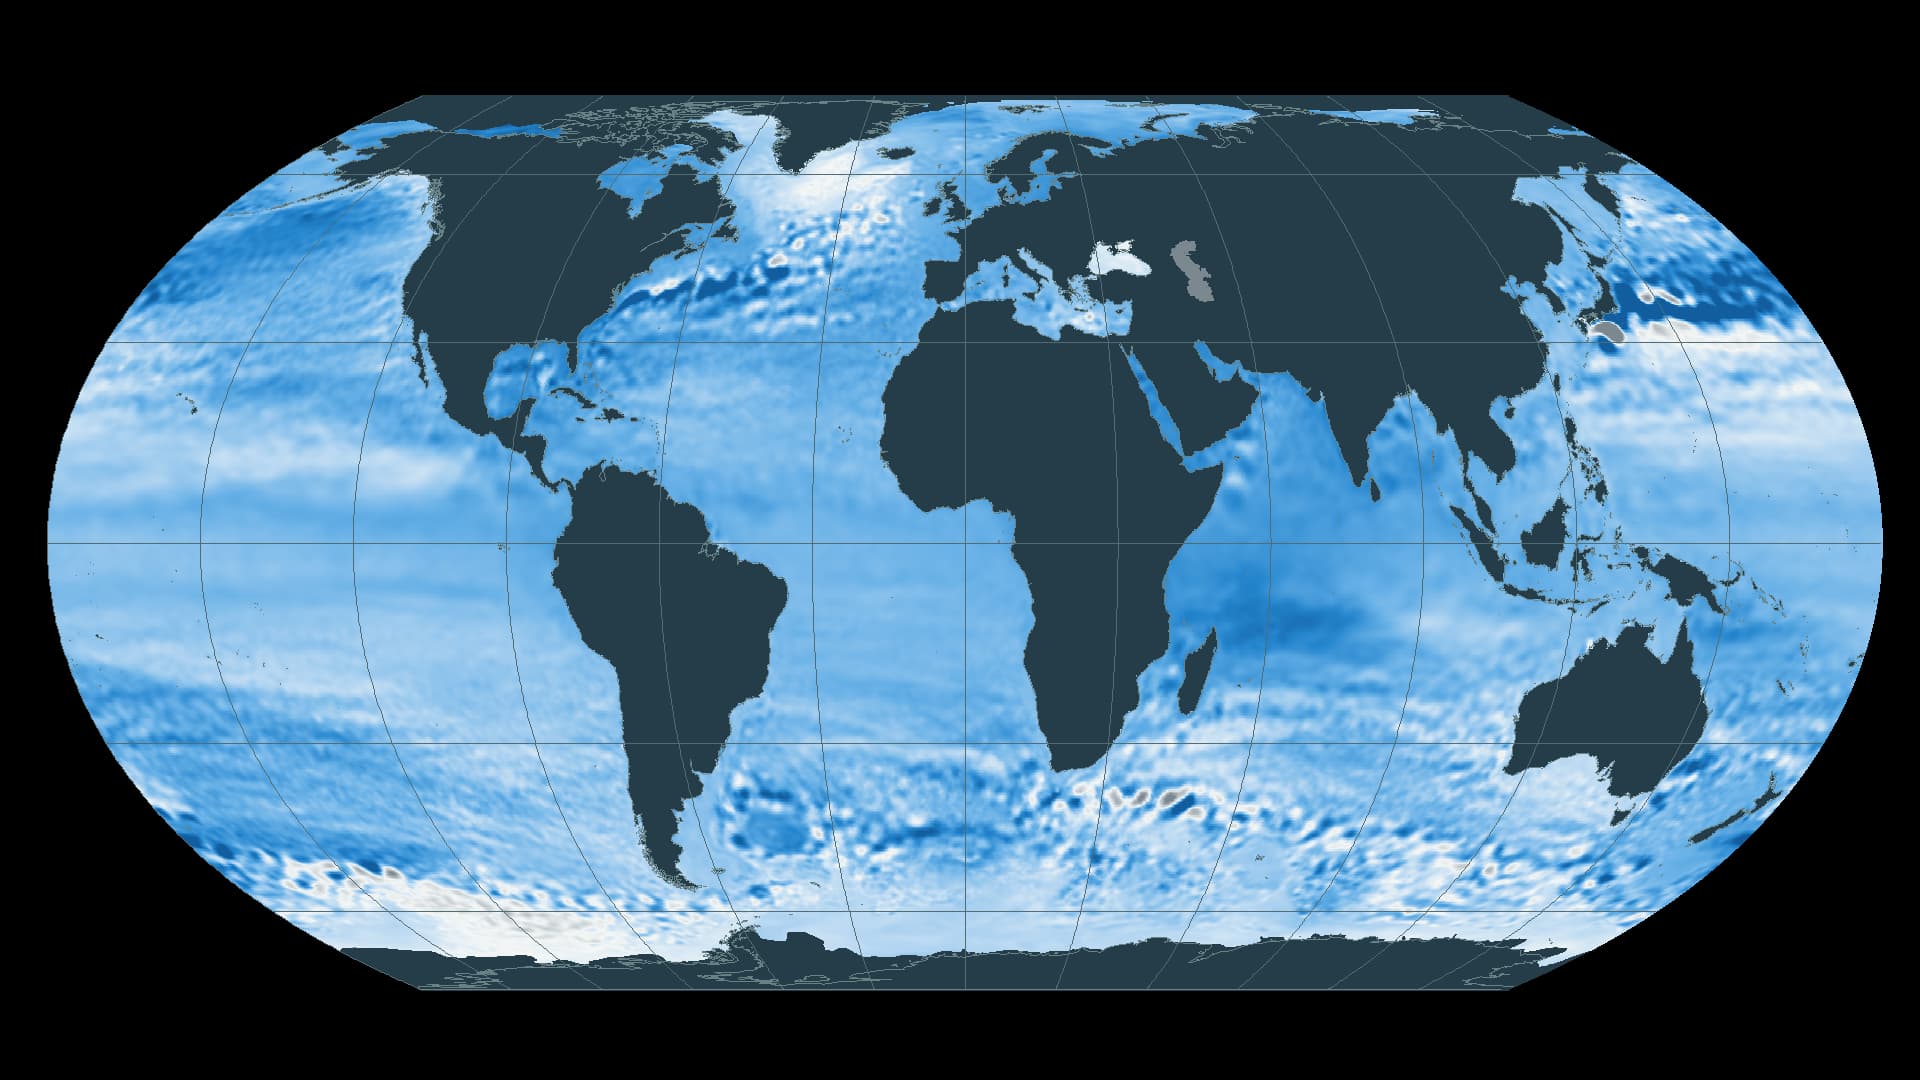
From the global ocean to groundwater, flood barriers and roads, three cities show how sea-level rise changes the conditions of everyday life.
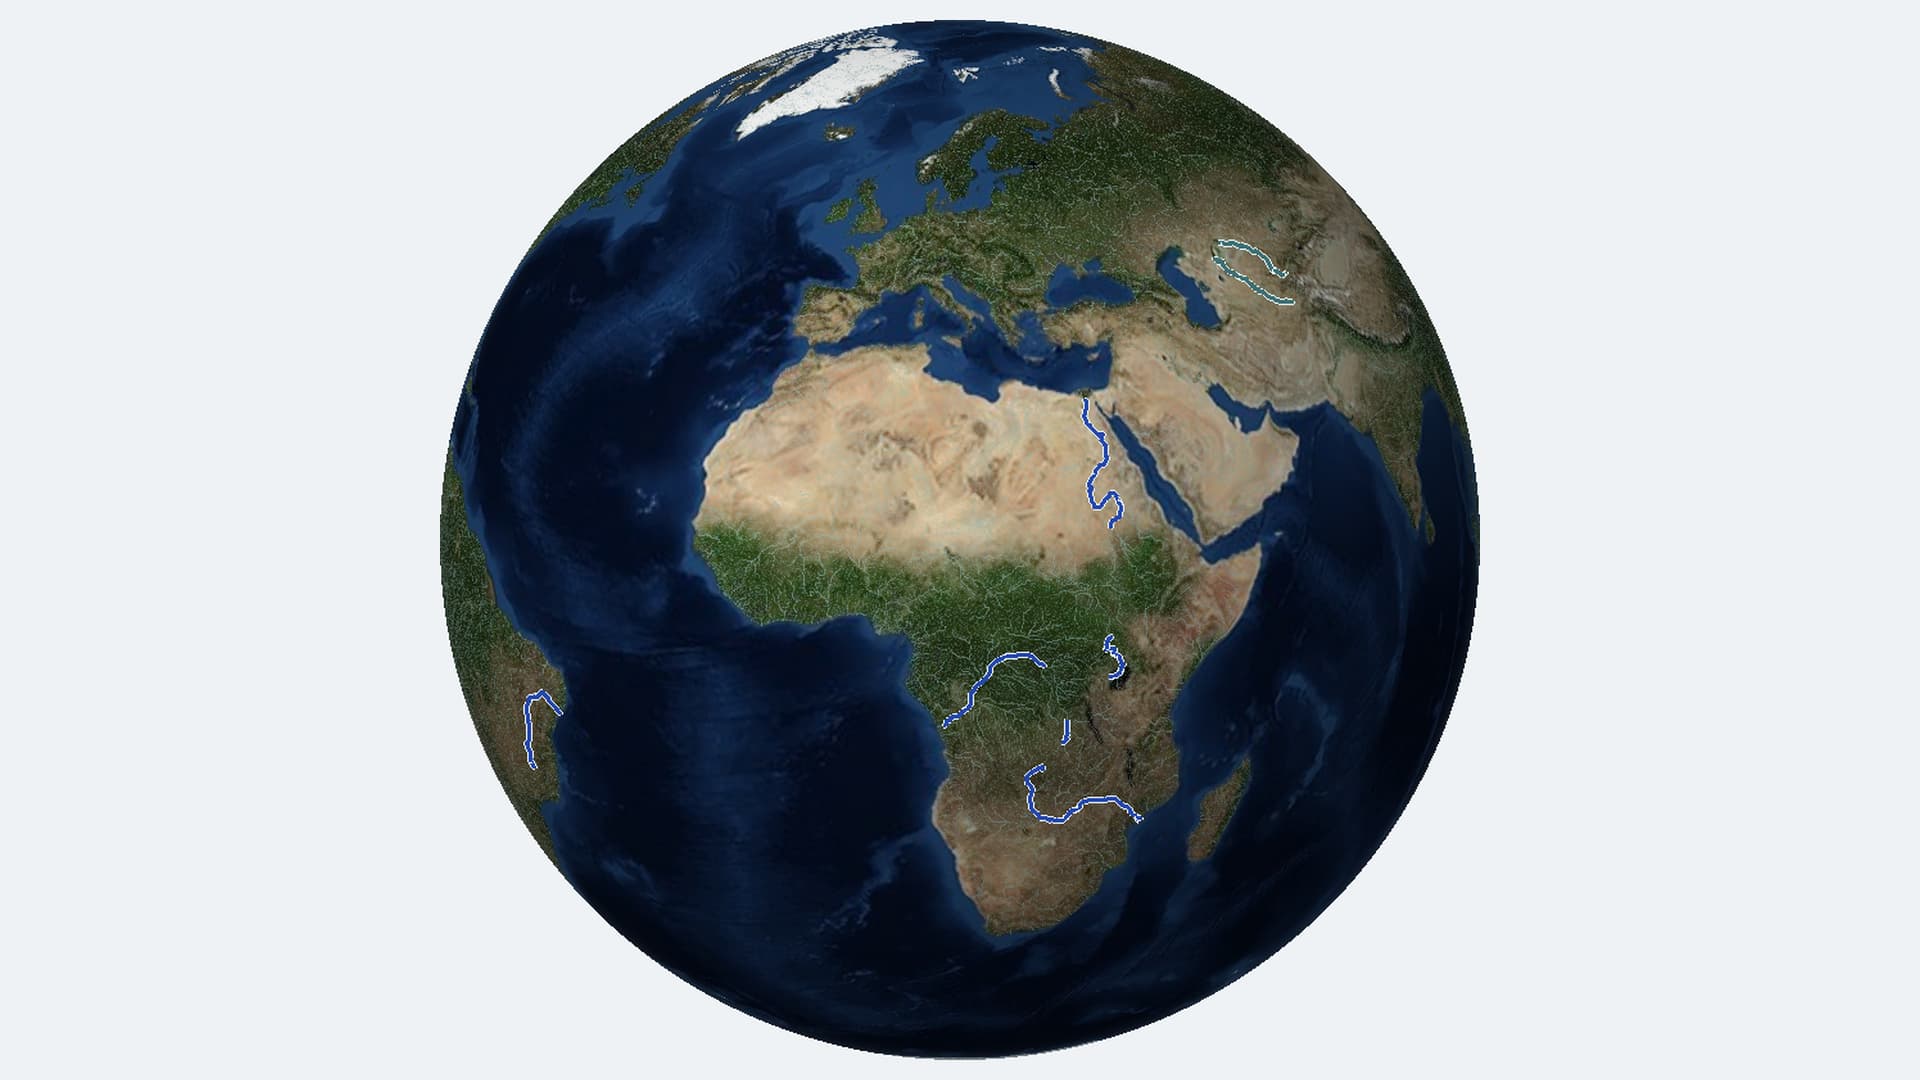
Following the Nile, Congo and Zambezi tributaries reveals what depends on their water: food, electricity and places for wildlife to live.
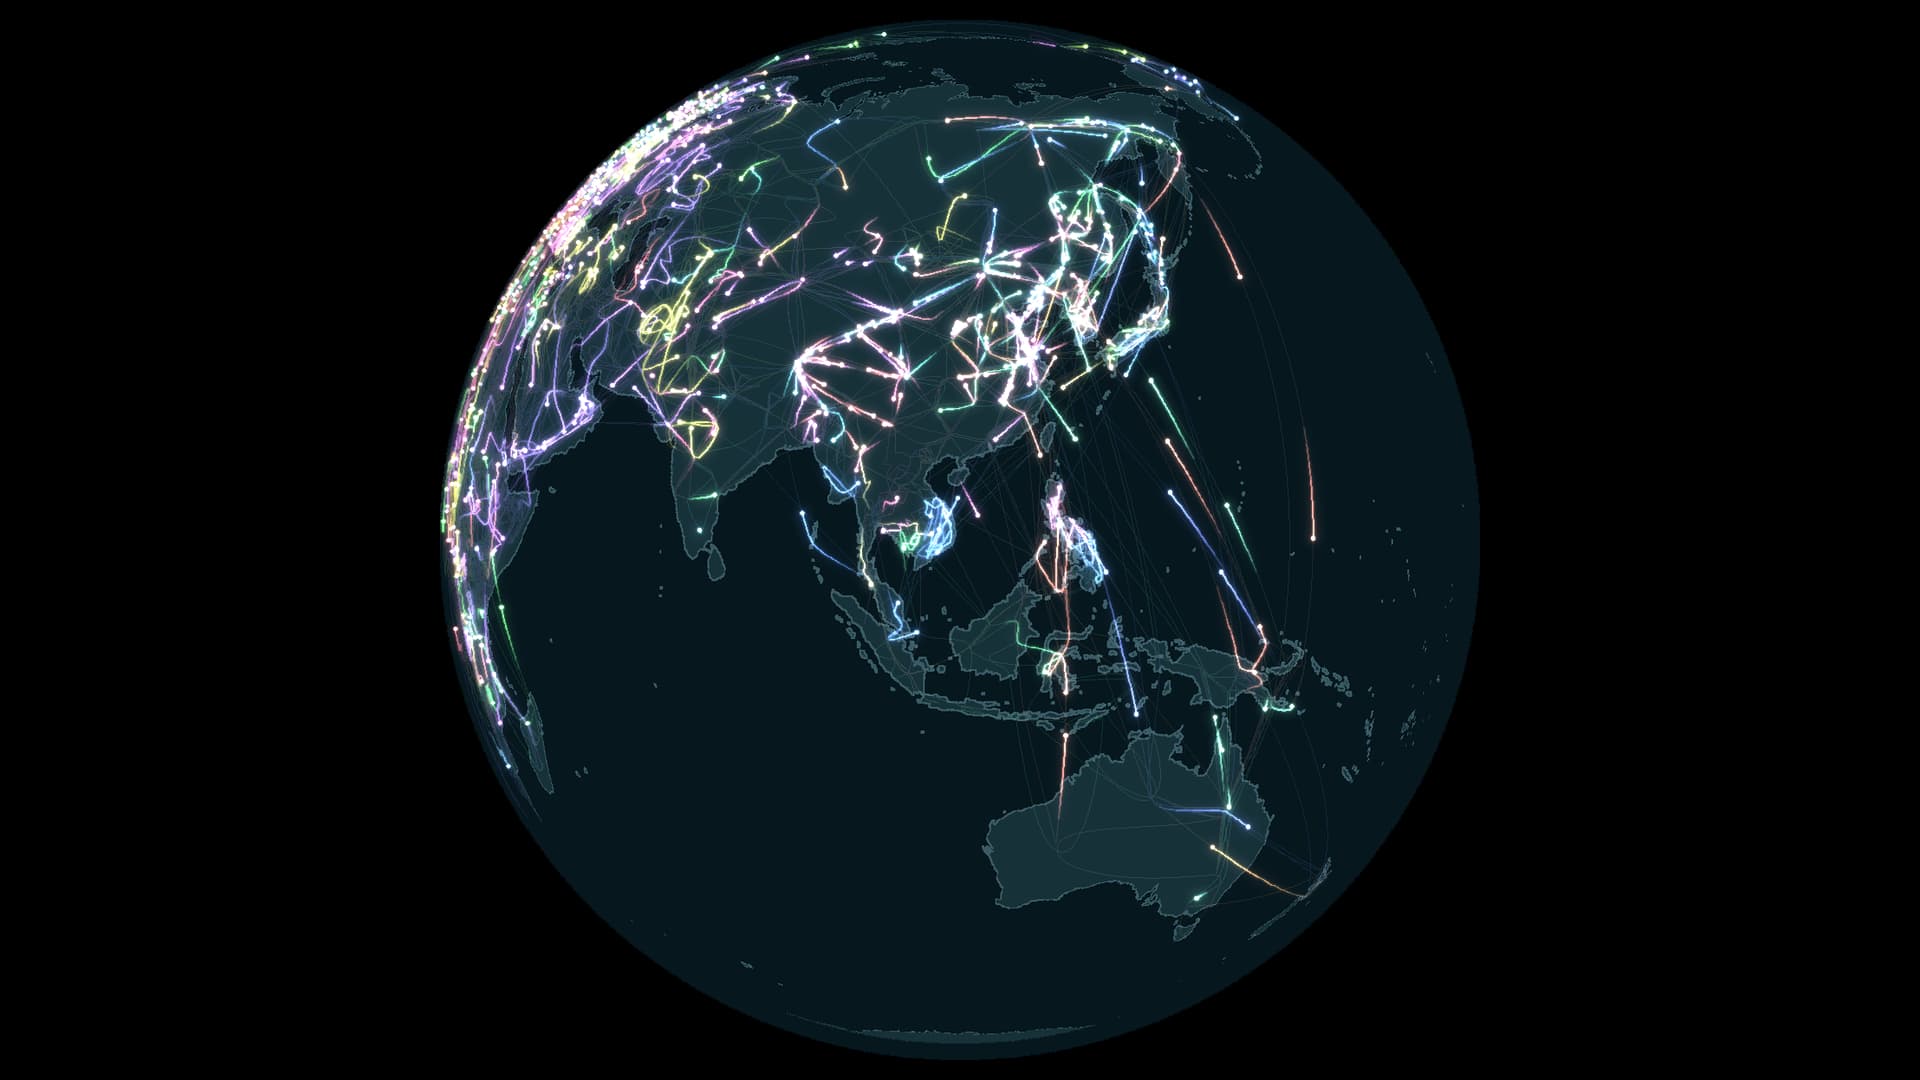
A map of 112 species leads from movement across the planet to the places that make each journey possible.
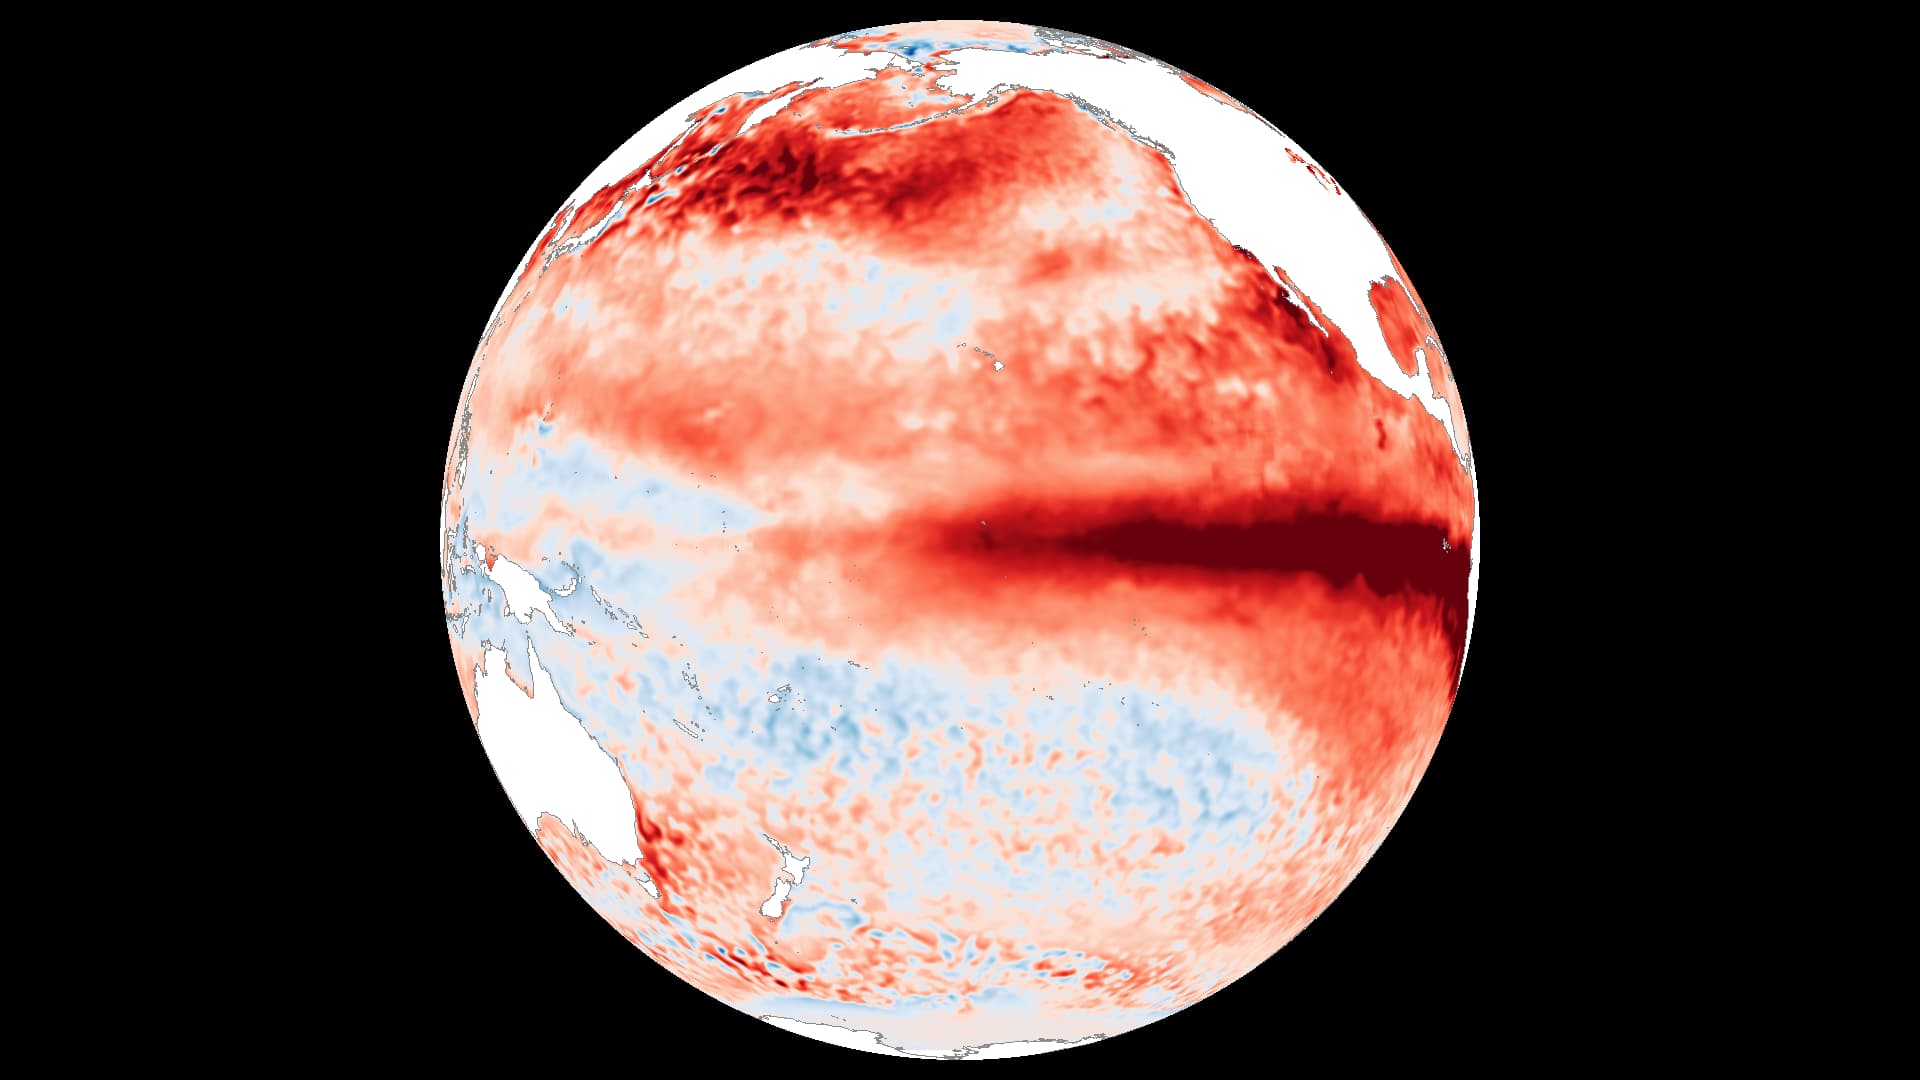
NOAA puts the chance of a record-strength El Niño in October–December 2026 at 75%. Three temperature maps show how the Pacific is changing.
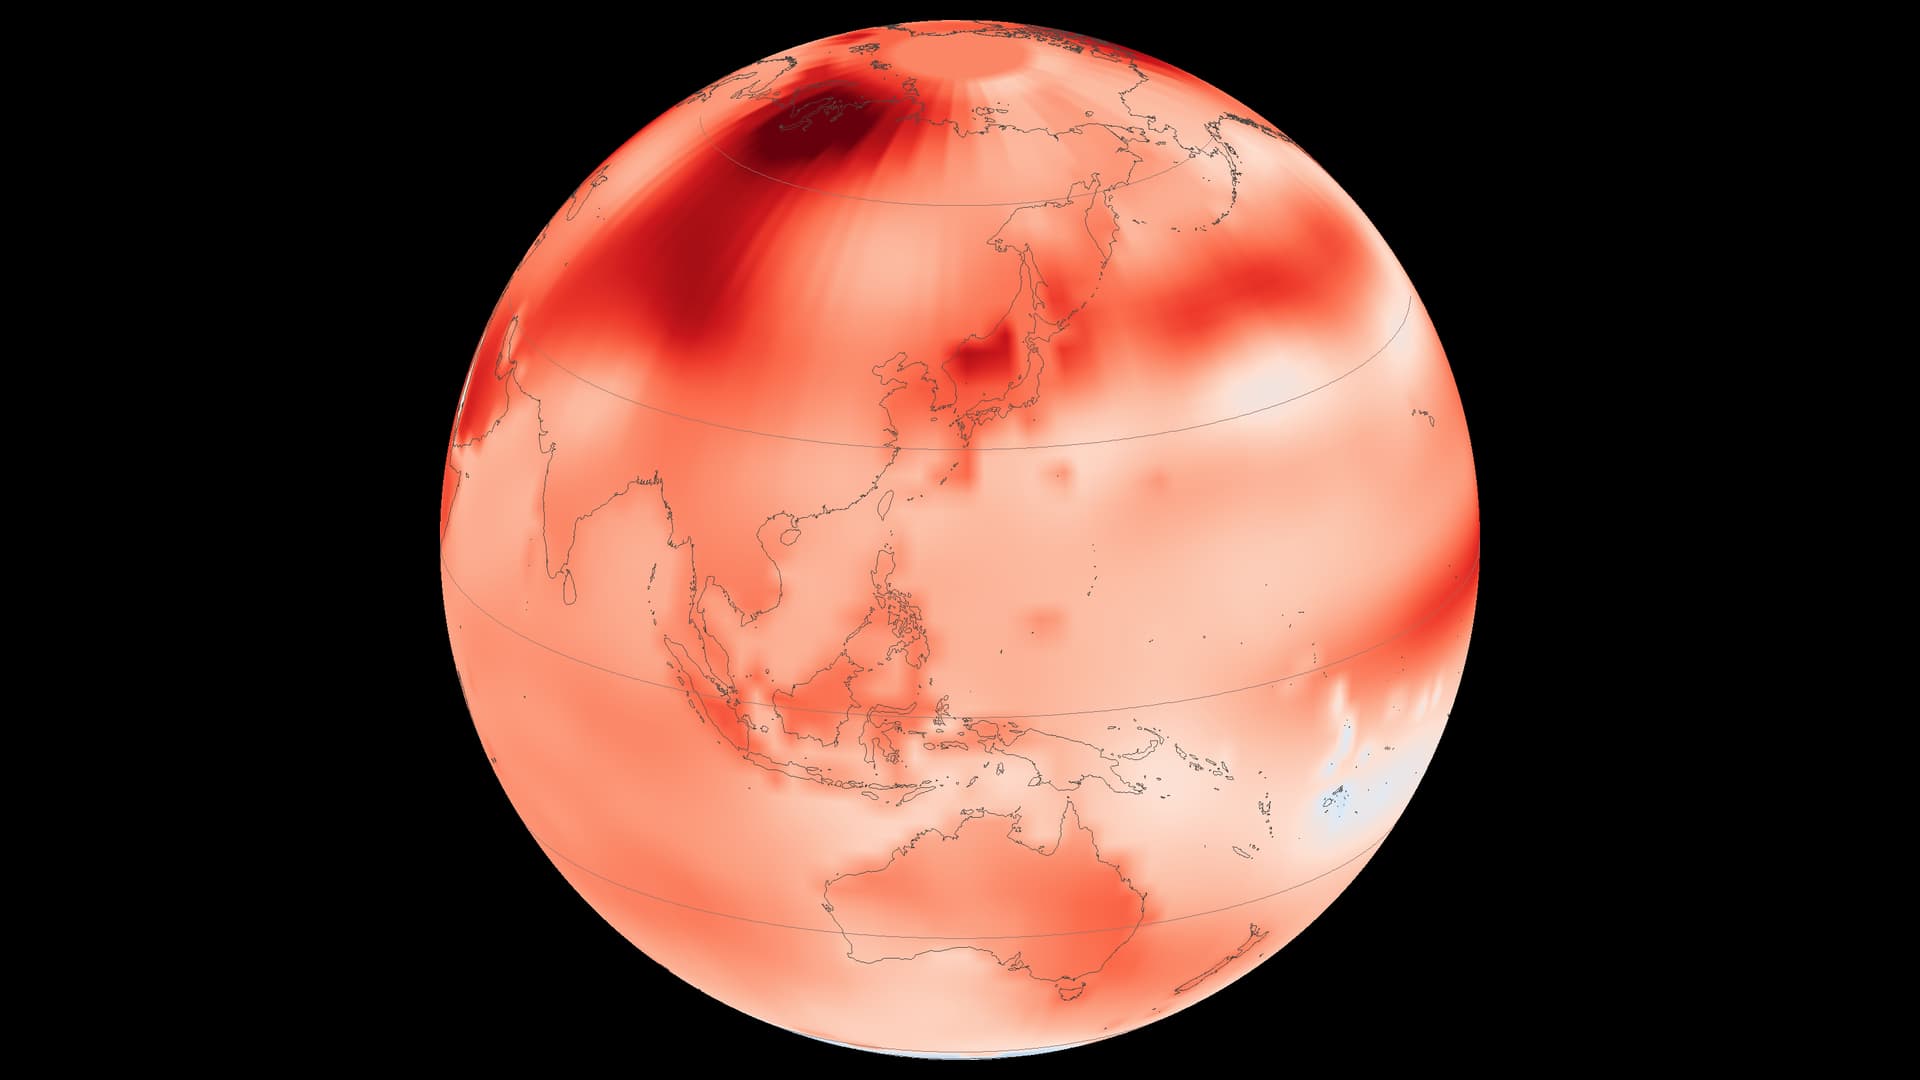
June–August 2026 set a global record in NASA’s temperature series. The geography behind that average tells a more varied story.
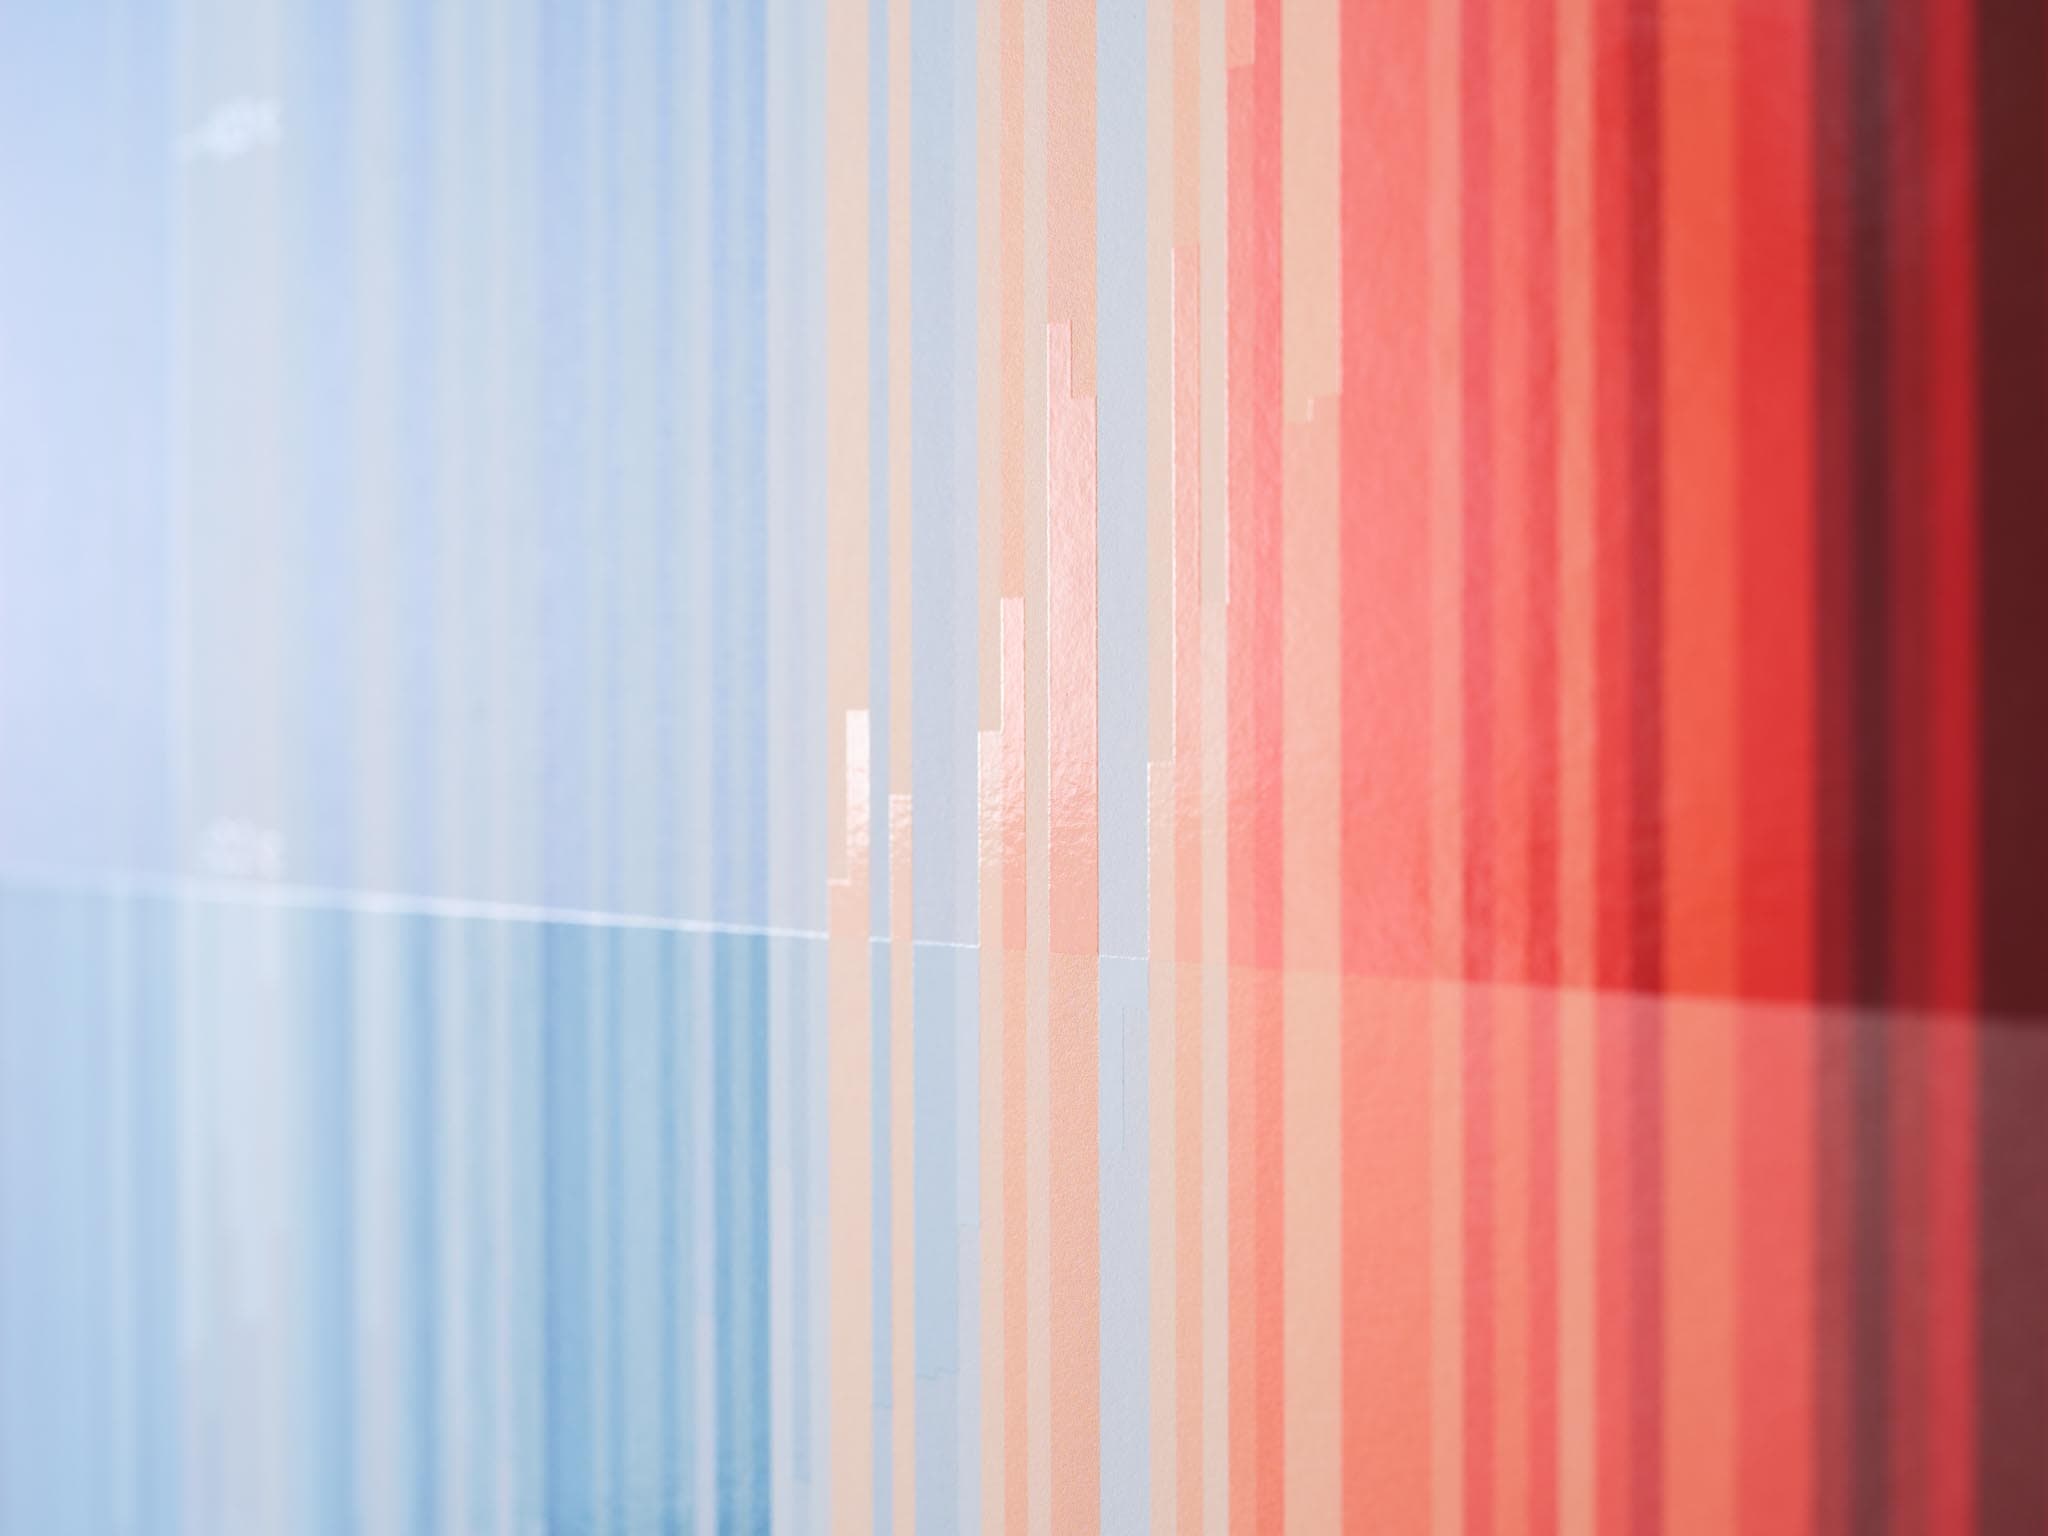
Now that climate change sits among the central concerns of international society, we can return to a simple question — how did human beings come to read the atmosphere as a system?
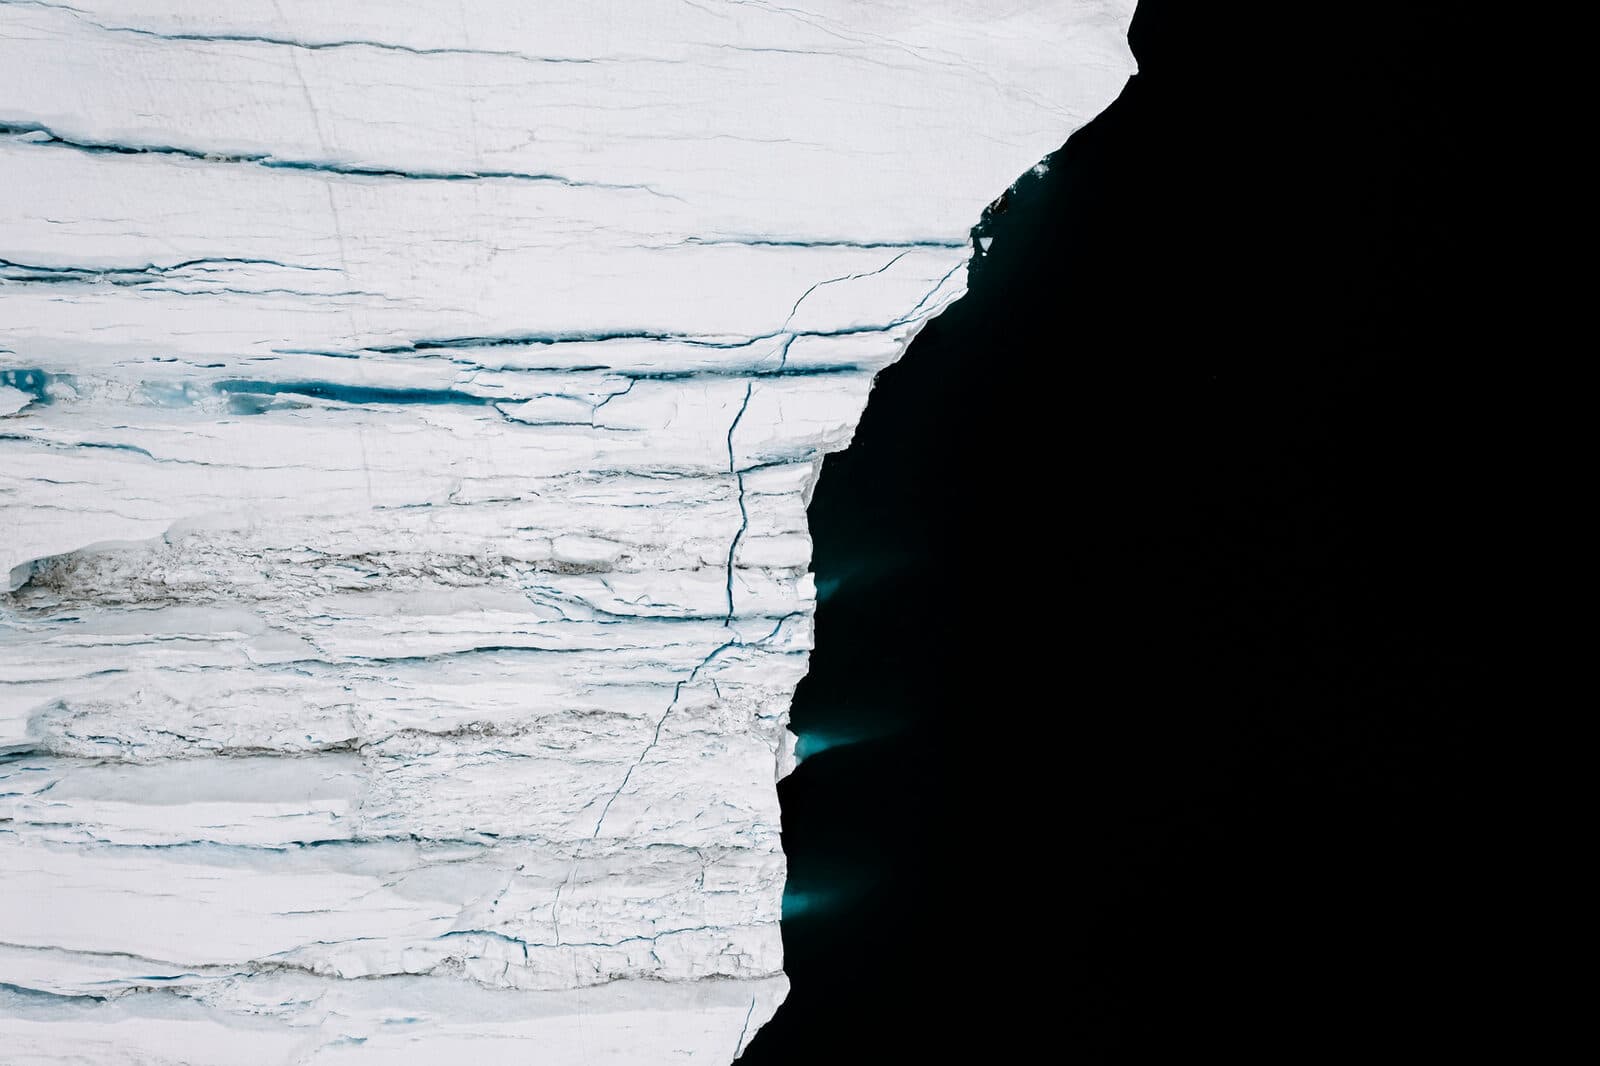
With only a small temperature change, sea ice might exist — or it might not. The fate of arctic ice will profoundly impact the interconnected networks of life on Earth.
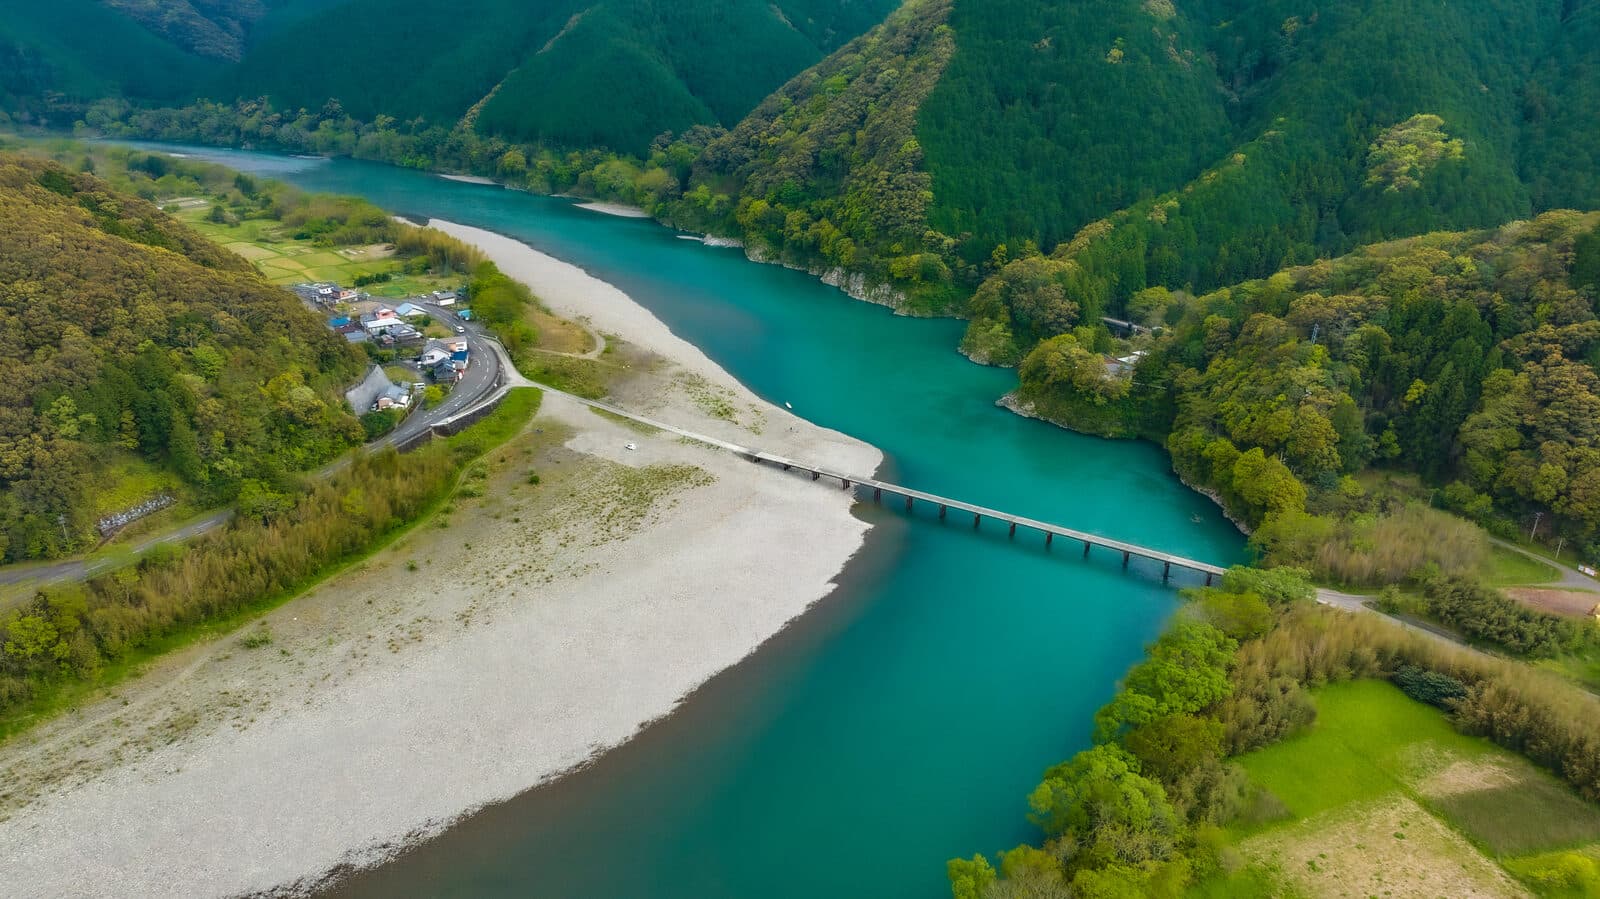
Rivers are the veins of the earth. They feed this planet with water and transport nutrients, sustaining life-giving ecosystems. Yet today, only 37% of the world's longest rivers still flow freely.
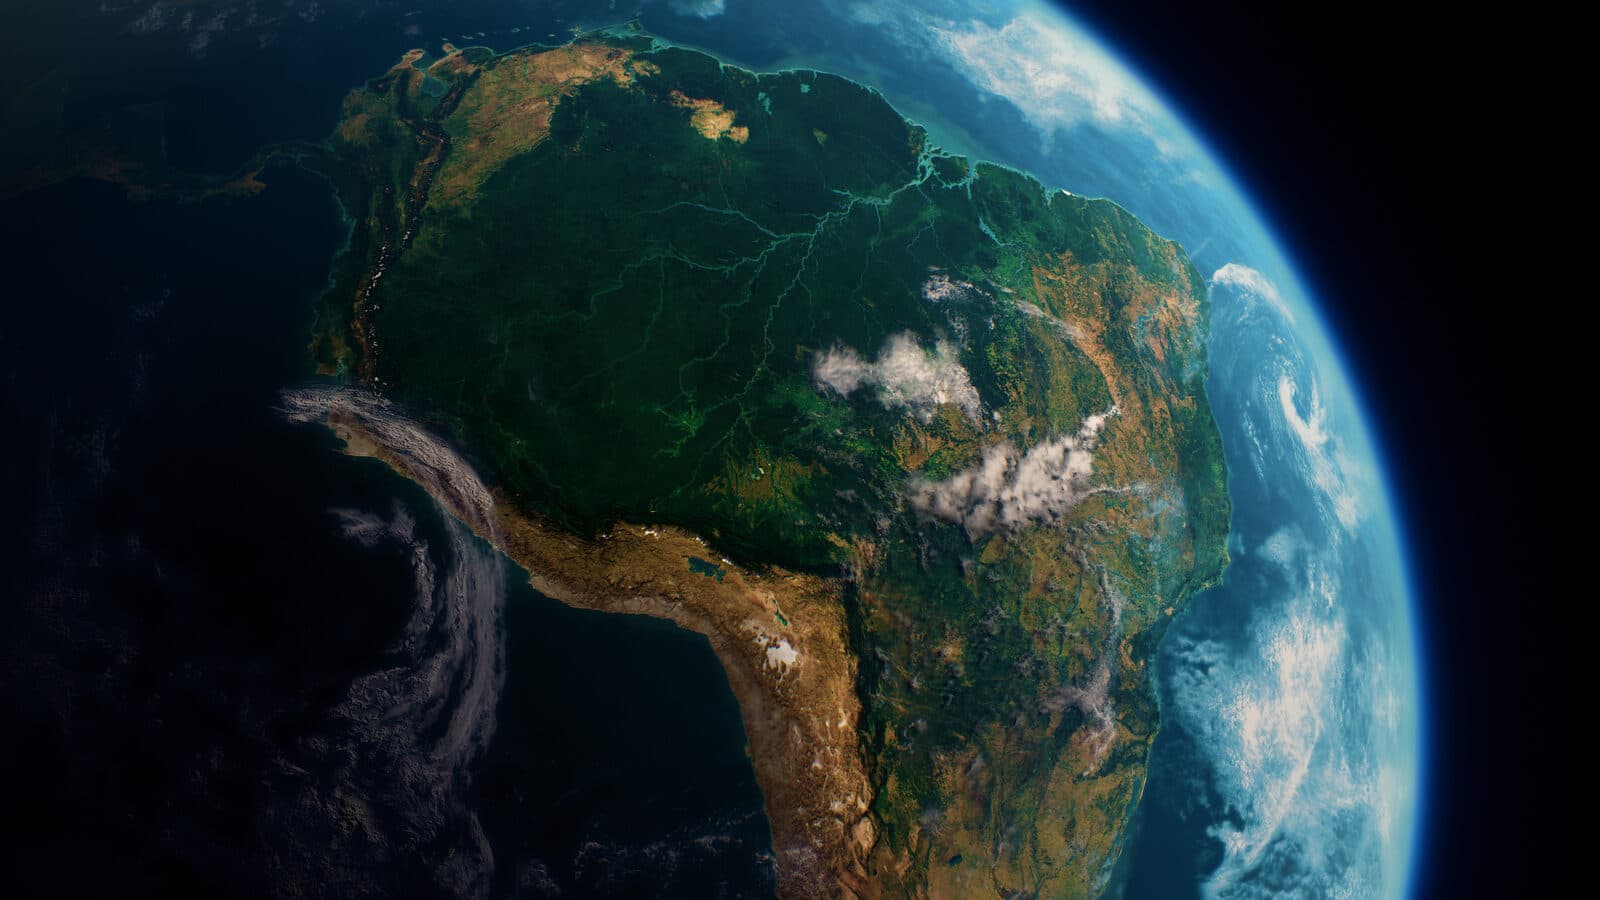
If the Earth is commonly known as 'The Blue Planet,' its accent colour must undoubtedly be 'Green Forest.' Forests cover almost one-third of all land globally — but their distribution and health is far from even.
Updates from SORAH, a few times a month.