Published on 18/October/2026 · Climate
Venice’s floods: caring for a city after the water recedes
By SORAH Editorial
Follow changing flood depth and the city’s relief through 109 outputs of a 2019 reconstruction.
When water covers Venice’s Piazza San Marco, the routes people take can narrow to temporary raised walkways. A café doorway, a church floor, a building beside a canal: small differences in height shape the work of living in and caring for this city.
On 12 November 2019, exceptional high water struck Venice, Italy. A research-model reconstruction lets us follow changing water depths across the main island over 12–13 November. Alongside documentary records from other flood days, it brings the familiar idea of a city on water down to specific elevations, buildings and daily work.
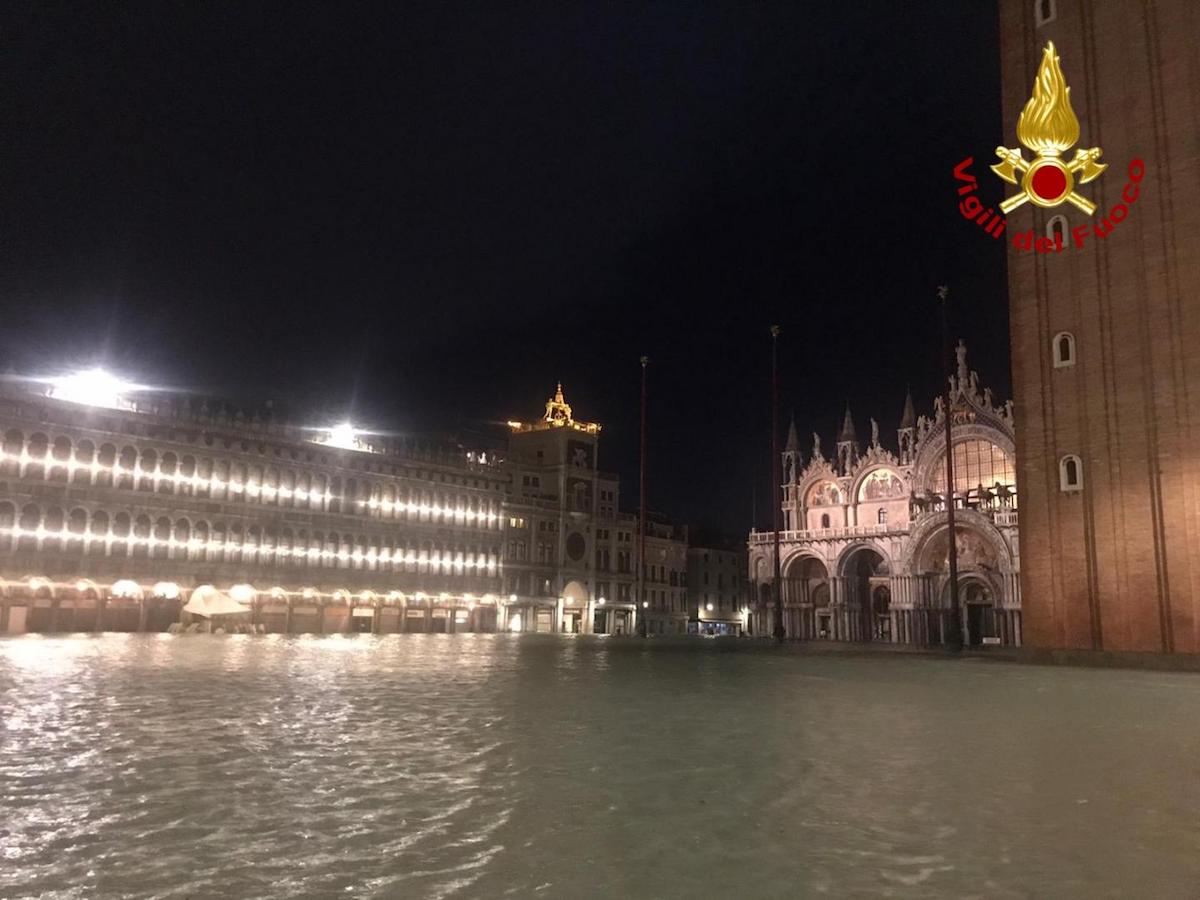
High water covering Piazza San Marco, Venice, on 12 November 2019. Ministero dell’interno / Vigili del Fuoco · Source · CC BY 3.0 · Unmodified.
12 November 2019: water inside the basilica
The municipal Punta Salute Canal Grande gauge recorded 156 cm on 29 October 2018 and 187 cm on 12 November 2019. These heights use Venice’s ZMPS reference datum. The depth of water above a particular street or floor depends on the elevation of that surface. Municipal tide archiveMario Piana, the conservation architect responsible for St Mark’s Basilica, describes water reaching about 40 cm above the church floor and more than 70 cm in the crypt during the 2019 event. A single tide measurement became different water depths across spaces within the same building. Mario Piana, “Acque alte e restauri”
Following 36 hours of water across the city
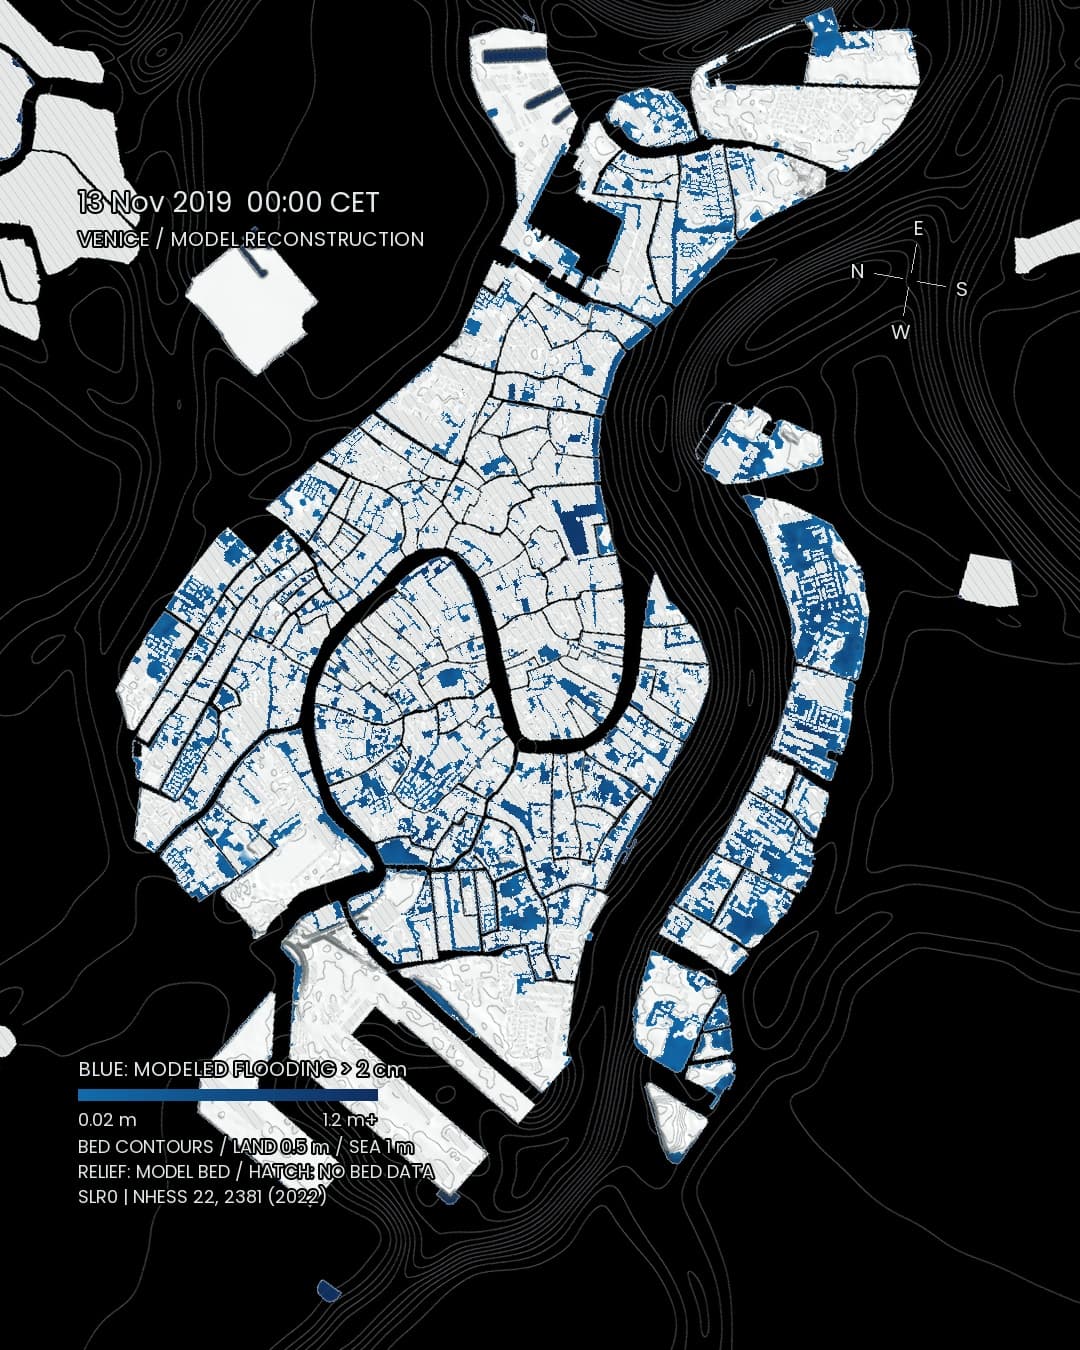
The map uses the parent model of the 2019 flood released by Schlumberger and colleagues. It follows 109 outputs at 20-minute intervals under one set of modeling conditions. Comparing their depths connects the city’s relief with the changing distribution of water.A reconstruction provides a way to examine exposure alongside the measures that protect entrances, floors and whole districts. The sequence brings attention to water arriving and receding, as well as its depth at a single moment. Schlumberger et al., NHESS (2022)
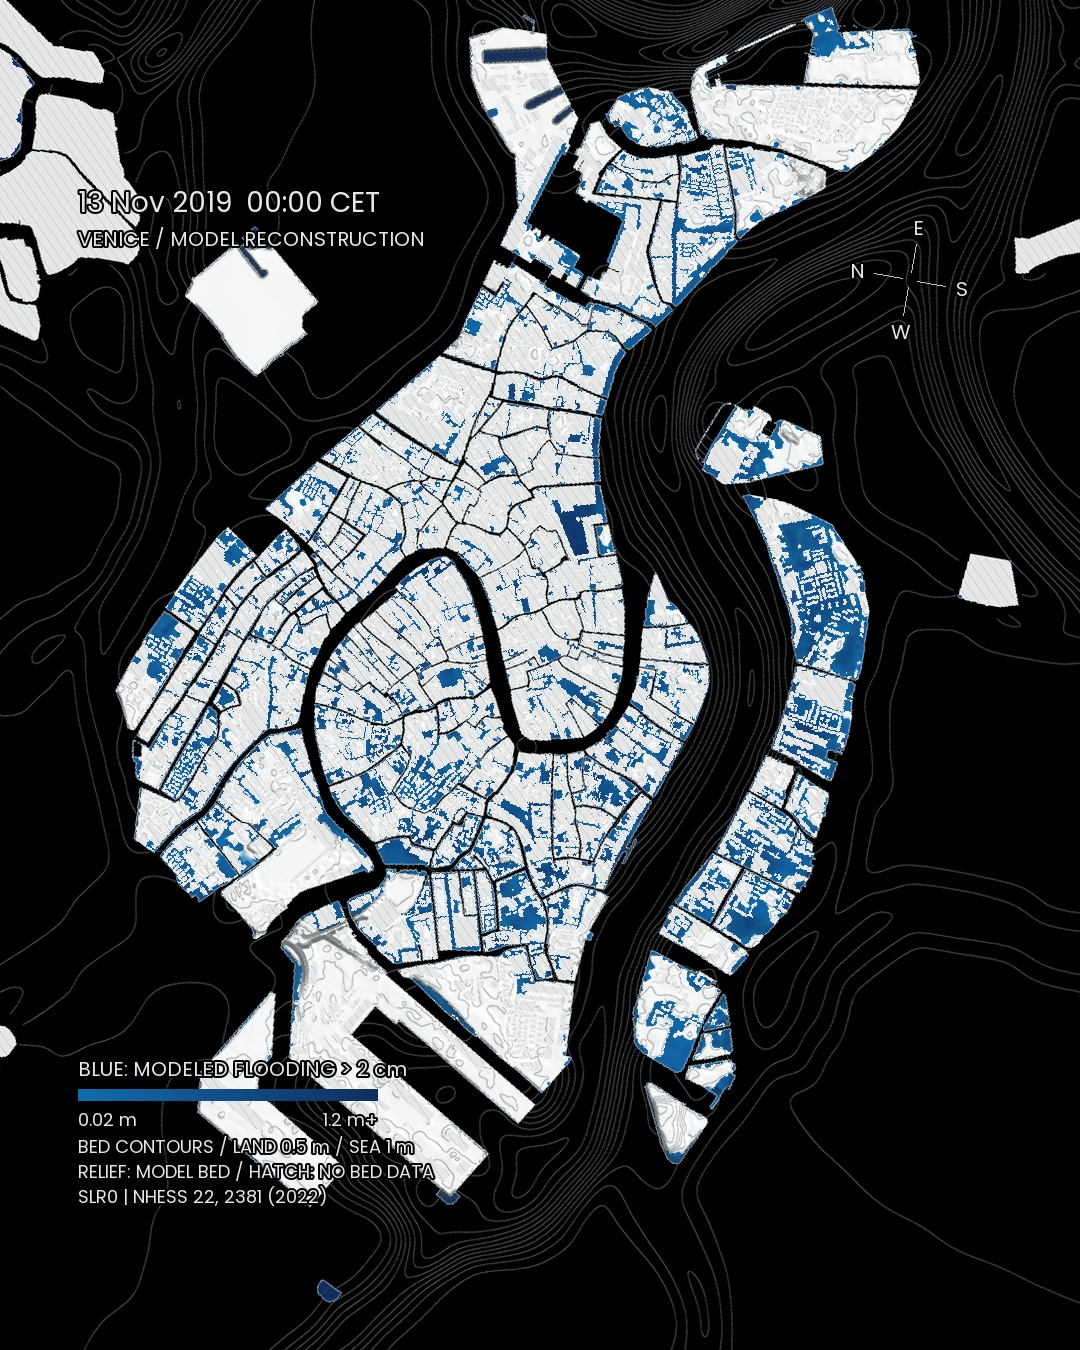
Model reconstruction at 00:00 CET on 13 November 2019. Blue marks modeled land depth above 2 cm.
The water recedes. The salt remains.
Saline water continues to affect a building after a flood. Salt crystallizing within stone, brick and mortar contributes to deterioration. The conservation account records washing floors with fresh water, removing salts and stabilizing displaced mosaic and marble pieces. The time needed for the tide to fall is very different from the time required to care for damaged material.A photograph of a flooded square captures the immediate event. Connecting it to the basilica’s floors and crypt also brings attention to the smaller, sustained tasks that follow. A recorded height becomes part of the history of a material and of the people working to preserve it.
Large defences and low-lying places
On 9 March 2024, local footage showed water and raised pedestrian walkways in Piazza San Marco. The municipal tide extreme for that date was 93 cm. Reporting on 23 October 2025 documented flooding around Caffè Quadri and nearby premises. Both the city’s extrema table and its MOSE-operation table record 93 cm at 09:20 that day. RAI, March 2024 / RAI, October 2025MOSE limits water entering the lagoon, while local works protect particular buildings and public spaces. In April 2025, the Basilica reported completion of waterproofing on its canal-facing basement. Internal barriers and watertight fittings added protection alongside the glass barrier already installed at the front and side. Procuratoria di San Marco, April 2025
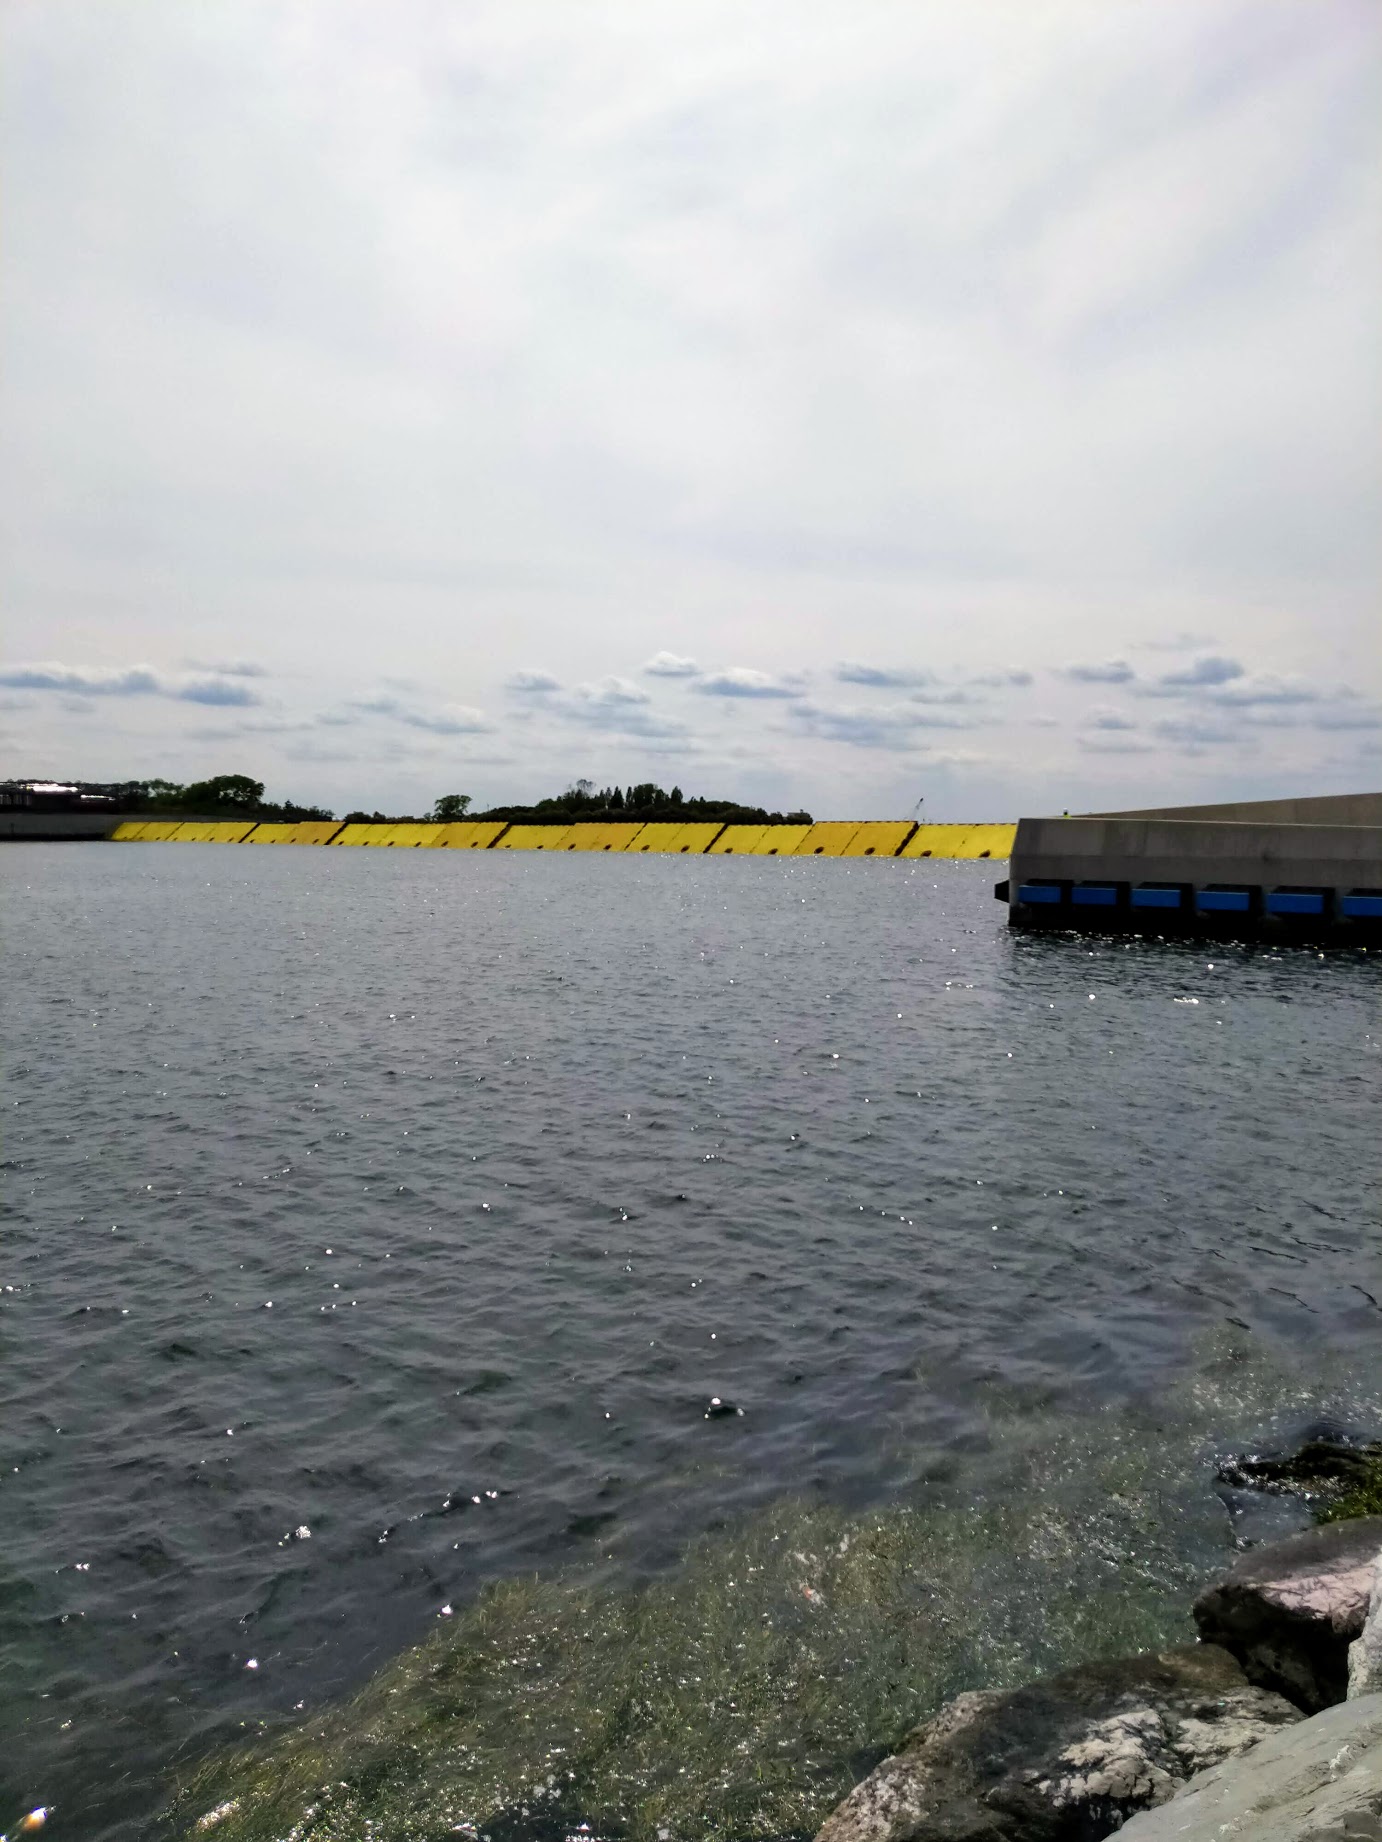
MOSE mobile flood barriers during a raising test at the Malamocco inlet, Venice, on 31 May 2020. Fusi Sandro · Source · CC BY-SA 4.0 · Unmodified.
Knowing the city’s heights
The major 2019 tide and recent flooding in the square draw attention to both the wider water level and local elevations. Records establish when water reached a named place. Elevation surveys and information about protective works help explain the conditions and the practical choices at that location.Crossing a square, opening a shop and walking across a historic floor are ordinary acts sustained by continuing work. In Venice, measuring water levels and caring for buildings are part of that work. Following a small mark on a map brings the relationship between sea and city down to the height of a doorway or a single piece of stone.
Data and representation
Coverage: 12 Nov 2019 01:00 to 13 Nov 2019 13:00 CET; 36 hours, 109 records at 20-minute intervals. SLR0 parent-model reconstruction.Map and film: Blue marks modeled depth above 0.02m on land. Common 0.02–1.2m color scale, saturated above 1.2m. Twenty seconds at 30fps, linearly interpolated between model outputs.
Terrain: Original node elevations interpolated within original model faces. Land contours every 0.5m, sea every 1m. Sea contours are generalized with approximately 48m display smoothing; relief lighting is visually enhanced. Hatched terrain gaps are retained.
Explorer: All 109 times are selectable. RG PNG encodes depth in centimeters, with maximum rounding error 0.005m. Click for coordinates and modeled depth.
Validation and scope: All 109 records checked against the complete 36,986,602,432-byte source. Acquisition gaps are resolved. Narrow streets, mesh gaps, numerical instabilities and limited calibration evidence remain model limitations. One 2019 event.
Source and reuse: Schlumberger et al., NHESS 22, 2381–2400 (2022) and the linked model data. CC BY 4.0. Extraction, interpolation, coloring, display smoothing and animation by SORAH. Land geometry: Atlante della laguna di Venezia / Terre emerse (provider terms). No endorsement by the original authors is implied.
Sources
Author
SORAH Editorial
October 18, 2026