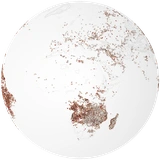
Explore 19 datasets and teaching schematics. Open combinations by Earth-science topic and check their dates, sources and limits.
Explore secondary-school Earth science with global data. Choose a question, overlay, compare and record what you notice.
Check each layer’s time, units and source. Spatial overlap alone does not establish a cause.
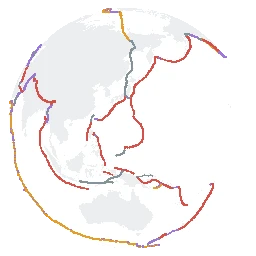
Earthquakes, volcanoes and plates
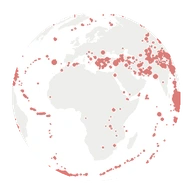
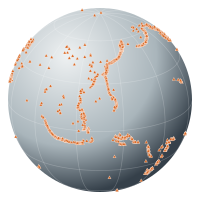
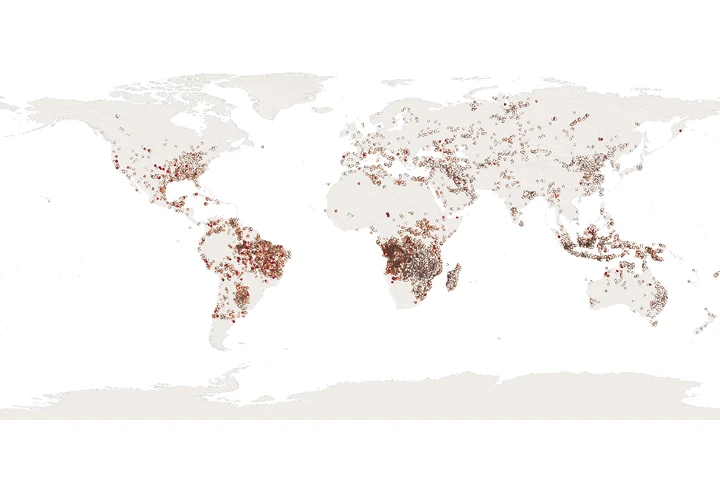
Which boundaries do earthquakes and volcanoes follow?
Explore this combinationSteps and vocabulary
- Start with earthquakes of M6.5 and above. Follow earthquakes and volcanoes from Japan around the Pacific rim.
- How do boundary types and seafloor shape differ in the middle of the Atlantic?
- Find earthquakes or volcanoes away from boundaries and record the exceptions.
- Plate
- A large, rigid slab of rock forming Earth’s outer shell.
- Epicenter and focus
- The focus is where an earthquake starts underground. The epicenter is directly above it on the surface.
Spatial patterns are clues. Boundary lines cannot predict the time or magnitude of earthquakes.
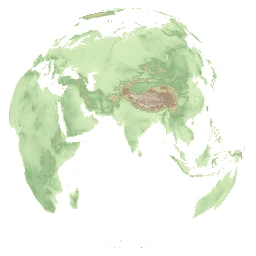
Landforms and flowing water
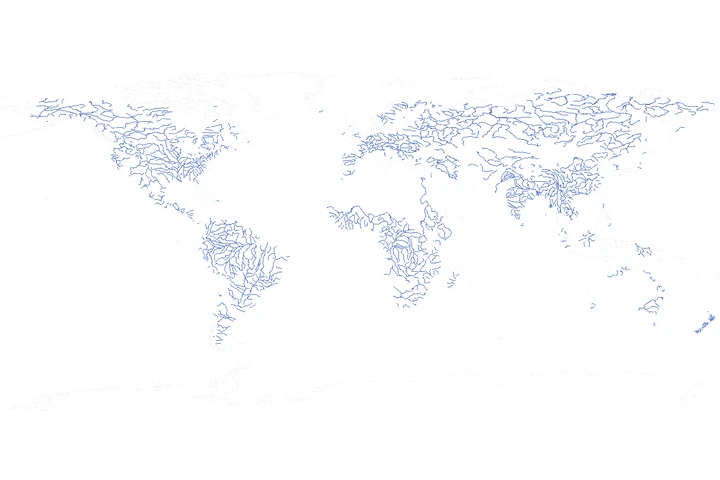
How do rivers connect high mountains to the sea?
Explore this combinationSteps and vocabulary
- Read the elevation colors, then follow rivers near the Himalayas to their mouths.
- Start with major rivers. After zooming in, choose “With tributaries” in river settings and compare upstream/downstream connections and line widths.
- Check whether another continent shows similar patterns.
- Drainage basin
- The area where rain and snow drain into the same river.
- Erosion, transport and deposition
- Water wears away ground, carries sediment and deposits it where flow slows or conditions change.
Line width represents estimated long-term mean discharge, not current flow, river width or flood risk.
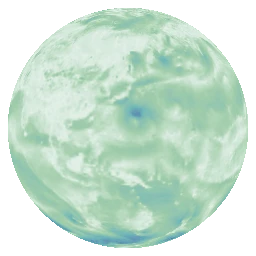
Wind, pressure and precipitation
How are wind and precipitation arranged around low pressure?
Explore this combinationSteps and vocabulary
- Adjust opacity in each layer’s settings and compare low pressure with wind arrows.
- Overlay precipitation and check whether its strongest areas coincide with low-pressure centers.
- Align the timestamps before comparing another time and recording changes.
- Sea-level pressure
- Pressure adjusted to sea level so locations at different elevations can be compared.
- Precipitation rate
- How intensely rain or snow falls. mm/h expresses equivalent water depth per hour.
These are analyses from a fixed period. Short-term weather is not the same as long-term regional climate.
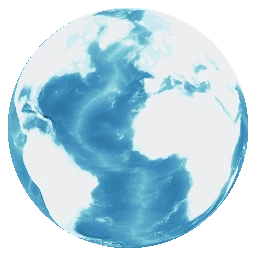
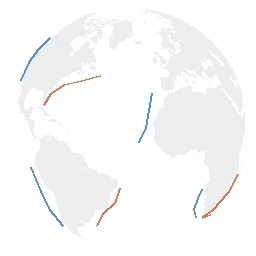
Seafloor and ocean currents
How do current directions and properties differ on eastern and western coasts?
Explore this combinationSteps and vocabulary
- Read the warm/cold legend and compare the North Atlantic with the North Pacific.
- Zoom to the Kuroshio and Oyashio and inspect their names and directions.
- Distinguish seafloor ridges and trenches from surface ocean currents.
- Warm and cold currents
- Currents carrying water warmer or colder than their surroundings. Colors do not give absolute temperature.
- Continental shelf
- The relatively shallow, gently sloping seafloor along continental margins.
Currents are ten major schematic paths. Meanders, eddies, deep circulation and seasonal changes are not represented.
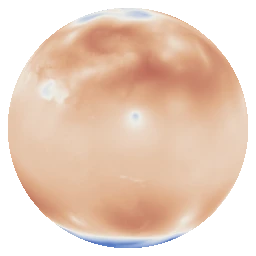
Climate change and sea ice
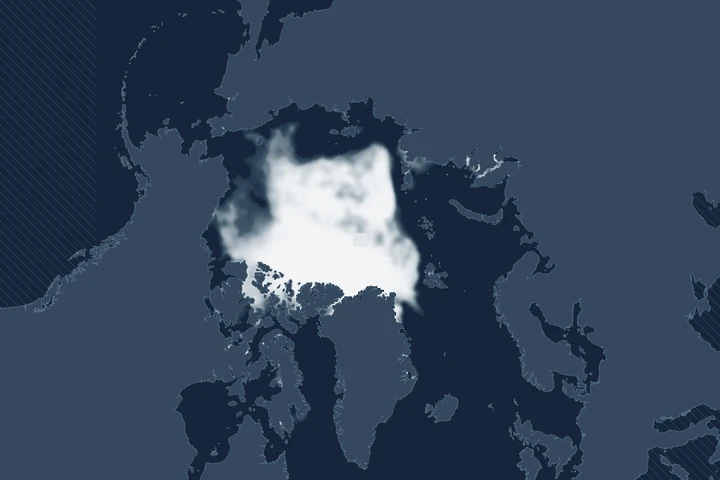
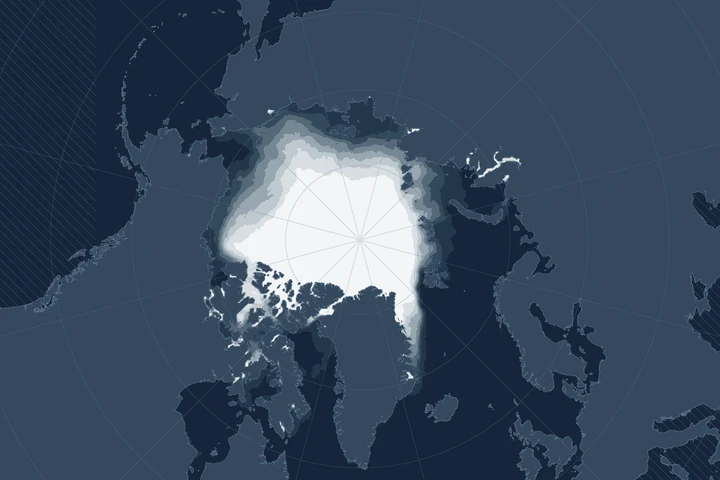
How can we distinguish seasonal changes from changes over decades?
Explore this combinationSteps and vocabulary
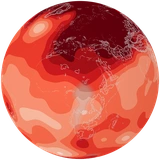
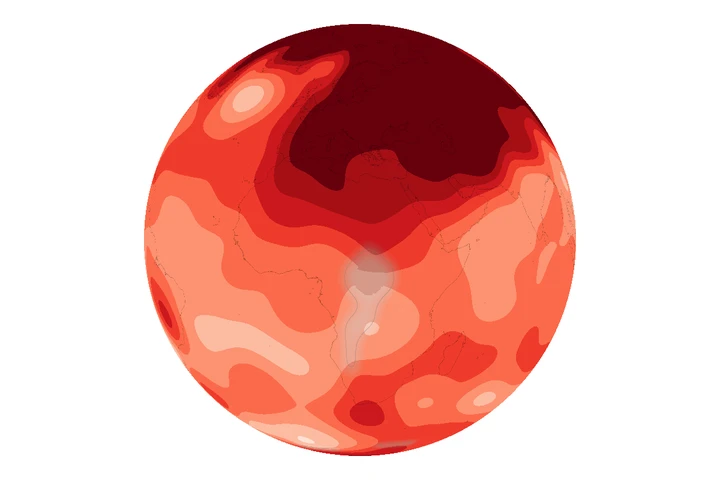
- Check that temperature colors show differences from a reference period, not absolute temperatures.
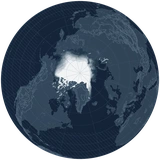
- Switch Arctic sea ice between annual extent and seasonal concentration.
- Choose comparisons with the same month and definition.
- Temperature anomaly
- The difference above or below the average of a specified reference period.
- Sea-ice extent and concentration
- Extent is ocean area meeting an ice threshold; concentration is the ice-covered fraction of a grid cell.
Seasonal and long-term modes have different sources, periods and definitions. Ice thickness and volume are not included.
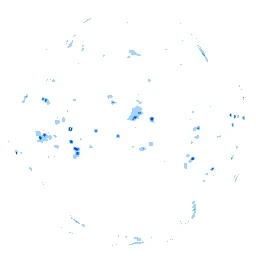
Particles in the atmosphere
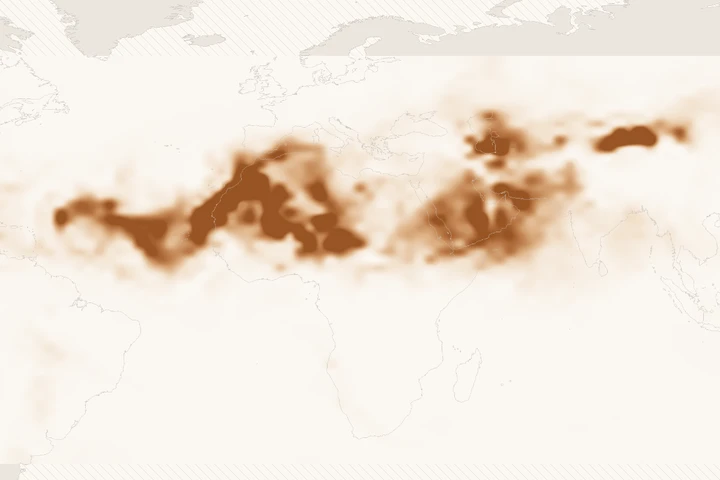
How far does dust spread after leaving land?
Explore this combinationSteps and vocabulary
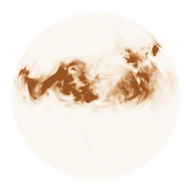
- Select dust and observe its spread from the Sahara toward the Atlantic.
- Use sources and dates to distinguish dust from total aerosol.
- Use the units to consider whether colors alone can establish health effects.
- Optical depth
- A measure of how strongly particles attenuate light.
The datasets cover different periods. They do not directly measure ground-level dust concentration or inhaled amounts.
Observing Earth from space
Which parts of Earth do satellites pass over?
Explore this combinationSteps and vocabulary
- Choose one satellite and follow its position with the time slider.
- Compare orbital height in 3D with the ground track in 2D.
- Compare a near-polar satellite orbit with a space-station orbit.
- Orbit
- The path followed by a body or satellite under gravity.
- Ground track
- The line joining points on Earth directly below a satellite.
These predictions use orbital elements from the recorded date. They do not show live positions, all satellites, constellations or planetary motion.
Scope of learning
This map teaches surface patterns and changes. Rock and mineral identification, fossils and geological history, Earth’s interior, constellations and planetary motion are outside its scope. Use it alongside observations, experiments and textbooks.
MEXT upper-secondary curriculum ↗