Published on 04/October/2026 · Climate
Invisible methane, from detection to reduction.
By SORAH Editorial
Methane detected from orbit provides a starting point for investigating emissions on the ground. Records from 2024–2026 reveal the space between an observation and a response.
Methane detected from orbit provides a starting point for investigating emissions on the ground. Records from 2024–2026 reveal the space between an observation and a response.
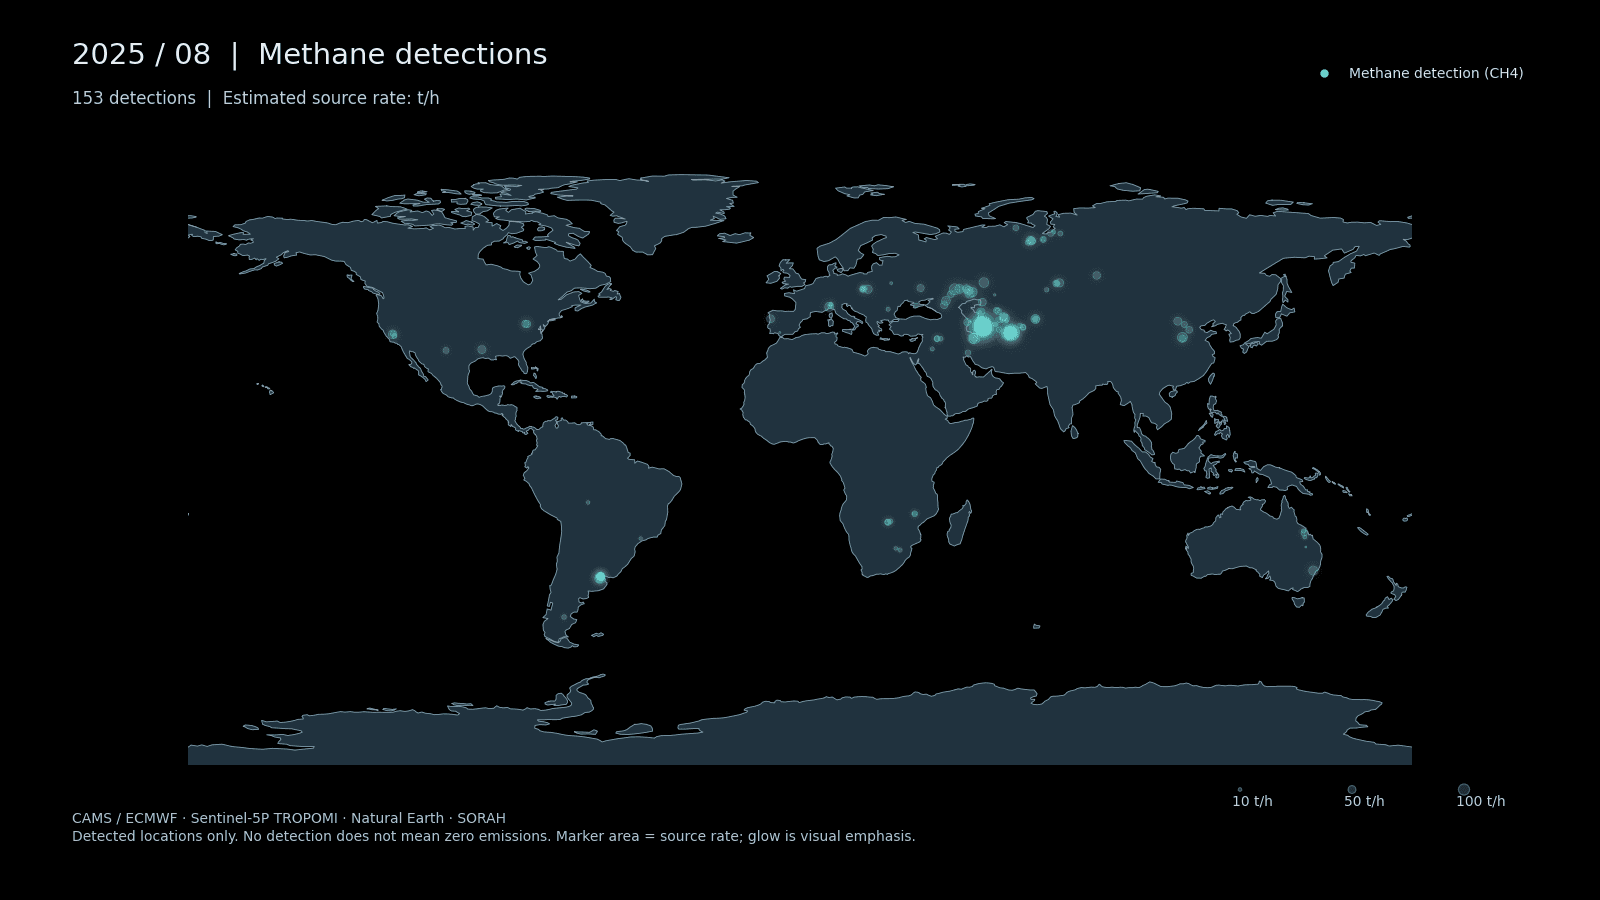
5,094 detection records in 27 months, 26 July 2024–25 September 2026. Marker area represents estimated source rate at detection (t/h). Cyan and overlapping glow are display treatments, not concentration or plume extent. No detection does not mean zero emissions.
Equipment below, gas above
Points appear above land, changing from month to month. They record large methane emissions detected from satellite observations, with likely source types including oil, gas, coal and landfills. Repeated observations can produce several points at one location; detection counts are not facility counts.[1] Methane is colorless, yet it warms the atmosphere. Its shorter atmospheric lifetime than carbon dioxide makes reducing emissions important for limiting warming in the near term.[3]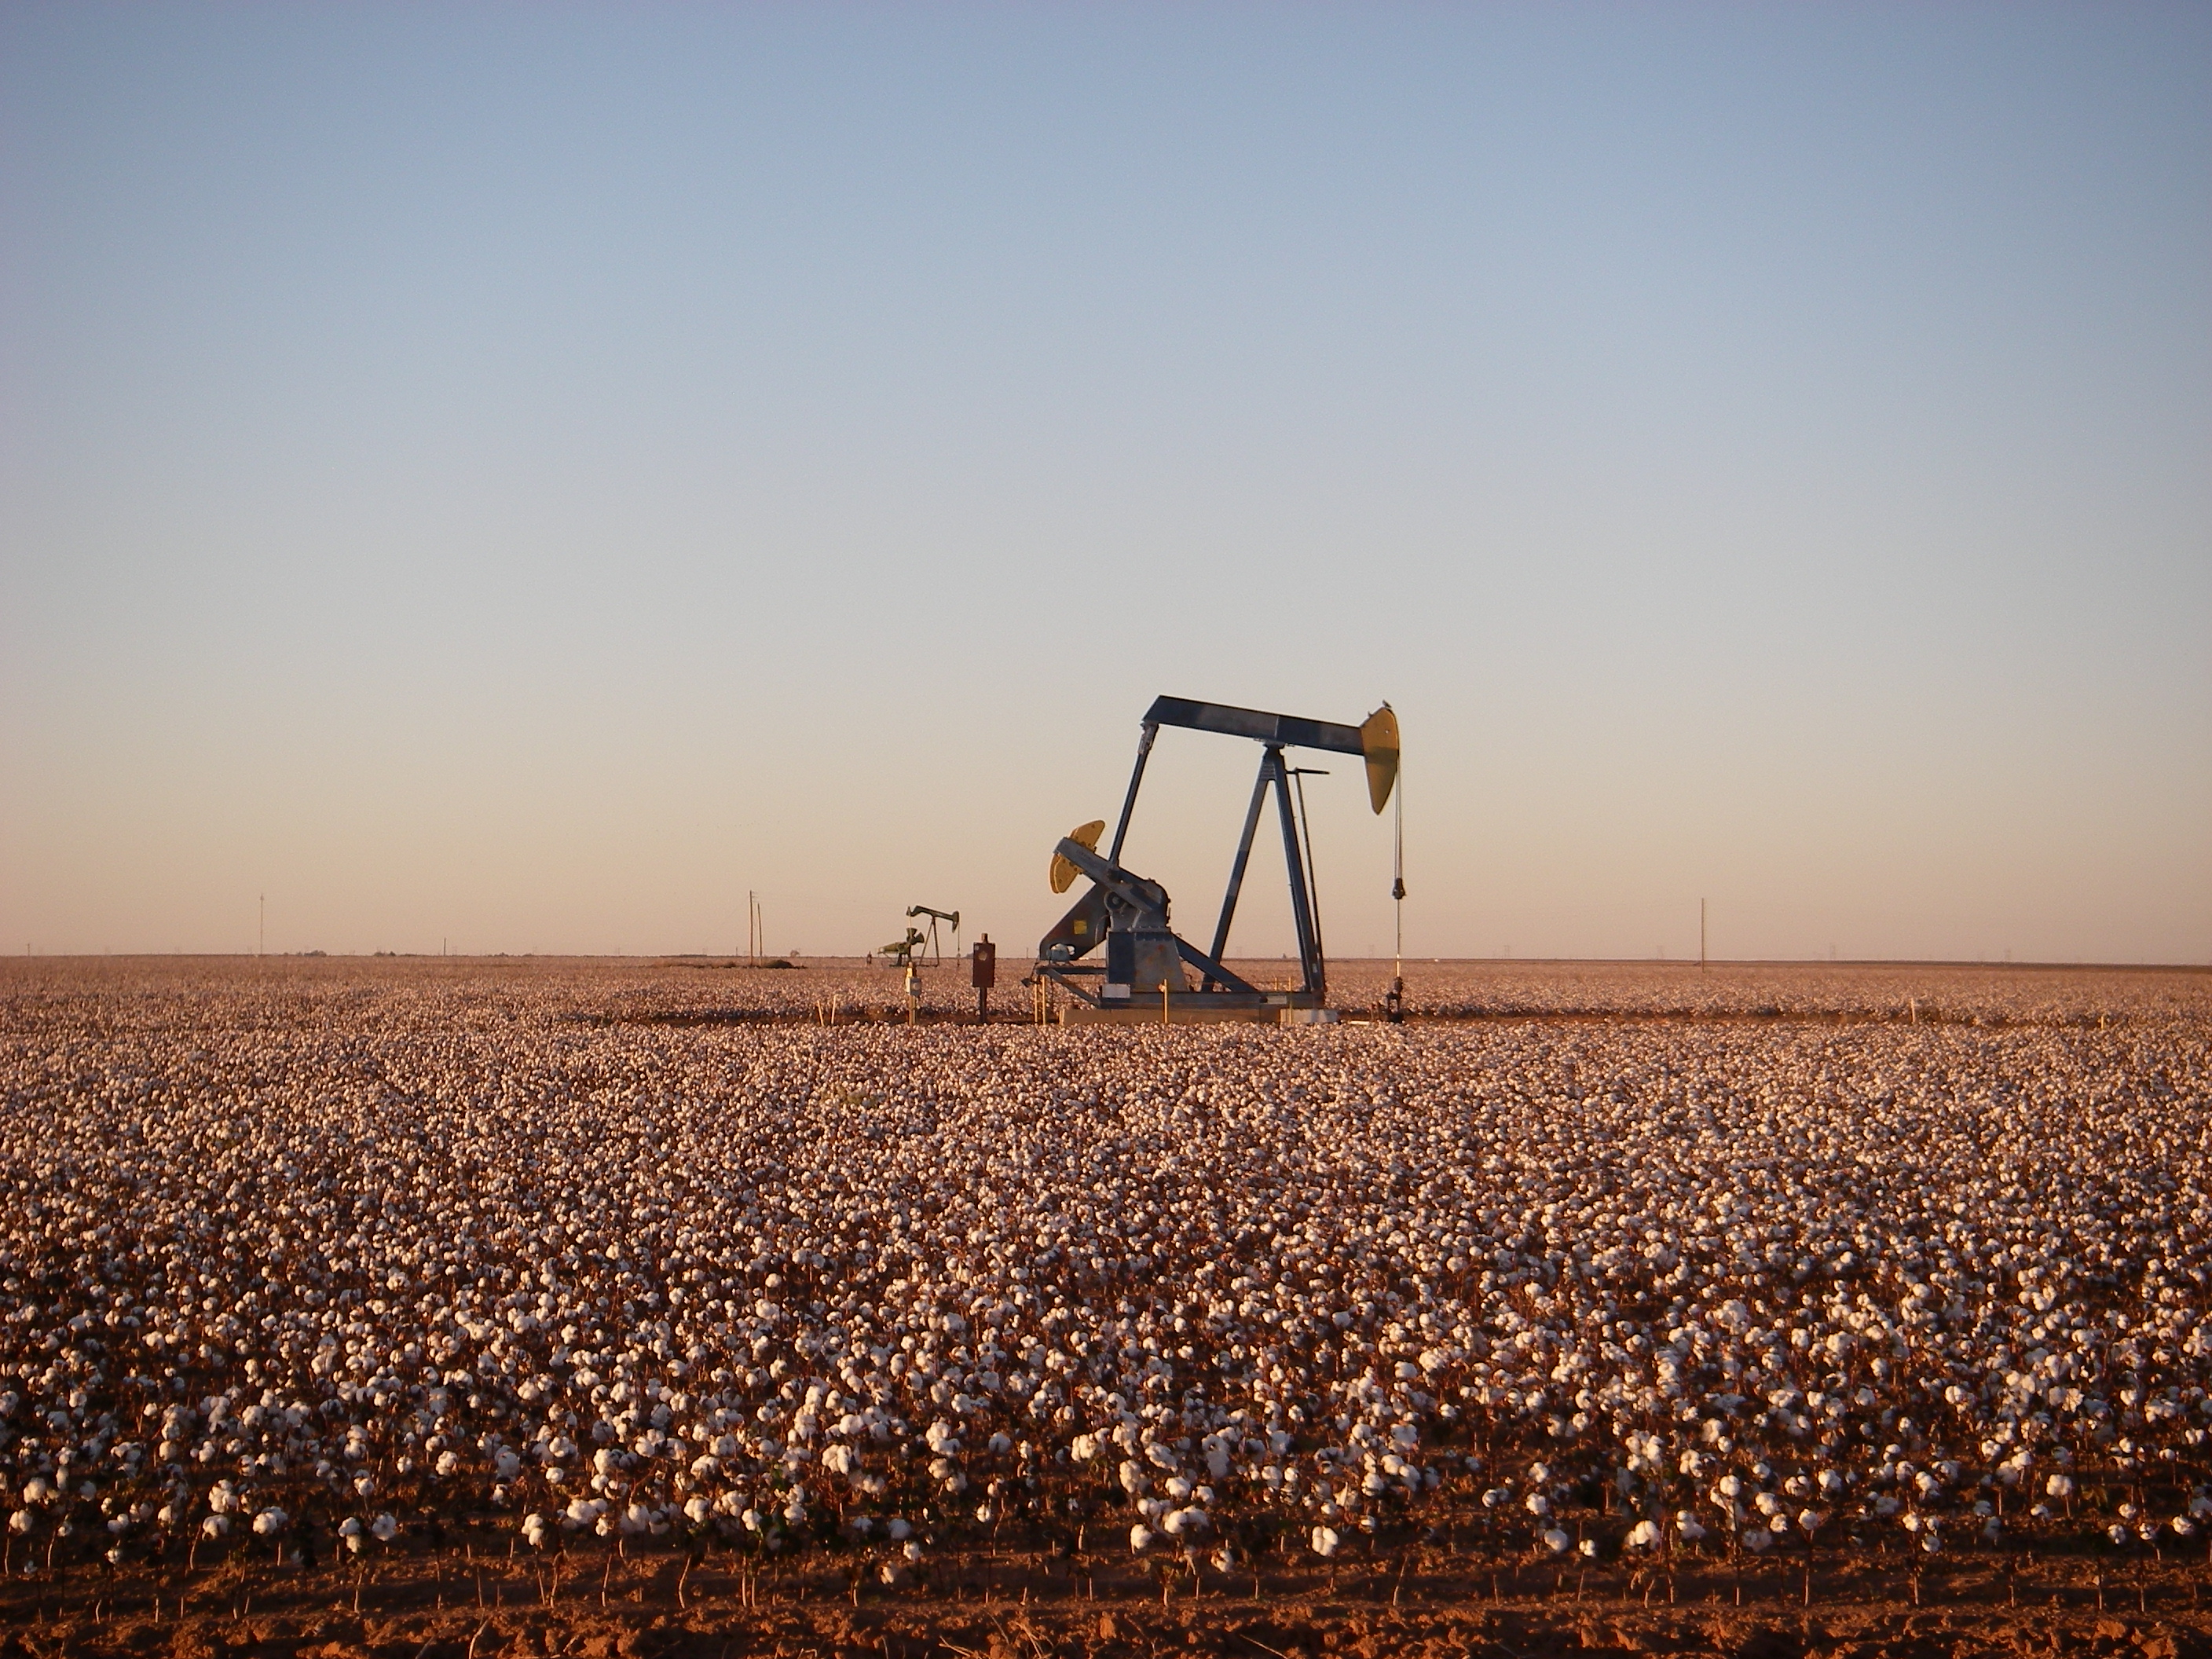
An oil pumpjack east of Andrews, Texas, photographed on 6 November 2009. Shown as an example of oil-production equipment; the photograph does not establish methane emissions from this equipment or a match with a mapped detection.
Zorin09 / Wikimedia Commons · CC BY 3.0 · Original image, unaltered
What a satellite can find
The CAMS Methane Hotspot Explorer provides expert-checked detections based on TROPOMI, an instrument aboard Europe's Sentinel-5P satellite. Wind information helps estimate the location and rate of a source. Both remain uncertain.[1] Diffuse emissions and cloud-obscured locations do not appear in the same way. A point can guide investigation without identifying an exact facility.[1]Reducing emissions across borders
The Global Methane Pledge, launched at the COP26 climate conference in 2021, connects national efforts around a collective goal: reduce global human-caused methane emissions by at least 30% from 2020 levels by 2030. Countries contribute through voluntary action; it is not a uniform 30% obligation for each country.[5] At company level, UNEP’s Oil and Gas Methane Partnership 2.0 (OGMP 2.0) advances measurement-based emissions accounting and annual reporting. Knowing which equipment emits, and how much, helps direct repairs and improvements.[6] Actions depend on the source: detecting and repairing leaks in oil and gas equipment, managing water in rice cultivation, and separating and treating organic waste.[8] At landfills, pipes can collect methane-containing gas produced by decomposing waste for treatment and energy use.[7] A 2025 UNEP-led report found that global methane emissions were still rising and called for existing measures to be scaled up. Satellite monitoring sits within a longer effort: share a target, measure emissions, act on the ground and check the result.[8]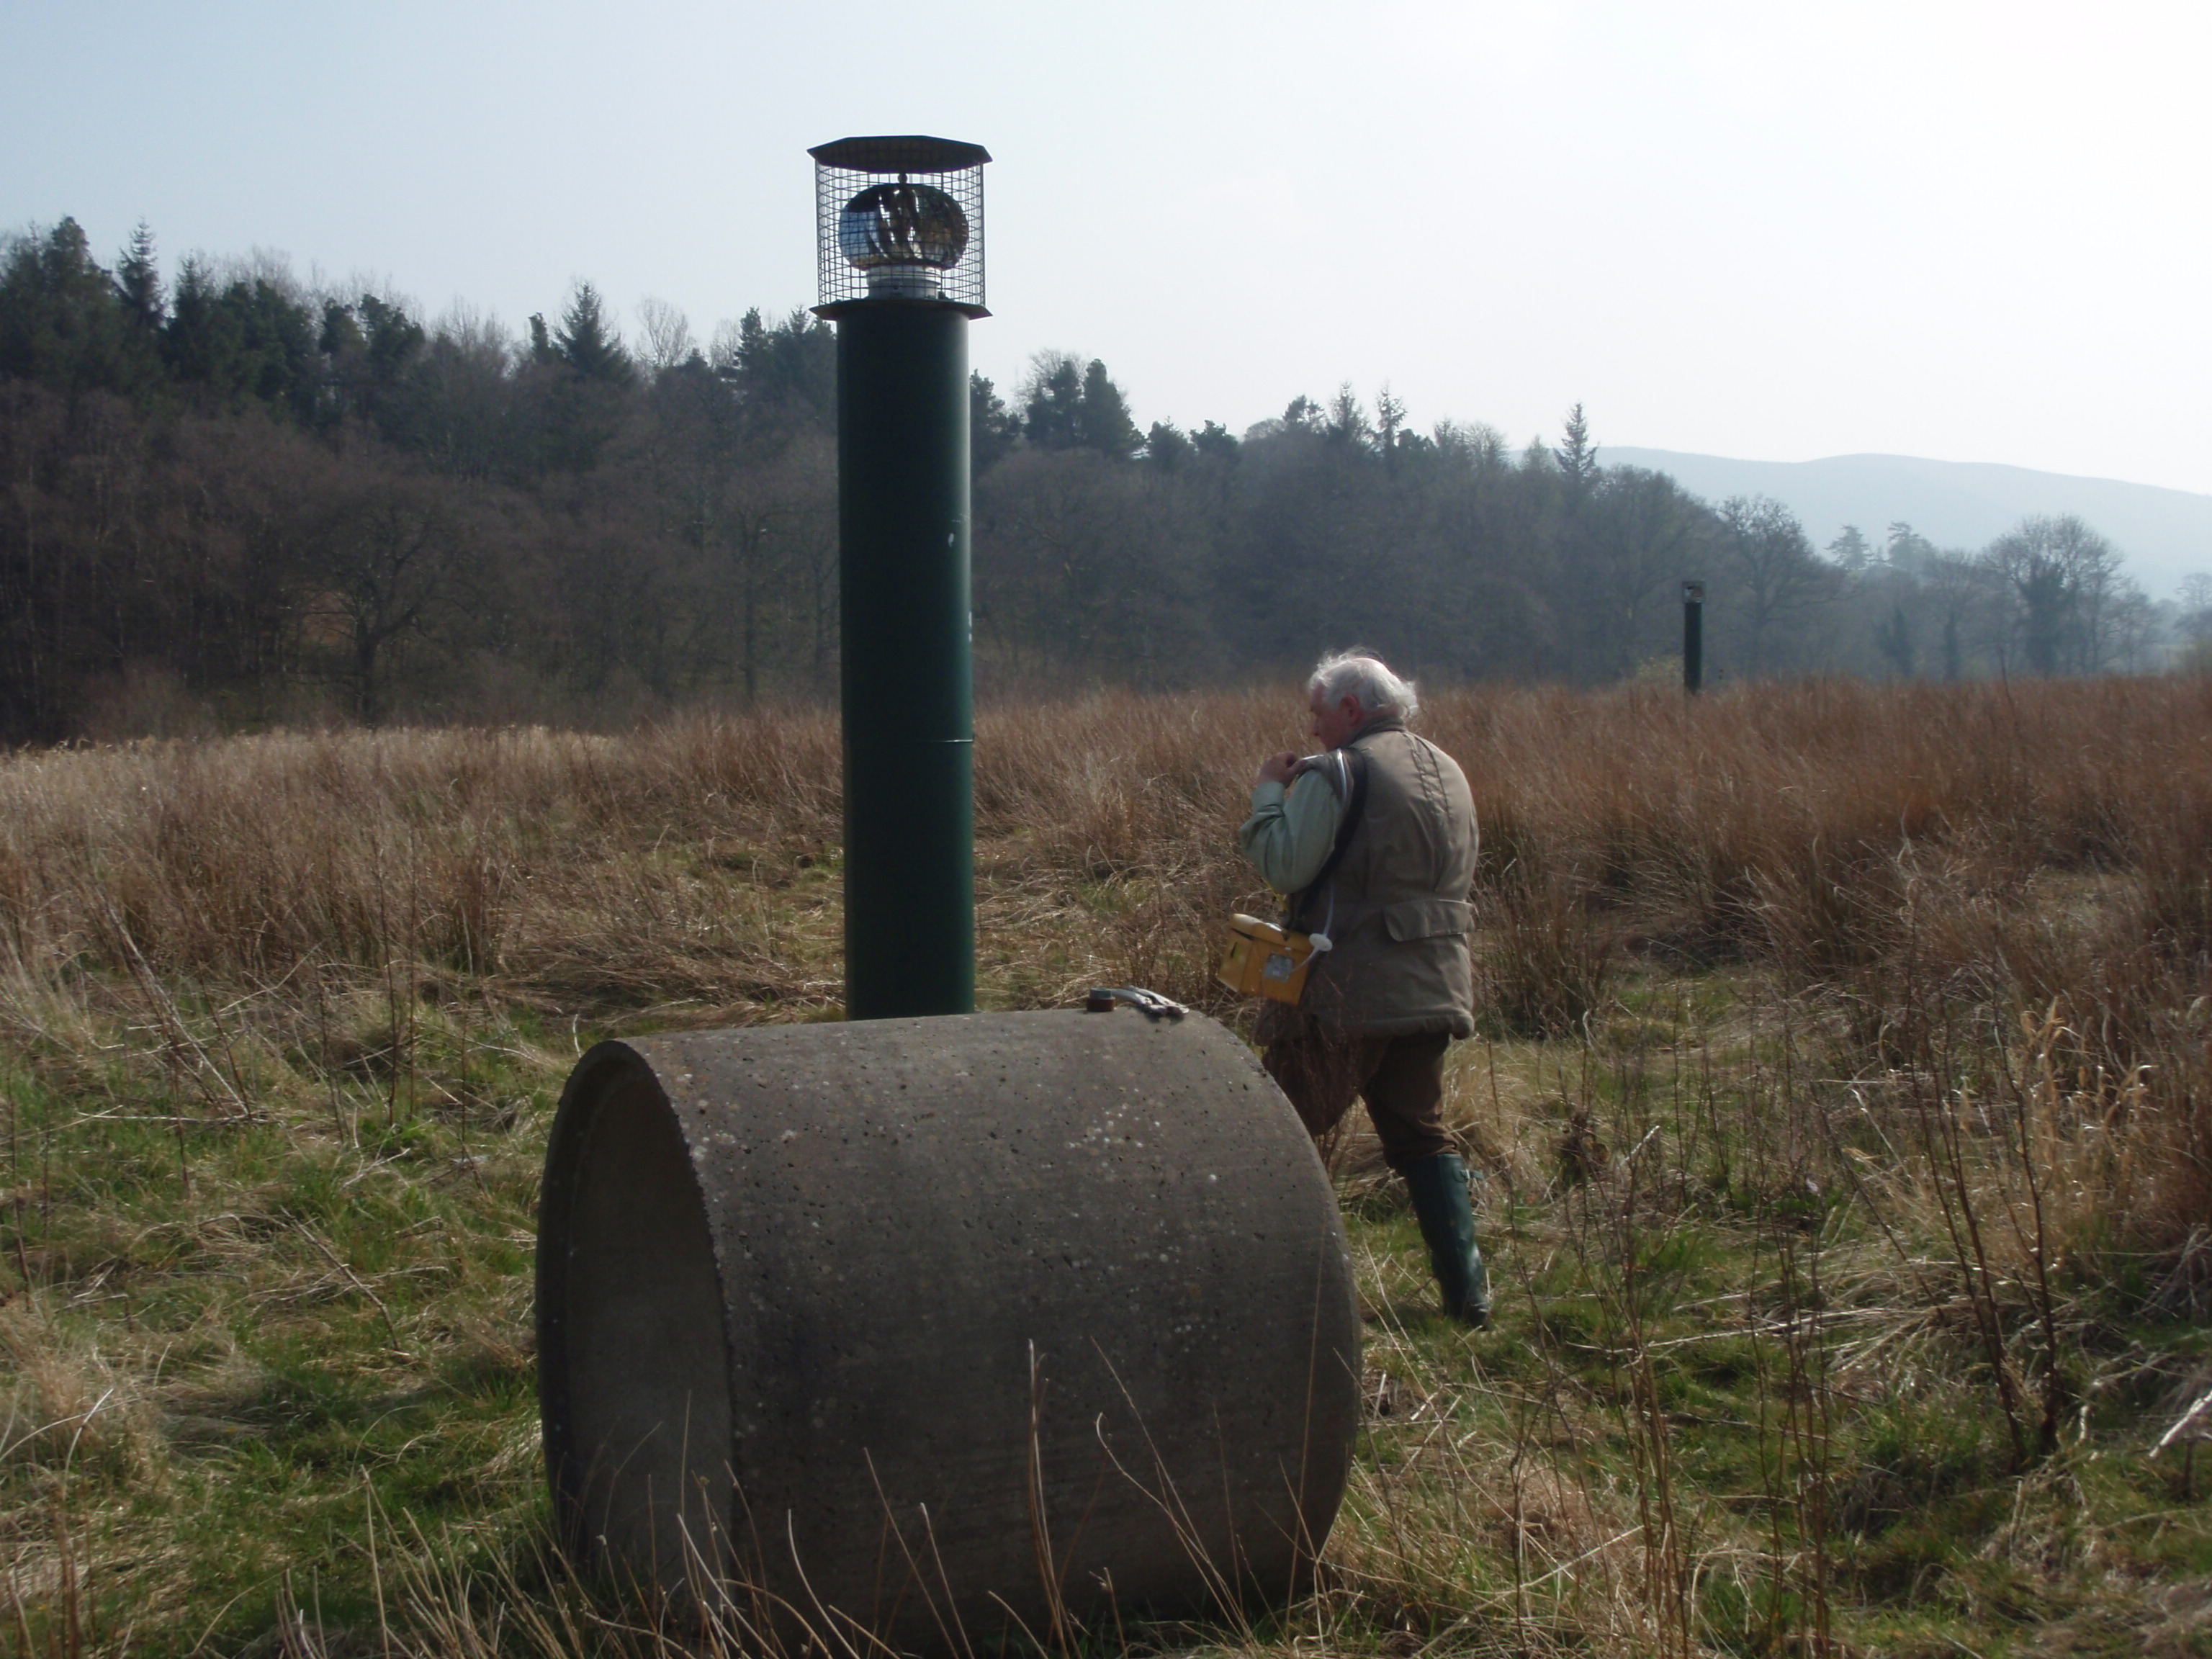
A gas vent at the closed Nantmel landfill in Wales, photographed on 22 April 2008. Decomposing buried organic waste generates methane-containing gas. This illustrates equipment, not an emissions rate, collection efficiency or a match with a mapped detection.
PhilMacD / Wikimedia Commons · CC BY-SA 3.0 · Original image, unaltered
From finding emissions to responding
The United Nations Environment Programme's Methane Alert and Response System, MARS, notifies governments and companies about major emissions detected by satellite. A case published in April 2026 reports confirmed mitigation action at Kalamkas in Kazakhstan in September 2025.[2] This separate UNEP record has not been matched to a particular point here. Finding an emission, establishing its cause and taking action are distinct steps. Following what happens after detection gives the observation a practical consequence.Data / Sources
Interpreting monthly counts: detections depend on emissions, cloud cover and viewing conditions. Detection methods changed in June and September 2026, so differences between monthly counts cannot be read directly as changes in emissions. This map does not represent total global emissions.[1] July 2024 and September 2026 are partial months. Coordinates are estimated source locations. Marker area uses one rate scale across months; adding detection-time rates does not give monthly emitted mass. Cyan #71D9D4 identifies detections. Composited brightness and glow are not measurements. Positions are not interpolated between months.CAMS CSV / 5,094 rows / 27 monthly groups / area = source rate × 0.65 pt² at 100 dpi / core alpha 0.24, outline 0.42, halo 0.035/0.022/0.014.
[1] CAMS / ECMWF · Methane Hotspot Explorer documentation(2026-09-15更新): https://confluence.ecmwf.int/spaces/CKB/pages/505389789/Methane+Hotspot+Explorer+documentation [2] UNEP · MARS confirmed mitigation, Kazakhstan KAZ_S_127(2026-04): https://wedocs.unep.org/items/009fed09-3ba3-4541-b6ac-81cf2560f2b5 [3] UNEP · Facts about methane: https://www.unep.org/ar/node/30810 [4] UNEP · Global Methane Assessment: https://www.unep.org/resources/report/global-methane-assessment-benefits-and-costs-mitigating-methane-emissions [5] UNEP · Global Methane Pledge: https://www.unep.org/topics/energy/methane [6] UNEP · Oil and Gas Methane Partnership 2.0: https://methanedata.unep.org/oil-gas-methane-partnership [7] US EPA · Landfill gas and collection: https://www.epa.gov/lmop/basic-information-about-landfill-gas [8] UNEP · Global Methane Status Report 2025(2025-11-17): https://www.unep.org/news-and-stories/press-release/ministers-urge-decisive-methane-action-global-report-shows-progress
Author
SORAH Editorial
October 4, 2026