From its discovery in 1985 to international controls and today’s observations: two timescales reveal why recovery does not mean the hole has already disappeared.
From its discovery in 1985 to international controls and today’s observations: two timescales reveal why recovery does not mean the hole has already disappeared.
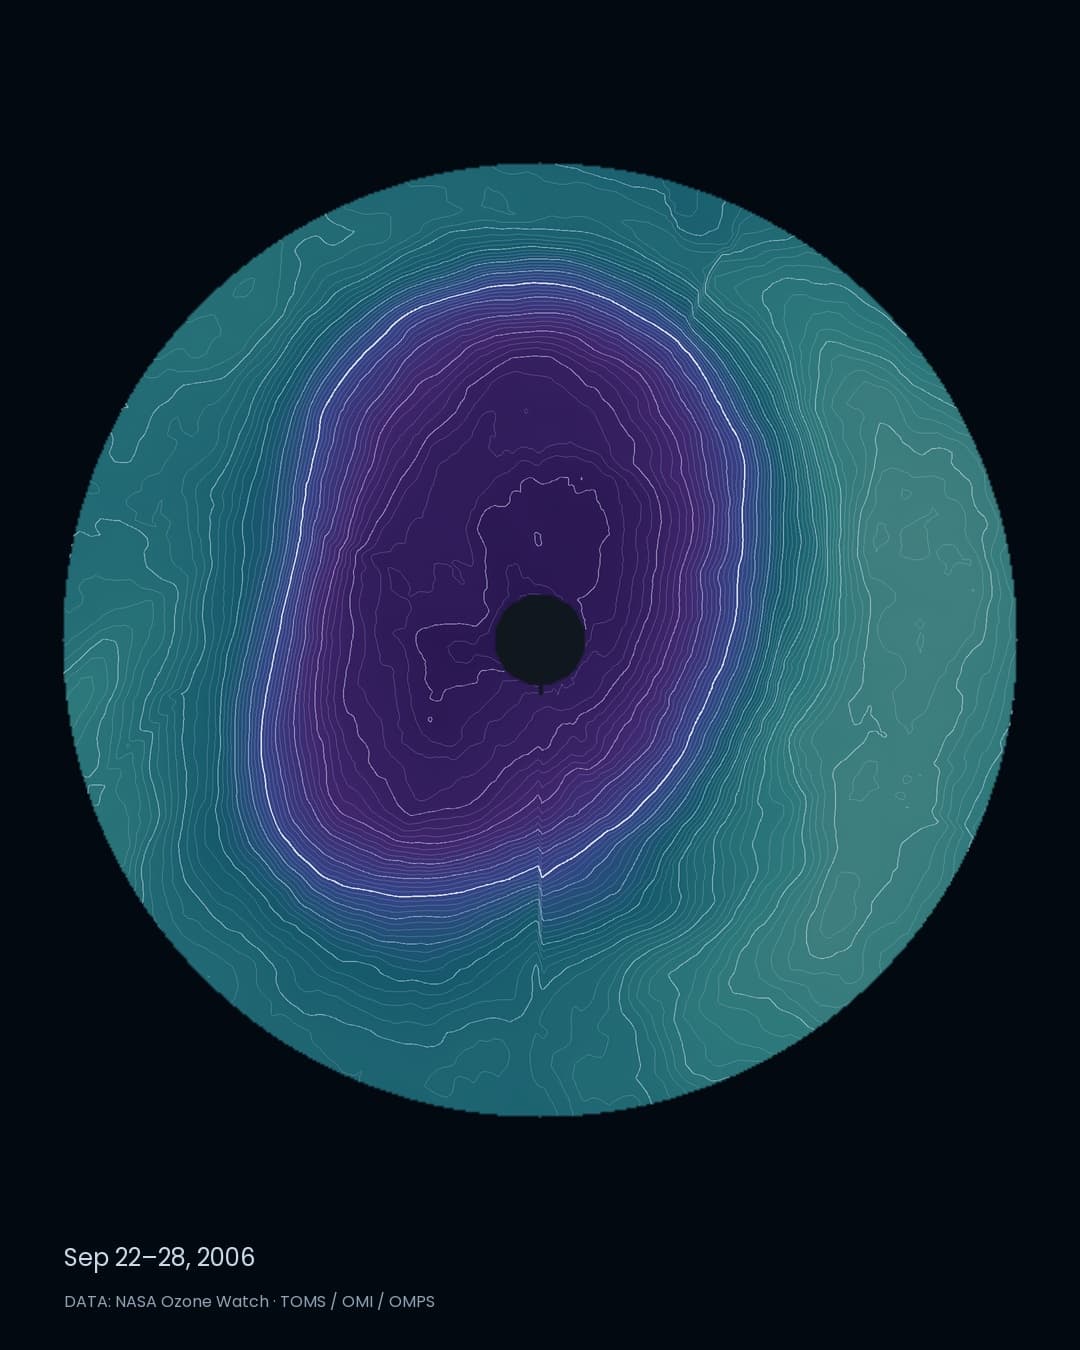
Across the Antarctic sky, violet and blue give way to teal, crossed by fine contours. Color represents satellite-observed total column ozone; each line connects locations with the same amount. As the years advance, the pattern expands, bends and sometimes contracts. Holding the season and scale constant lets us follow a changing atmosphere across decades.[1]
Recovery follows decades of deliberate action. Starting with the 1987 Montreal Protocol, countries restricted the production and consumption of ozone-depleting substances, while industries changed chemicals used in refrigeration, aerosol products and other applications. Yet the Antarctic ozone hole still returns each year. What has that collective effort changed? Separating seasonal fluctuations from changes across decades helps us assess the answer.[5]
![22–28 September composites for six selected years. Each cell averages valid observations; these are neither annual means nor annual-maximum maps. Color: total column ozone. White: 220 DU. Charcoal: missing observations.[1][9]](/images/articles/ozone-hole/02_history_en.jpg)
22–28 September composites for six selected years. Each cell averages valid observations; these are neither annual means nor annual-maximum maps. Color: total column ozone. White: 220 DU. Charcoal: missing observations.[1][9]
1985: a change discovered from the ground
British Antarctic Survey scientists Joe Farman, Brian Gardiner and Jonathan Shanklin reported severe Antarctic ozone depletion in 1985. Persistent ground-based measurements revealed a change that would become a global environmental concern.[4]CFCs and other ozone-depleting chemicals connected familiar products with a distant atmosphere. Long-lived compounds could reach the stratosphere, where chlorine and bromine participate in reactions that destroy ozone.[3]
1987: an agreement, followed by a long response
The Montreal Protocol was adopted in 1987 and entered into force in 1989. It established a framework to phase out ozone-depleting substances, strengthened through later adjustments and amendments.[5]Reducing production did not instantly remove chemicals already in the atmosphere. That delay matters when reading the record: a line that fails to fall immediately after 1987 does not, by itself, show that the agreement failed.[3][8]
![Mean ozone-hole area for 7 September–13 October each year. This statistic differs from the seven-day map composites in the historical film. No data for 1995; the incomplete 2026 season is excluded.[2]](/images/articles/ozone-hole/03_area_en.jpg)
Mean ozone-hole area for 7 September–13 October each year. This statistic differs from the seven-day map composites in the historical film. No data for 1995; the incomplete 2026 season is excluded.[2]
A smaller hole in 2025, within an uneven recovery
NASA and NOAA reported an average ozone-hole area of 18.71 million km² for 7 September–13 October 2025: the fifth smallest since 1992. The hole had not disappeared. The result was one observation within a much longer recovery.[7]WMO’s September 2026 bulletin places recent observations within a long-term recovery while stressing year-to-year variability. Temperature and atmospheric circulation affect each season. Individual large or small years cannot substitute for that longer record.[6]
Note · Comparing like with like The fifth-smallest ranking uses the seasonal mean and years since 1992. It is not a rank of daily maxima or of the entire record since 1979. No final 2026 rank is assigned here.[7]
Why the hole returns in spring
During the Antarctic winter, the polar vortex isolates very cold air. Polar stratospheric clouds provide surfaces for reactions that activate chlorine. Returning sunlight helps drive rapid ozone destruction. As the isolation weakens and surrounding air mixes in, the seasonal process changes.[3]The 2026 film uses observations from 1–25 September. A three-day mean advances one day at a time, revealing changes in the spatial pattern. These 25 days cannot establish the outcome of the full season, much less the course of recovery over decades.[1]
![Mean of valid observations, 23–25 September 2026. The white contour marks 220 DU; finer contours are spaced by 5 DU. Charcoal areas are missing observations, not zero ozone.[1][9]](/images/articles/ozone-hole/04_key_en.jpg)
Mean of valid observations, 23–25 September 2026. The white contour marks 220 DU; finer contours are spaced by 5 DU. Charcoal areas are missing observations, not zero ozone.[1][9]
Note · Reading the field Color and contours encode total column ozone in Dobson Units, not height, temperature or the altitude of the ozone layer. The fixed Antarctic projection shows latitudes south of 45°S. Transitions are editorial crossfades, not fluid simulations or additional observations.
What supports recovery—and what can enlarge the hole again
The evidence for recovery extends beyond individual small-hole years. A 2025 study compared satellite observations since 2005 with models and detected a pattern across months and altitudes consistent with declining ozone-depleting substances. Its attribution analysis separated that response from internal climate variability, strengthening the evidence that international controls are beginning to restore Antarctic ozone.[11]Temperature and the polar vortex also shape each season. Persistent cold, isolated air sustains conditions for ozone destruction; a warmer, weaker vortex can limit it. NASA and NOAA identified the unusually weak vortex in August 2025 as one contributor to that year’s smaller hole. Weather can amplify or soften the annual outcome within a longer recovery.[3][7]
Past emissions remain part of the atmosphere. Long-lived ozone-depleting chemicals persist, and older products such as insulating foams still release them. Controls reduce the continuing burden, but do not erase it at once. When cold and circulation conditions align, substantial seasonal depletion can still occur.[3][7]
Wildfire smoke reaching the stratosphere can add another disturbance. A 2023 study comparing observations and models after Australia’s major fires found that reactions on smoke particles activated chlorine and contributed to an increase in the 2020 Antarctic ozone-hole area. The mechanism did not, on its own, explain the hole’s exceptionally long duration. It nevertheless connects fires on the ground with chemical changes far above it.[12]
Note · Separating volcanic influences Water vapor injected by the 2022 Hunga Tonga eruption was initially proposed as a contributor to 2023 depletion. Later research summarized by NASA found that the excess water vapor had little overall effect on that year’s Antarctic ozone hole. The eruption should not be presented as an established single cause of renewed expansion.[13][14]
Against these fluctuations, the 2022 WMO–UNEP assessment projects Antarctic ozone returning to 1980 levels around 2066 if current policies continue. Recovery does not require every successive hole to be smaller. Decades of chemical change and individual seasons affected by cold, circulation or smoke appear together in the same Antarctic sky.[8][11][12]
Note · Data cutoff Retrieved on 28 September 2026. The latest observation in the seasonal film is 25 September. The complete 2026 seasonal mean and final ranking are not yet established.
About the data
NASA Level 3 total column ozone is projected to EPSG:3031 south of 45°S using the Data Scape projection formula. Zero-coded values remain missing; no model-based gap filling is applied. Historical maps average 22–28 September with at least three valid daily values per cell. Four daily files were available for 1993 and 2008, seven for other years; 1995 is missing. Seasonal maps average the preceding three days with at least one valid value per cell. Projection, scale and color mapping are fixed. The area chart uses published NASA statistics rather than areas inferred from the films. Color uses a fixed continuous scale from 100 to 550 DU; contours are drawn every 5 DU, with the 220 DU boundary highlighted in white.Sources
- NASA Ozone Watch — total-column ozone, Level 3 grids
- NASA Ozone Watch — annual ozone-hole statistics
- NASA Ozone Watch — What is the Ozone Hole?
- British Antarctic Survey — The ozone hole discovery
- UNEP Ozone Secretariat — The Montreal Protocol
- WMO — successes and challenges in ozone layer recovery, 16 September 2026
- NASA / NOAA — 2025 ozone hole: fifth smallest since 1992
- WMO / UNEP — Scientific Assessment of Ozone Depletion 2022
- NASA Ozone Watch — grid format, missing observations and assimilation
- SORAH Data Scape / SORAH Design System
- Wang et al. — Fingerprinting the recovery of Antarctic ozone, Nature (2025)
- Solomon et al. — Chlorine activation and enhanced ozone depletion induced by wildfire aerosol, Nature (2023)
- NASA — 2023 Ozone Hole Ranks 16th Largest (2023 assessment)
- NASA — Summary of the 2024 Quadrennial Ozone Symposium (subsequent assessment of Hunga water vapor)
- SORAH Data Scape — Ozone / オゾンのインタラクティブビュー
Author
SORAH Editorial
September 28, 2026