From the global ocean to groundwater, flood barriers and roads: three cities make a changing sea tangible.
What does a rising sea change in a city? In Miami Beach, one answer is where residents park. The city offers a flood-relief parking programme for eligible residents during king tides and other weather events. The height of the ocean has become part of an everyday decision.[27]
On a world map, a coastline is a thin line. On the ground, it is a place of homes, roads, ports and people moving between them. A change measured offshore becomes a different kind of problem when it meets those places.
These four maps move from the global ocean into Jakarta, Venice and Miami Beach. Each brings a different part of coastal life into view: the ground beneath a city, the barriers that protect it, and the streets people need to use.
The sea is not rising at the same rate everywhere
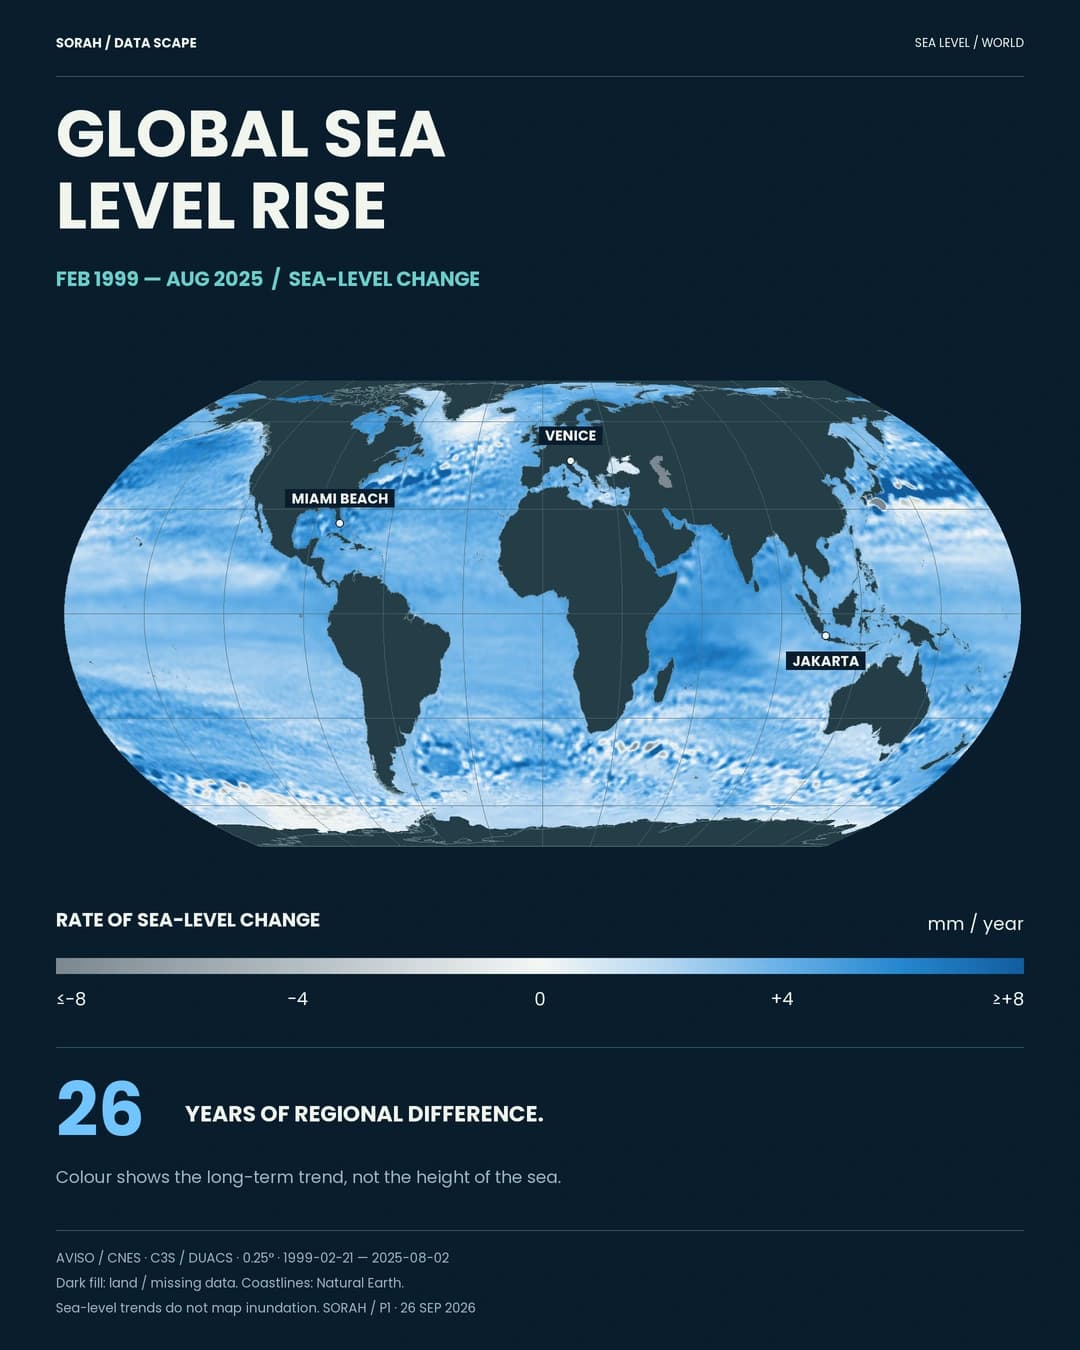
![Sea-level trend, 21 February 1999–2 August 2025. Greenwich-centred Equal Earth projection. Units: mm/year.[1][2] Rise is white-to-blue; decline is grey.](/images/articles/sea-level/01_global_en.webp)
Sea-level trends, 21 February 1999–2 August 2025, in mm/year. White to blue shows rising sea level; grey shows falling sea level.[1][2]
The shades of blue on the global map are not water depths. They show rates of sea-level change between February 1999 and August 2025. White to blue marks rising water levels; grey marks falling levels. Across roughly 26 years of observations, a regional pattern emerges.[1][2]
Heat, currents and winds help explain why the pattern is uneven. Warm water expands, while circulation redistributes water and heat around the ocean. A connected ocean does not give every coastline an identical change in height.[28]
The satellite view reveals those differences. To understand what they mean for a city, we also need to look at the land. Jakarta is a useful place to begin.
Note · What is measured The colours show a trend over roughly 26 years, not flood depth on land. City markers locate the examples. Dark areas represent land or missing data.[2]
Jakarta — When the water rises and the ground moves
![North Jakarta: streets, waterways and modelled low terrain. Blue marks terrain at/below mean sea level; grey marks 0–2 m. Below: annual offshore Java Sea levels, relative to the 1995–2004 average. 2021: +11.4 cm. Incomplete year(s): 2007.[33][17][19]](/images/articles/sea-level/02_jakarta_en.webp)
North Jakarta: streets, waterways and modelled low terrain. Blue marks terrain at/below mean sea level; grey marks 0–2 m. Below: annual offshore Java Sea levels, relative to the 1995–2004 average. 2021: +11.4 cm. Incomplete year(s): 2007.[33][17][19]
On the North Jakarta map, waterways extend inland from the coast through densely arranged streets and neighbourhoods. Blue identifies modelled terrain at or below mean sea level. The map places everyday urban space close to the height of the surrounding water.[17][19]
The annual offshore Java Sea record shows the sea level rising and falling from one year to the next. Its 2021 mean stood 11.4 cm above the 1995–2004 average. But the sea is only one side of the relationship. NASA identifies groundwater extraction and the subsidence it causes as contributors to Jakarta’s worsening flood problems.[33][5]
For a city, rising water and sinking land both change the relative height of the sea. Water drawn from below ground supports daily life, yet its extraction can affect the ground itself. Decisions about water supply therefore belong in the same conversation as coastal protection.[5]
That wider urban pressure also provides context for the relocation of national government functions to Nusantara, in East Kalimantan on Borneo. In July 2026, the Nusantara Capital Authority reported ongoing construction towards a 2028 political-capital target, including government facilities, roads and water infrastructure.[31]
Building a new capital does not remove Jakarta’s homes, port or waterways. Measuring the offshore sea and understanding changes in the ground and water use remain part of sustaining life in this city.
Note · Two distinct measurements Daily satellite values over 64 grid cells at 106–108°E, 4–6°S are area-weighted across valid cells, then averaged by month and year. Annual means require all 12 months and at least 90% daily coverage in each month; 2007 is left missing. This consistent CMEMS DUACS processing release has complete years through 2021; later years are not extrapolated. This is neither a city tide-gauge record nor a subsidence measurement.[33]
Venice — Keeping a city open to everyday life
![Actual urban geometry and annual mean sea level at Punta della Salute. The 2025 mean was 11.6 cm above the 1995–2004 average.[9][10][17] Blue: modelled land ≤0 m MSL; grey: 0–2 m; white: >2 m. Not predicted inundation.[19][20]](/images/articles/sea-level/03_venice_en.webp)
Venice’s streets, canals and modelled low terrain. The chart uses annual mean sea level at Punta della Salute: +11.6 cm in 2025 relative to the 1995–2004 average.[9][10][17][19]
Gondolas, St Mark’s Square and historic buildings lining the canals make Venice one of the world’s best-known destinations. Its origins reach back to the fifth century; by the tenth, it had become a major maritime power. Venice and its Lagoon joined the World Heritage List in 1987.[12][30]
The city’s history was shaped by its relationship with the sea. Today, changing tides affect both the people who come to see that heritage and those who live among it. High water changes access to low squares and walking routes; the municipality explains how tide levels relate to the heights of the streets.[11]
At Punta della Salute, annual mean sea level in 2025 stood 11.6 cm above the station’s 1995–2004 average. The daily tide moves up and down around a background level that is also changing.[9][10]
One response is MOSE, the movable barrier system at the three inlets connecting the lagoon with the Adriatic. Its gates rise to temporarily separate the lagoon from the sea during high-water events, then return to their positions on the seabed as the tide falls.[29]
A city whose history grew from access to the sea now interrupts that connection when necessary. Protecting Venice means caring for internationally recognised heritage and keeping the same spaces usable for residents and visitors.
Note · The record includes the barriers From 2020 onward, the graph uses ISPRA’s parenthesised, observed in-city means, including measurements during MOSE closures. It is distinct from the offshore-adjusted series. The 11.6 cm figure is not flood depth.[9][10]
Miami Beach — Flooding can arrive without rain
![Blue shows NOAA-modelled potential inundation at the minor high-tide flood threshold, combining mean higher high water with a regional flood threshold (FL_SE_HTF_Min_2023). It does not represent every high tide or an observed flood event. Grey shows streets and buildings for context. The +12.4 cm below is the 2025 annual sea-level anomaly at Virginia Key relative to 1995–2004, not flood depth.[13][14][17][23][24]](/images/articles/sea-level/04_miami_en.webp)
Blue shows NOAA’s potential minor high-tide inundation layer, FL_SE_HTF_Min_2023. The chart shows Virginia Key annual mean sea level: +12.4 cm in 2025 relative to 1995–2004.[13][14][23][24]
In Miami Beach, particularly high tides can flood low ground even without rain. The city’s king-tide guidance tells eligible residents how to register for parking relief and warns that flooding can close roads. A tidal forecast can become a decision about a journey or a parked car.[27]
Nearby Virginia Key recorded a 2025 annual mean sea level 12.4 cm above its 1995–2004 average. That longer change sits beneath the shorter rhythm of rising and falling tides. The blue areas on this panel come from NOAA’s model of potential minor high-tide inundation.[13][14][23][24]
Water on a road also depends on drainage. As the city explains, rainwater runs across the surface into grates, through pipes and towards outfalls. Pumps help move it along. A bottleneck—or rainfall that exceeds the system’s capacity—can leave water standing on the surface.[16]
Moving a car during high tides and keeping stormwater pathways clear address different parts of the same practical challenge. Coastal life depends on where water arrives, when it arrives, and how it leaves. A changing mean sea level is one of the conditions behind those decisions.
Note · Reading the tidal map NOAA compares terrain with mean higher high water plus a regional flood threshold. This is a model, not an observed flood or the footprint of every high tide. “2023” identifies the layer, not a flood event. Its blue area is not directly comparable with the terrain classes on the other two city maps.[23][24]
Note · Ocean Drive A 2021 city report describes rainfall flooding linked to clogged stormwater grates between 5th and 12th streets. It is a drainage example, not evidence that tides alone flooded Ocean Drive.[25]
A few centimetres, and the systems of daily life
Jakarta connects water use with the ground beneath the city. Venice connects protection with the operation of gates. Miami Beach connects high tides with roads, parking and drainage.Together, the maps turn a global change into several local questions. What matters is not simply a number of centimetres, but where that change meets the height of the land, the capacity of a drain, the operation of a barrier, or the route someone takes each day.
Return to the world map and the coastlines become thin lines again. Along them are places where people draw water, protect their neighbourhoods and find a way through the streets.
Note · Shared terrain-map conditions The Jakarta and Venice panels use sea-level-referenced DeltaDTM v1.1 at roughly 30 m resolution. Blue marks modelled terrain at or below mean sea level, referenced to 1993–2021 mean dynamic topography. These are not 2025 land surveys or inundation forecasts incorporating defences and drainage. Miami uses a separate high-tide model. An absence of blue does not establish safety.[19][20][21][22][23][24]
Note · Comparing the numbers All three cities show annual levels in centimetres relative to their own 1995–2004 average. Jakarta uses offshore satellite observations; Venice and Virginia Key use coastal tide gauges. Their measurement settings and endpoints differ, so the values do not rank flood risk. Virginia Key requires all 12 months; 2016 remains missing.[33][10][14]
Sources
- AVISO / CNES — Mean Sea Level products and open data
- AVISO — Downloaded global trend grid (1999-02-21 to 2025-08-02)
- Shabrina et al. — Sinking City dataset (CC BY 4.0, released 7 April 2026)
- Shabrina et al. — Data in Brief, methodology and validation (2026)
- NASA — As Jakarta Grows, So Do the Water Issues
- WMO — UN General Assembly adopts declaration on sea level rise (25 September 2026)
- Natural Earth — public-domain cartographic data
- SORAH Design System 1.7.0 / Content patterns
- ISPRA — Annual mean sea level at Venice; 1872–2025 table
- ISPRA — Table 1, annual observations through December 2025
- Comune di Venezia — Tide, daily mobility and acqua alta
- UNESCO — Venice and movable flood barriers
- NOAA CO-OPS — Virginia Key station 8723214
- NOAA CO-OPS — Monthly mean observations, 1994–2025
- City of Miami Beach — King Tide Flood Relief Parking Program
- City of Miami Beach — Extreme rain events, drainage and pumps
- OpenStreetMap contributors — ODbL and attribution
- IOC Sea-level Station Catalog — Jakarta observation metadata
- Seeger & Minderhoud (2026) — DeltaDTM v1.1 referenced to mean sea level
- WUR — Dataset guide, licence and explicit permission for media use
- Seeger & Minderhoud — Sea level much higher than assumed in most coastal hazard assessments (2026)
- Pronk et al. — DeltaDTM: A global coastal digital terrain model (2024)
- NOAA OCM — Minor High Tide Flooding / FL_SE_HTF_Min_2023
- NOAA — Coastal High Tide Flooding Mapping Methodology
- City of Miami Beach — Flooding from Stormwater Grates, 29 April 2021
- NOAA — Virginia Key 8723214 tidal datums / epoch 1983–2001
- City of Miami Beach — King Tides
- NASA / NCAR — Why regional sea-level trends differ
- Consorzio Venezia Nuova — MOSE location and operation
- UNESCO World Heritage Centre — Venice and its Lagoon; history and 1987 inscription
- Nusantara Capital Authority — Phase II construction and 2028 political-capital target (15 July 2026)
- Indonesia Cabinet Secretariat — Relocation, Java concentration and Jakarta urban pressures (3 October 2023)
- NOAA AOML ERDDAP / CMEMS DUACS — Daily sea-level anomaly, delayed-time vDec2021 (1995–2021 annual subsets)
Author
SORAH Editorial
September 26, 2026