How does ocean heat feed a vast rotating storm? Thirty years of records connect storm formation, seasonal geography and the names typhoon, hurricane and cyclone.
How does ocean heat feed a vast rotating storm? Thirty years of records connect storm formation, seasonal geography and the names typhoon, hurricane and cyclone.
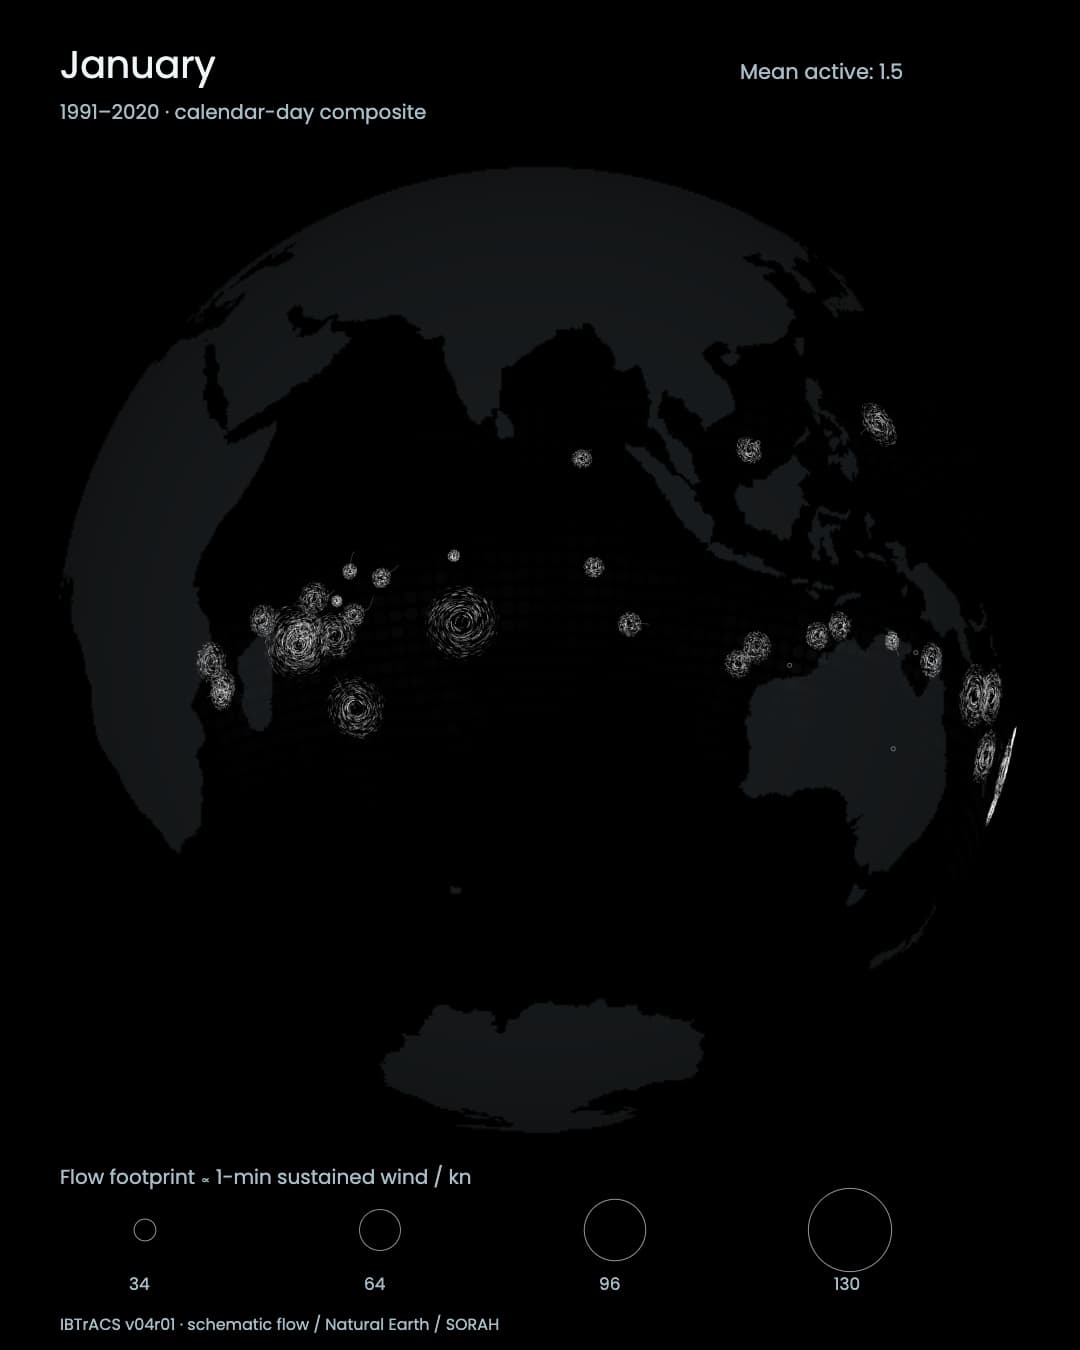
White vortices appear over the ocean, move and change size as the globe turns. January draws attention to the Southern Hemisphere; later months bring the North Pacific and Atlantic into view. The film aligns tropical-cyclone records from 1991–2020 by calendar day to explore how activity shifts with the seasons.[1]
Japan hears about typhoons, the Atlantic about hurricanes, and the Indian Ocean about cyclones. Seeing them together reveals the shared physical processes behind these regional names.
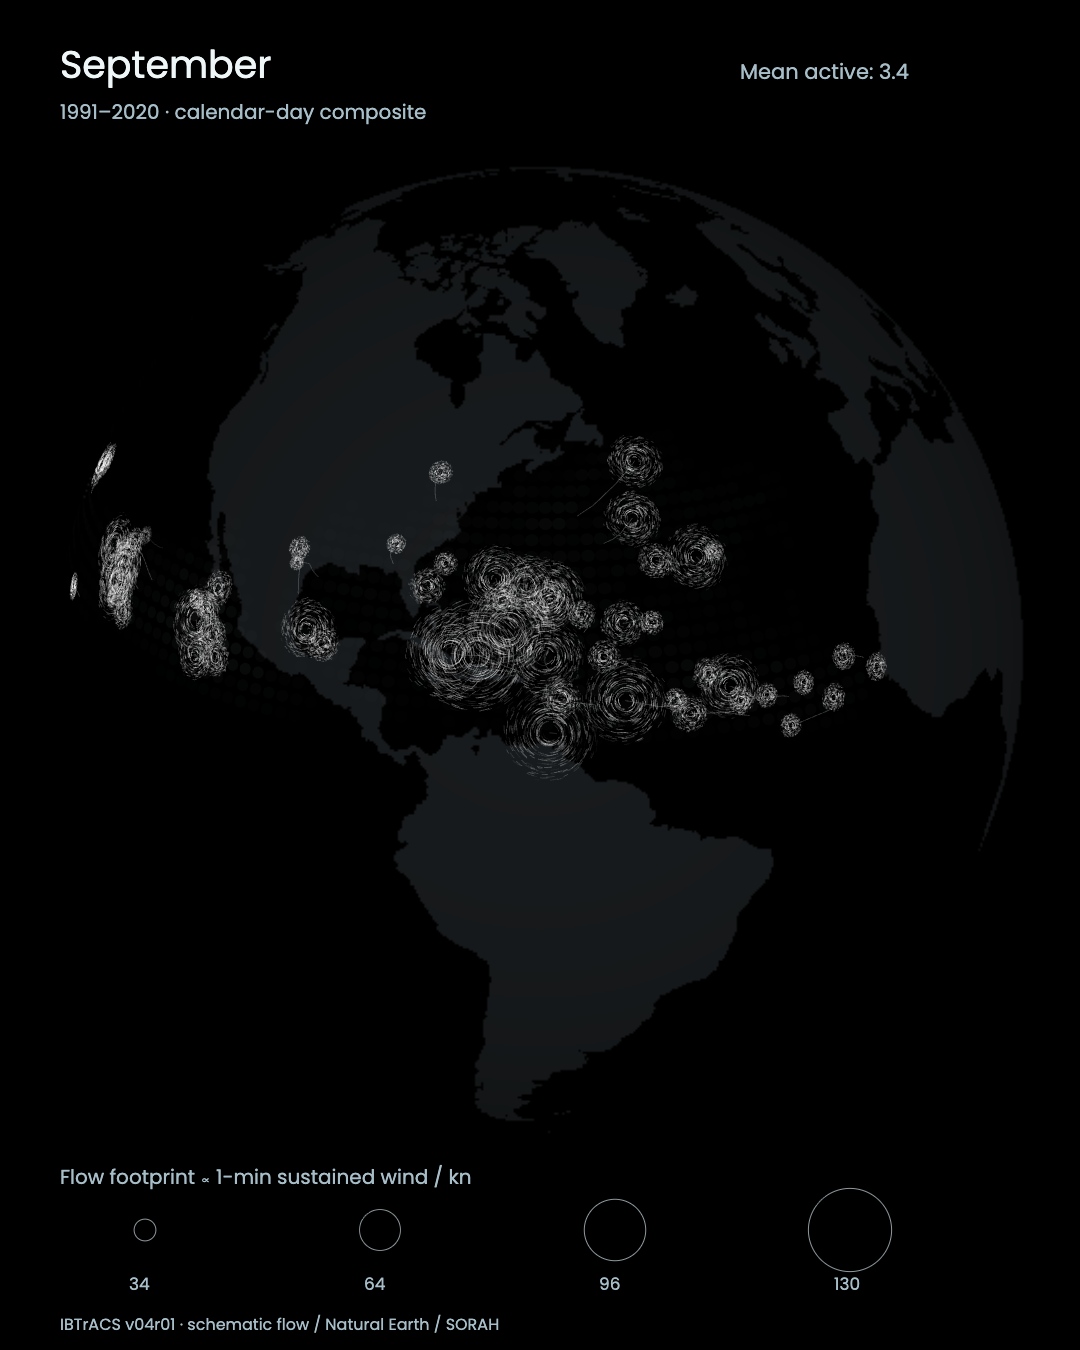
A September frame from the 1991–2020 calendar-day composite. Positions and intensity follow the records; white flow streaks are schematic. Storms from different years are shown together.[1][2][3]
Warm ocean water and the energy carried by moisture
A tropical cyclone begins with an atmospheric disturbance, such as a low-pressure area or a cluster of thunderstorms. Warm, moist air rises above the ocean. As it cools, water vapour condenses into cloud droplets, releasing heat that helps power the developing storm. Continued ascent near the centre draws in more moist air, allowing the circulation and cloud system to organize.[6][7]Warm water alone is not enough. An initial disturbance, sufficient moisture, thunderstorms and relatively small changes in wind with height all matter. Those vertical changes in wind are called wind shear. Strong shear can tilt and disrupt the circulation, making it harder to concentrate heat and moisture near its centre. Development depends on ocean and atmospheric conditions coming together.[6]
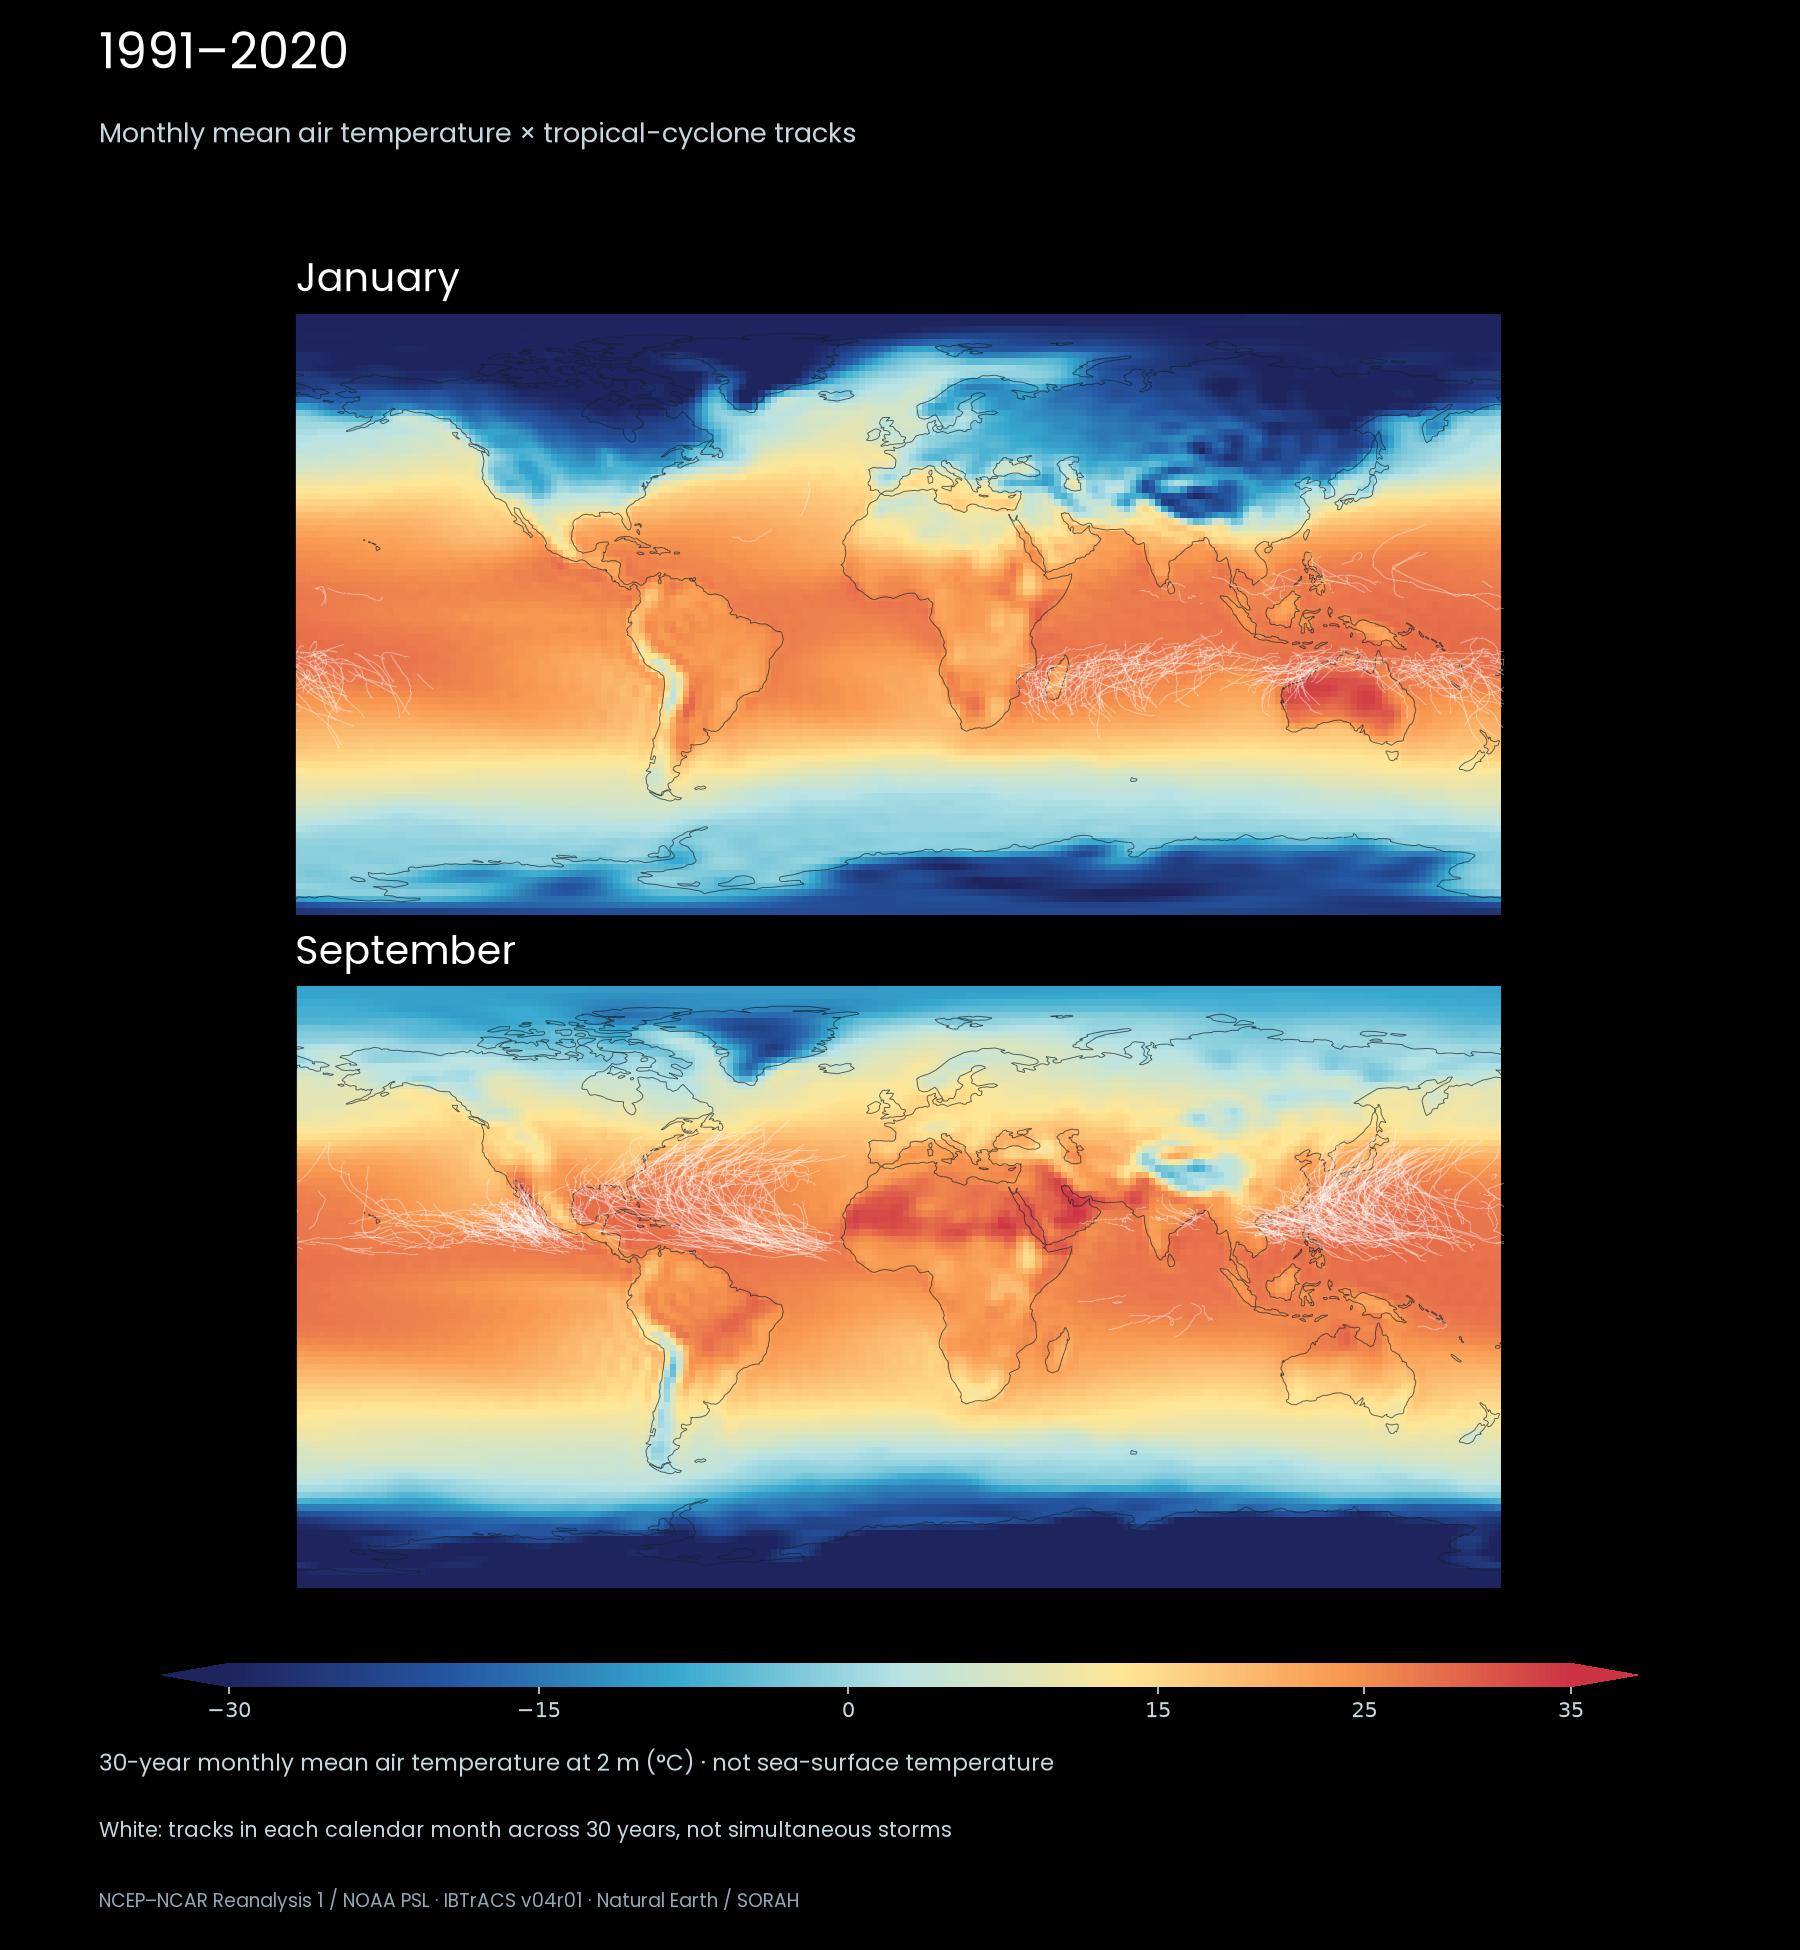
Monthly mean air temperature for 1991–2020, overlaid with storm tracks from the same calendar month across those 30 years. White lines are not simultaneous storms. Temperature is air at 2 m, not sea-surface temperature.[1][2][12]
Comparing January with September places the seasonal movement of warmth beside the changing geography of storm activity. Tracks do not cover every warm region. Air temperature provides seasonal context; it does not measure ocean heat content or wind shear, or explain storm formation on its own.[6][12]
Why the direction of rotation changes across the equator
Air flowing towards the centre is deflected by the Coriolis effect associated with Earth’s rotation. Near the surface, tropical-cyclone winds spiral inward counterclockwise in the Northern Hemisphere and clockwise in the Southern Hemisphere. The effect is weak close to the equator, so tropical cyclones generally form some distance away from it.[5]That is why the white streaks rotate in opposite directions in the two hemispheres. The locations and changes in intensity follow recorded storm centres and maximum winds. The individual moving streaks are a schematic representation of circulation, rather than measured wind vectors.
Typhoon, hurricane or cyclone?
The broad category is the tropical cyclone. Regional names differ, as do the intensity thresholds used to classify a storm. In everyday Japanese weather reporting, “tropical depression” often suggests the weaker stage before a typhoon, whereas the broader scientific category includes hurricanes and typhoons.[7][8]In Japan, a typhoon is a tropical cyclone in the western North Pacific or South China Sea with maximum ten-minute mean winds of approximately 17 m/s or more. This Japanese classification should not be treated as identical to the English-language typhoon threshold.[7][8]
Hurricane is the term used for sufficiently intense tropical cyclones in the North Atlantic and the eastern and central North Pacific. The threshold is approximately 33 m/s, so it does not match the Japanese threshold for a typhoon.[8][9]
Cyclone is commonly used for tropical cyclones in the Indian Ocean and South Pacific, with detailed intensity categories defined by the relevant meteorological agencies. The word “cyclone” can also refer more broadly to a low-pressure circulation. These names describe related phenomena through regional naming and classification conventions.[8][9]
Note · Names, winds and symbol size The visualization uses IBTrACS USA_WIND: one-minute maximum sustained wind in knots. This differs from the ten-minute averaging used in Japan. Vortex diameter is a symbol for intensity, not a measurement of the actual storm’s wind-field radius.[3][7][8]
A storm season is also an ocean and atmosphere season
The distribution of warm water and the pattern of winds aloft change through the year. In the Atlantic, late summer and early autumn tend to bring together a well-warmed ocean and atmospheric conditions favourable to development. The Southern Hemisphere has the opposite seasonal cycle. Following activity around the globe also means following the seasonal environments that support it.[11]An individual storm has a life cycle too. It can intensify while supplied with moisture over warm water, then weaken as it moves over cooler water or land. Some storms transition into extratropical cyclones, which draw energy from contrasts between warm and cold air. A change of classification does not mean that dangerous wind and rain have ended.[8][10]
Viewed globally, a typhoon approaching Japan and a hurricane heading towards a distant coastline occupy places within a larger seasonal pattern. Following where and when vortices develop connects familiar local weather to the movement of the ocean and atmosphere.
Note · What the film includes This is a calendar-day composite of IBTrACS tropical-cyclone records from 1991–2020, not a map of every low-pressure system, tornado or thunderstorm. Storms from different years may appear together; they were not necessarily simultaneous. Mean activity is divided by 30 years and smoothed with a 15-day moving average. Positions are interpolated only across observation gaps of six hours or less. The composite alone does not establish recent trends or the causes of individual storms.[1][2][3]
Data Scape
Explore this data in Data ScapeSources
- NOAA NCEI・IBTrACS v04r01
- IBTrACS・1991〜2020年の抽出元(since1980)
- IBTrACS v04r01・列の定義
- Natural Earth・パブリックドメイン地理データ
- NOAA・熱帯低気圧の回転方向とコリオリの力
- NOAA · How do hurricanes form?
- 気象庁 · 台風とは(発達の熱源・日本の定義)
- 気象庁 · 台風について(呼称の違い・温帯低気圧との違い)
- NOAA NESDIS · Hurricanes, Cyclones and Typhoons: What’s in a Name?
- 気象庁 · 台風の一生
- NOAA · 大西洋のハリケーン活動が晩夏に高まる理由
- NOAA PSL · NCEP–NCAR Reanalysis 1 / monthly 2 m air temperature
Author
SORAH Editorial
October 2, 2026