Keep reef locations visible, then overlay accumulated thermal stress during June–August 2026. A view of ocean heat that includes time.
Keep reef locations visible, then overlay accumulated thermal stress during June–August 2026. A view of ocean heat that includes time.
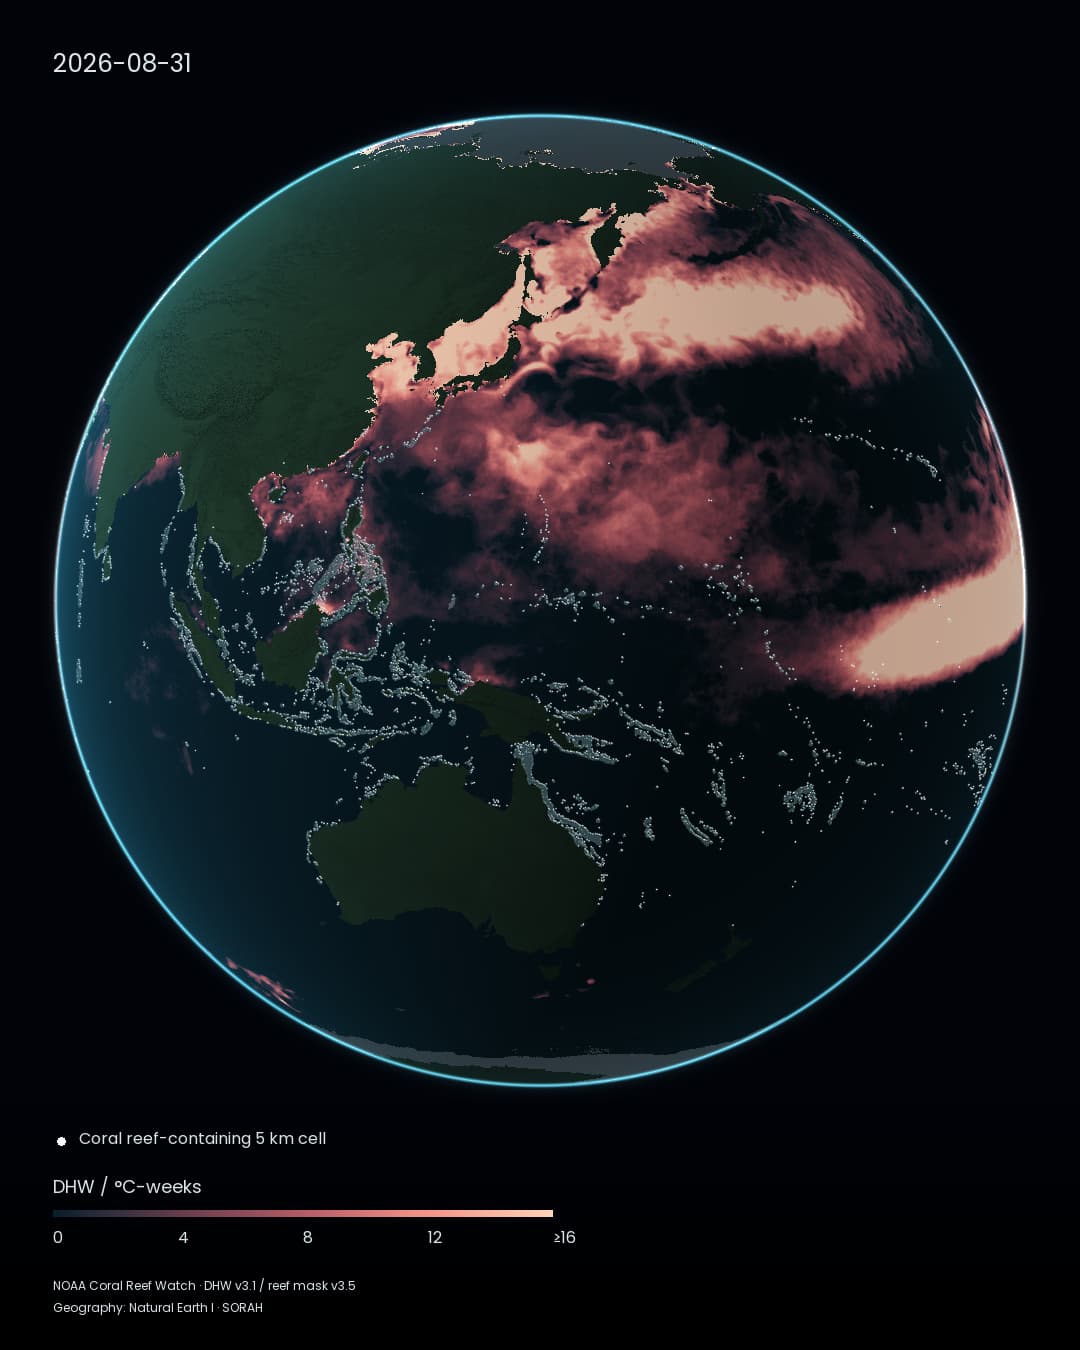
White points trace islands and continental margins. Their positions stay fixed while red tones change across the ocean. The points mark reef-containing cells; the colors show accumulated heat stress. The two layers place the habitat and its thermal exposure in the same view.[1][2]
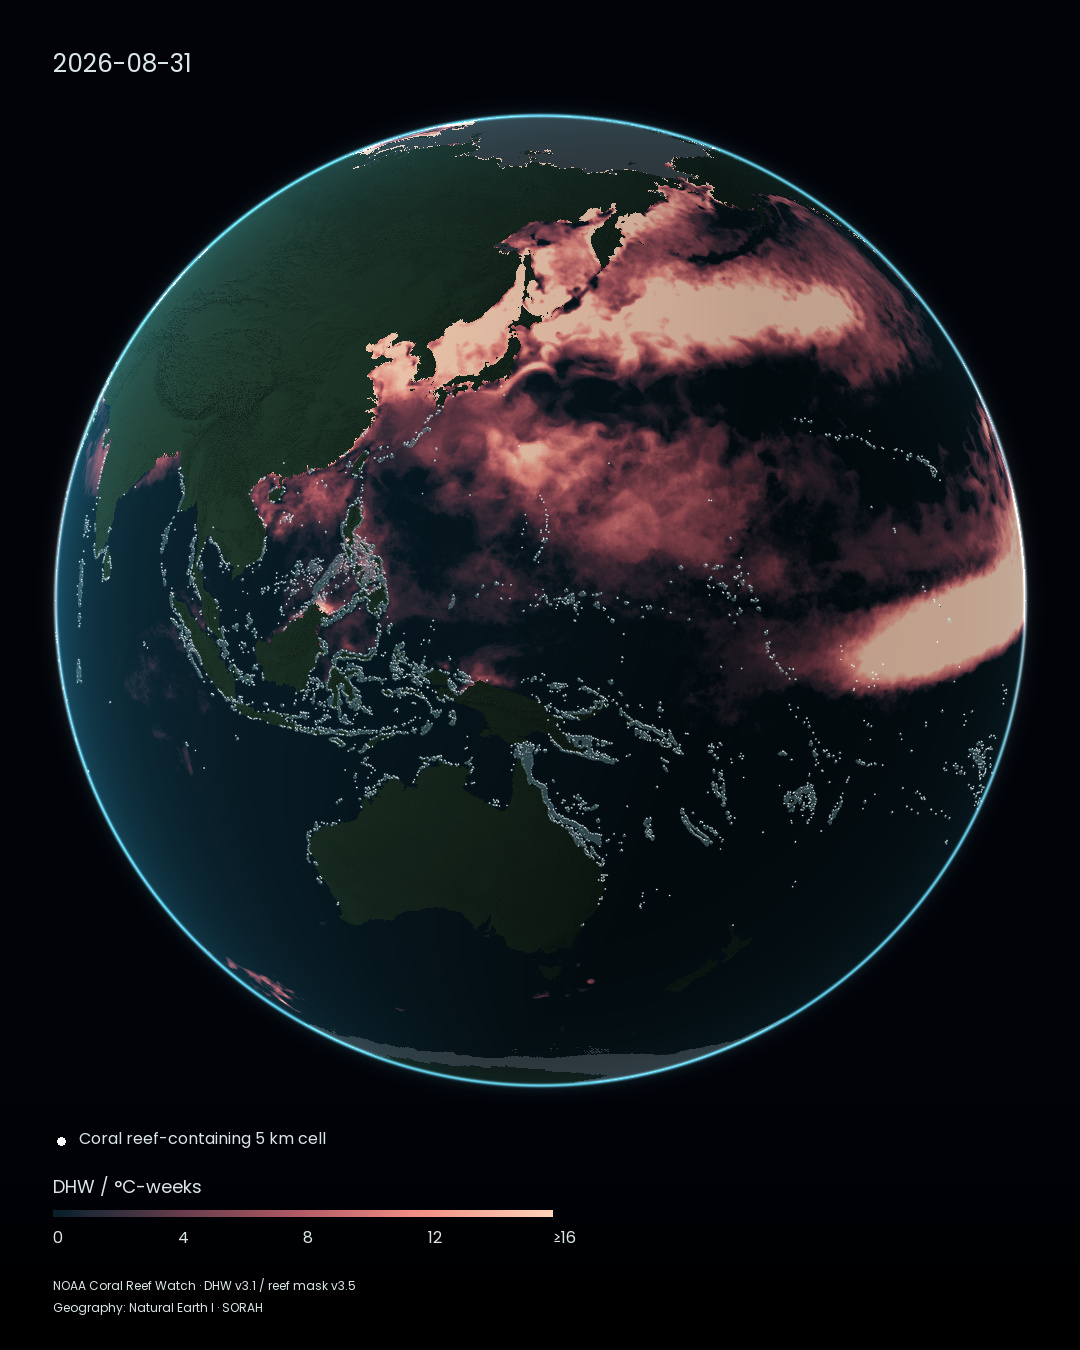
31 August 2026. Pacific–Indian Ocean hemisphere. White points represent reef-containing 5 km cells; red tones represent DHW. Atmospheric lighting is a visual treatment.[1][2][7]
Explore ocean heat in Data Scape
Seven dates take the film from 1 June to 31 August 2026. “Summer” refers to the Northern Hemisphere; these months fall in winter in the Southern Hemisphere. A shared date does not mean a shared season.
Temperature, accumulated through time
NOAA Coral Reef Watch’s Degree Heating Weeks, or DHW, summarizes the preceding 12 weeks. It accumulates temperature anomalies on days at least 1°C warmer than the local climatological maximum monthly mean, expressed in degree-weeks.[1]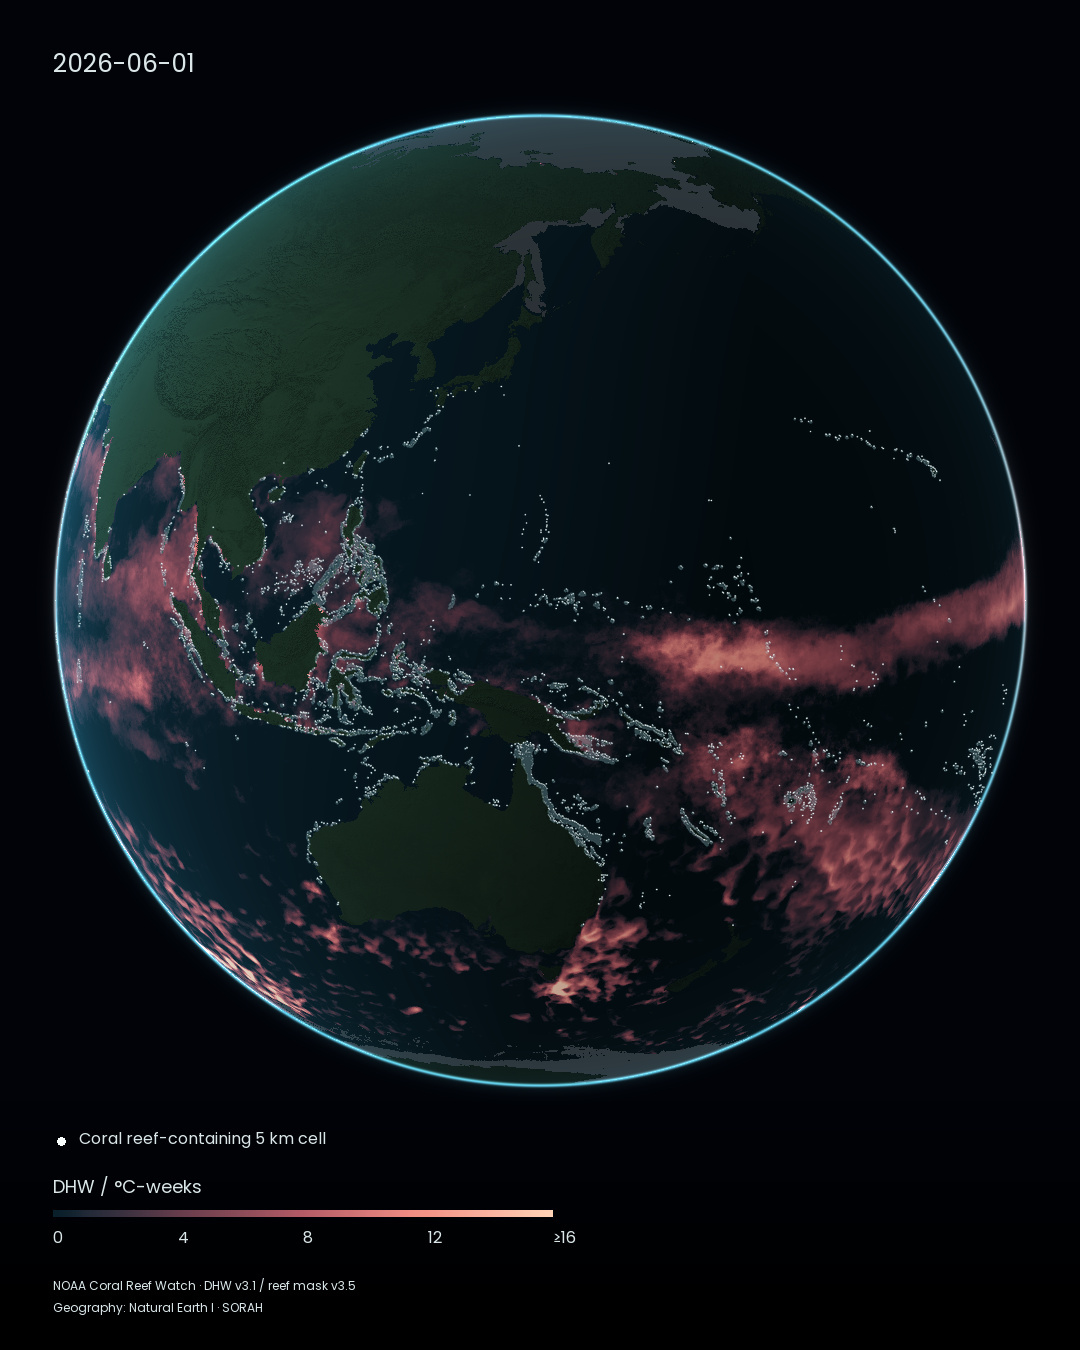
1 June 2026. The viewpoint, reef positions and DHW scale match the August image.[1][3]
DHW can remain elevated after the water cools because earlier heat is still inside that time window. The colors therefore invite a different question from a temperature map: where has thermal stress been accumulating?[1]
White points are not bleached corals
The fixed reef mask contains 57,504 reef-containing cells worldwide. Only those visible from this hemisphere appear here. A point is neither an individual reef nor a measure of its area or health.[2]In actual bleaching, stress can cause corals to lose the symbiotic algae in their tissues. Bleaching does not immediately mean death: corals may recover if conditions improve, while prolonged stress can be fatal.[8]
Overlaying heat and reef locations helps identify places to investigate. It does not establish how the corals responded. That requires looking below the surface, rather than treating every red area as observed damage.
From satellite exposure to reef condition
The Australian Institute of Marine Science’s 2025/26 report supplies a complementary view. Scientists surveyed 121 Great Barrier Reef reefs between August 2025 and June 2026, measuring indicators including the proportion of seabed covered by living hard coral.[5]AIMS describes how effects depend on heat intensity and duration, local conditions and the reefs’ earlier state. Those surveys cover a different interval from this June–August film; they are not a direct assessment of the consequences of the heat shown here. Satellite products and repeated field surveys answer related but distinct questions.[5]
Keep looking after the heat fades
The reef points remain in place at the end. Changing thermal conditions and changing biological condition need not move at the same pace.Rewind the dates, follow the colors, then return to a white point. The satellite indicator helps locate accumulated exposure. Understanding bleaching and recovery means returning to the living reef behind that point, again and again.
Note · Reading the maps and film NOAA CRW DHW v3.1 at 0.05° resolution; fixed reef mask from Thermal History v3.5. Colors saturate at 16°C-weeks. Gray ocean areas mark missing data. A fixed frontal projection shows the visible hemisphere, not the entire world at once. Natural Earth I provides geographic context, not a 2026 satellite photograph. Seven dates are held for 1.8 seconds each and joined by 1.8-second editorial dissolves, totaling 23.4 seconds. Dates disappear during blends, which are not daily observations or measured current movement.[1][2][3][7]
Sources
- NOAA Coral Reef Watch — 5km products and methodology
- NOAA Coral Reef Watch — Thermal History v3.5 / reef mask
- NOAA CRW — direct daily DHW archive
- NOAA CRW — citation and reuse
- AIMS — GBR condition summary 2025/26
- Natural Earth — public-domain geography
- Natural Earth I — land cover and shaded relief
- NOAA Ocean Service — What is coral bleaching?
Author
SORAH Editorial
September 30, 2026