
Published on 28/September/2026 · Climate
Western Australia: seeds waiting for rain, flowers blooming in the desert.
By SORAH Editorial
In the Murchison, seeds wait below dry ground for a flowering season. The landscape’s response in 2026 connects a distinctive place with the water conditions that a warming climate can change.
In the Murchison, seeds wait below dry ground for a flowering season. The landscape’s response in 2026 connects a distinctive place with the water conditions that a warming climate can change.
Wildflowers spread across Western Australia’s Murchison in August 2026. CSIRO linked the display to early winter rain that enabled long-dormant seeds to germinate. Part of the landscape’s response had been waiting below the surface before the rain arrived. [2]
Explore rainfall and vegetation in Data Scape
A dry landscape shaped by rain
Desert here does not mean an uninterrupted field of dunes. The Murchison bioregion has low hills, mesas and broad plains, with vegetation dominated by low mulga woodlands. An Australian government assessment describes an arid climate with predominantly winter rainfall. Sheep and cattle grazing have also shaped this country. [15]On Wajarri Yamaji Country, radio antennas share the landscape with wildflowers. Around CSIRO’s Murchison observatory, the 2026 display included purple mulla mulla. Instruments directed towards space stand above plants responding to water in the ground. [2]
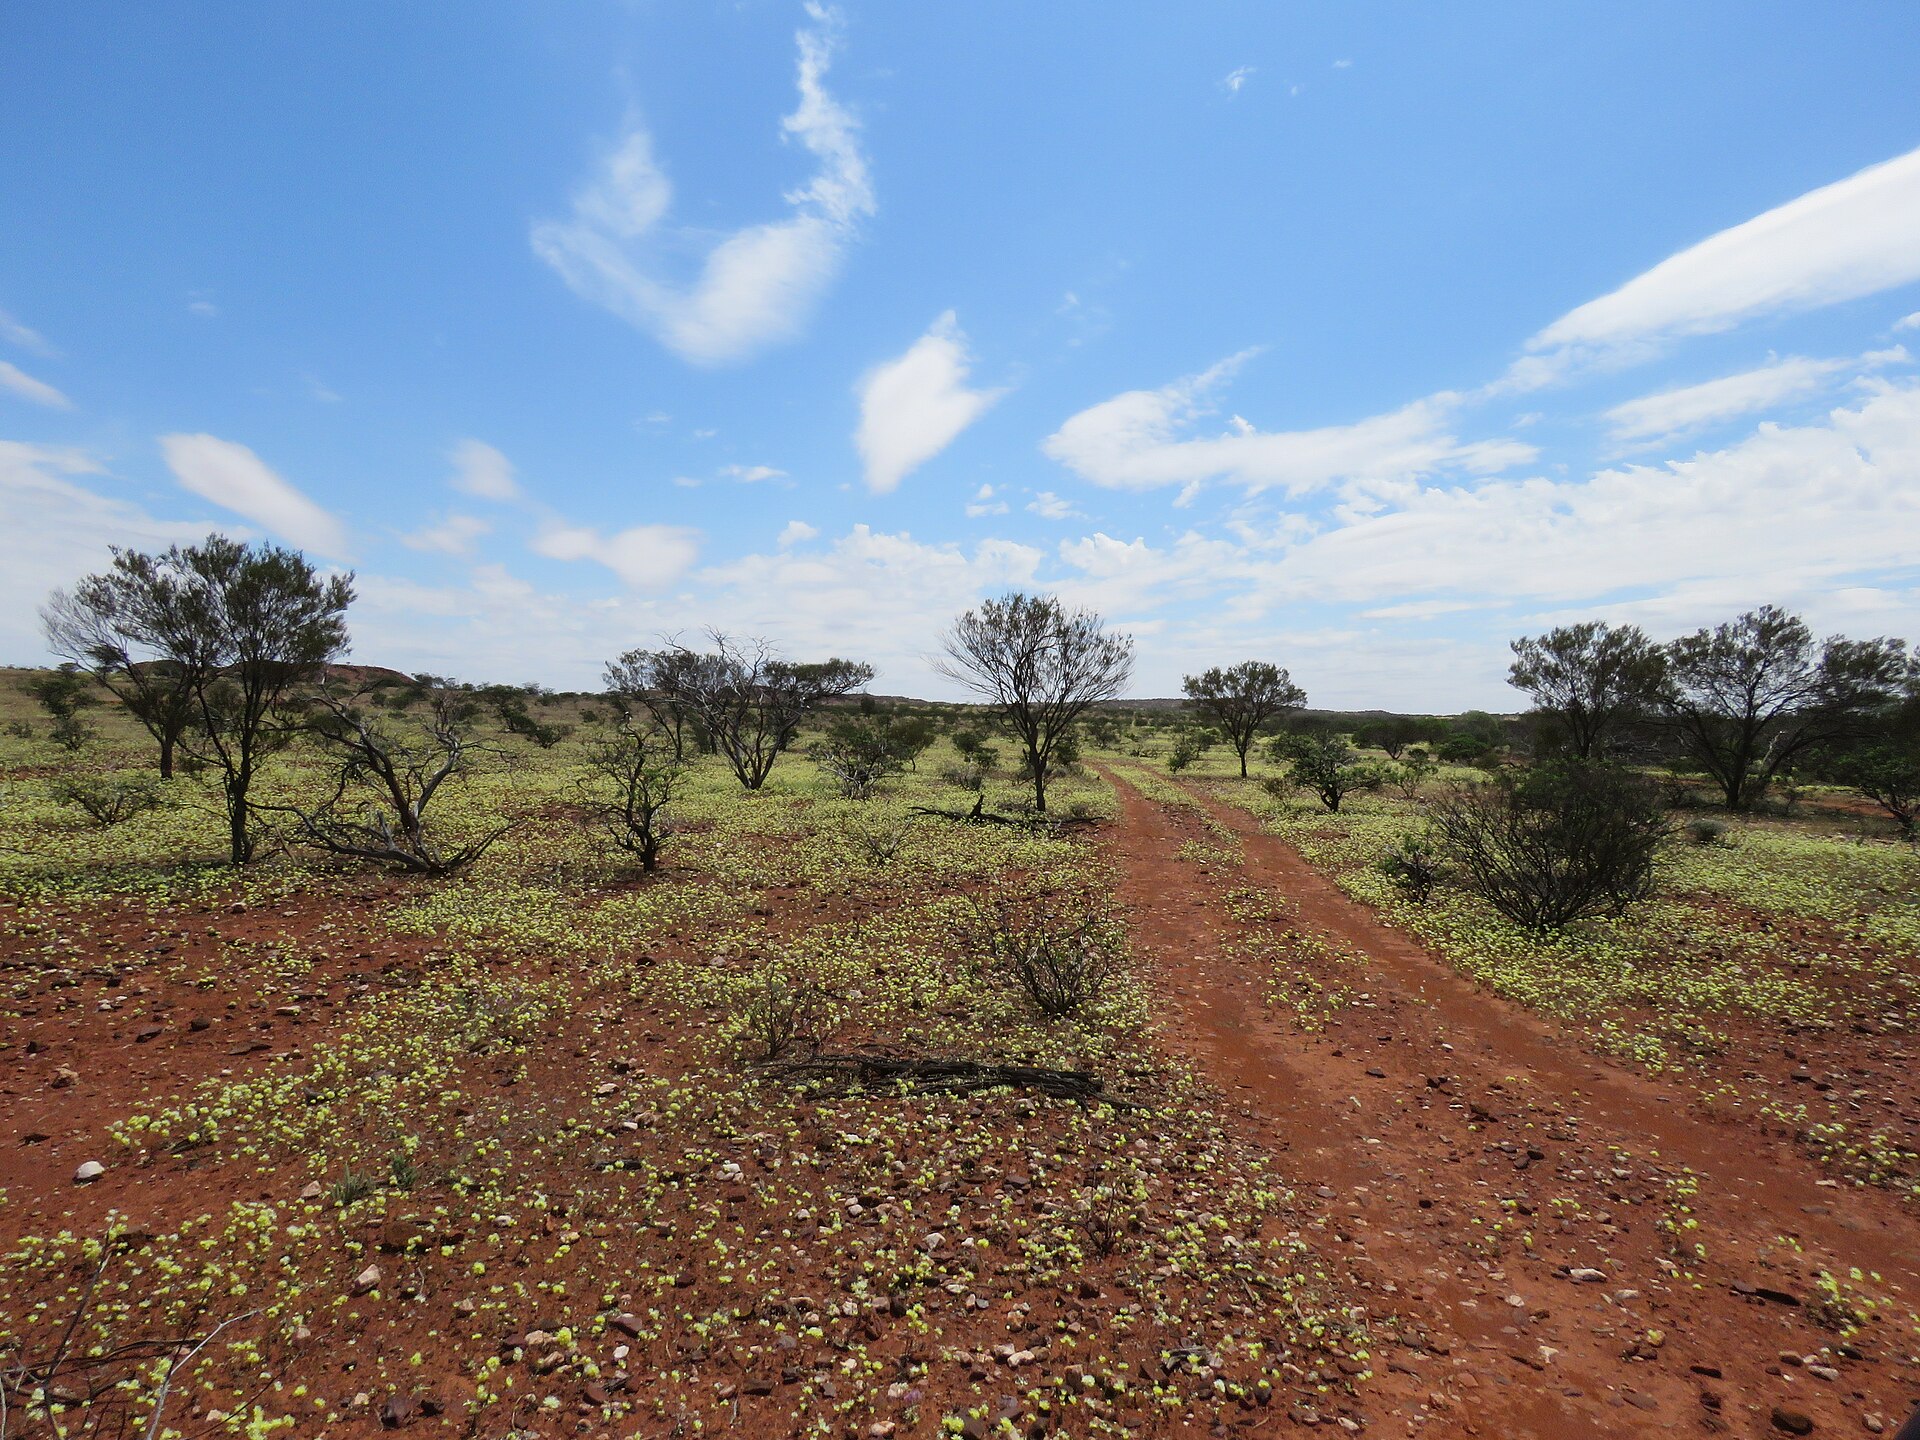
North of Yalgoo in the Murchison region, 4 October 2025. Regional context, outside the satellite square; not the 2026 bloom. Calistemon / Wikimedia Commons · CC BY-SA 4.0. [18][21]
Closer views reveal forms that a satellite cannot resolve. These photographs from Pindar, in the Mid West southwest of the Murchison, introduce plants from the surrounding region. They are earlier records, distinct from the 2026 observations.
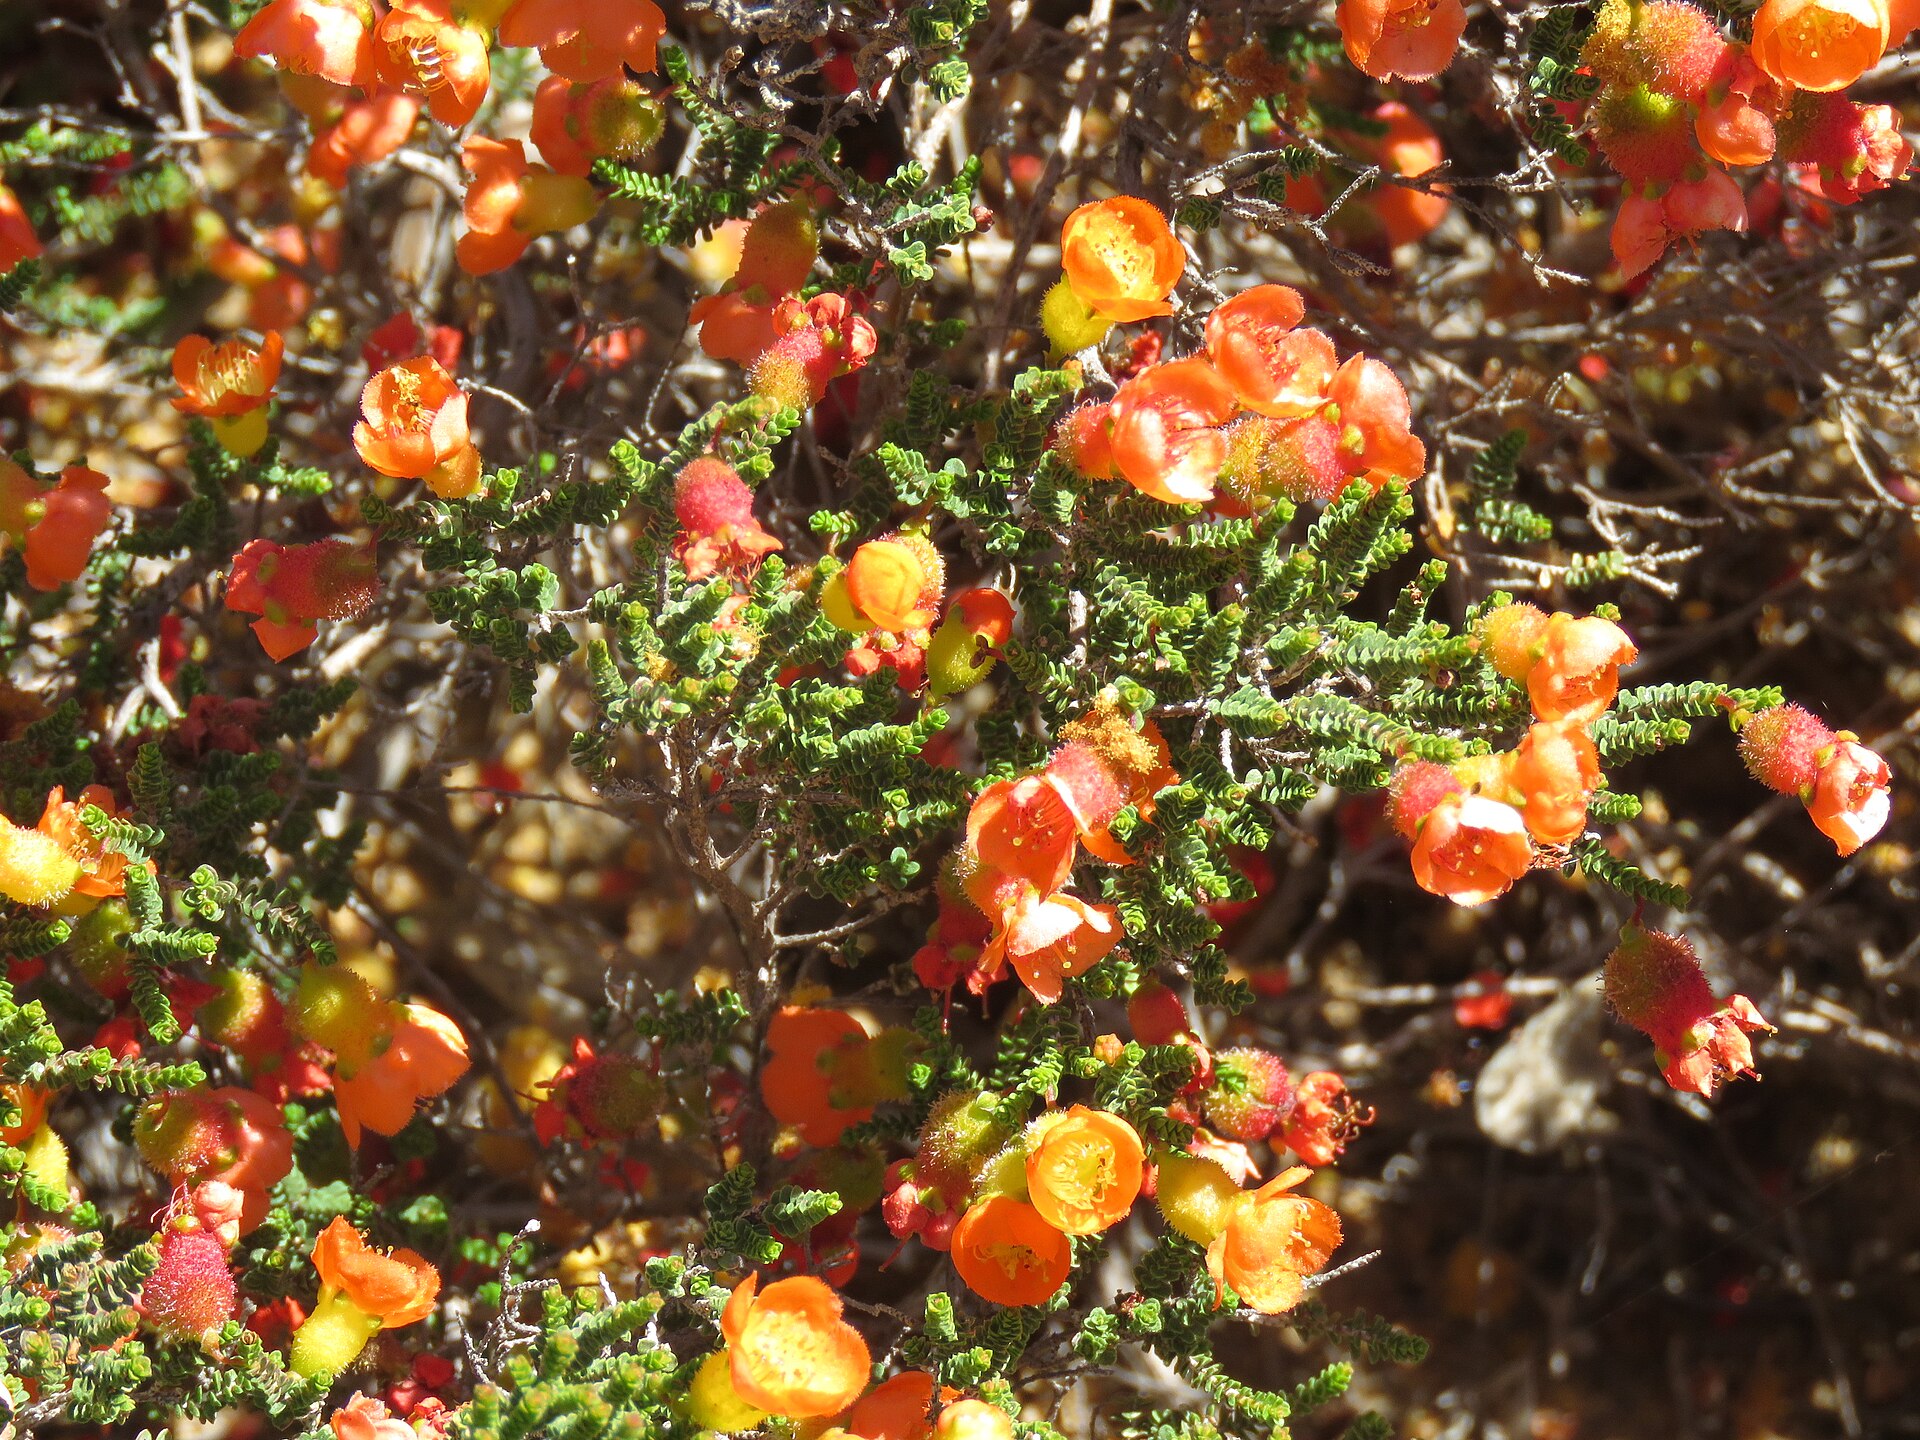
Pindar, Western Australia, 12 September 2021. Regional botanical context. Calistemon / Wikimedia Commons · CC BY-SA 4.0. [19][21]
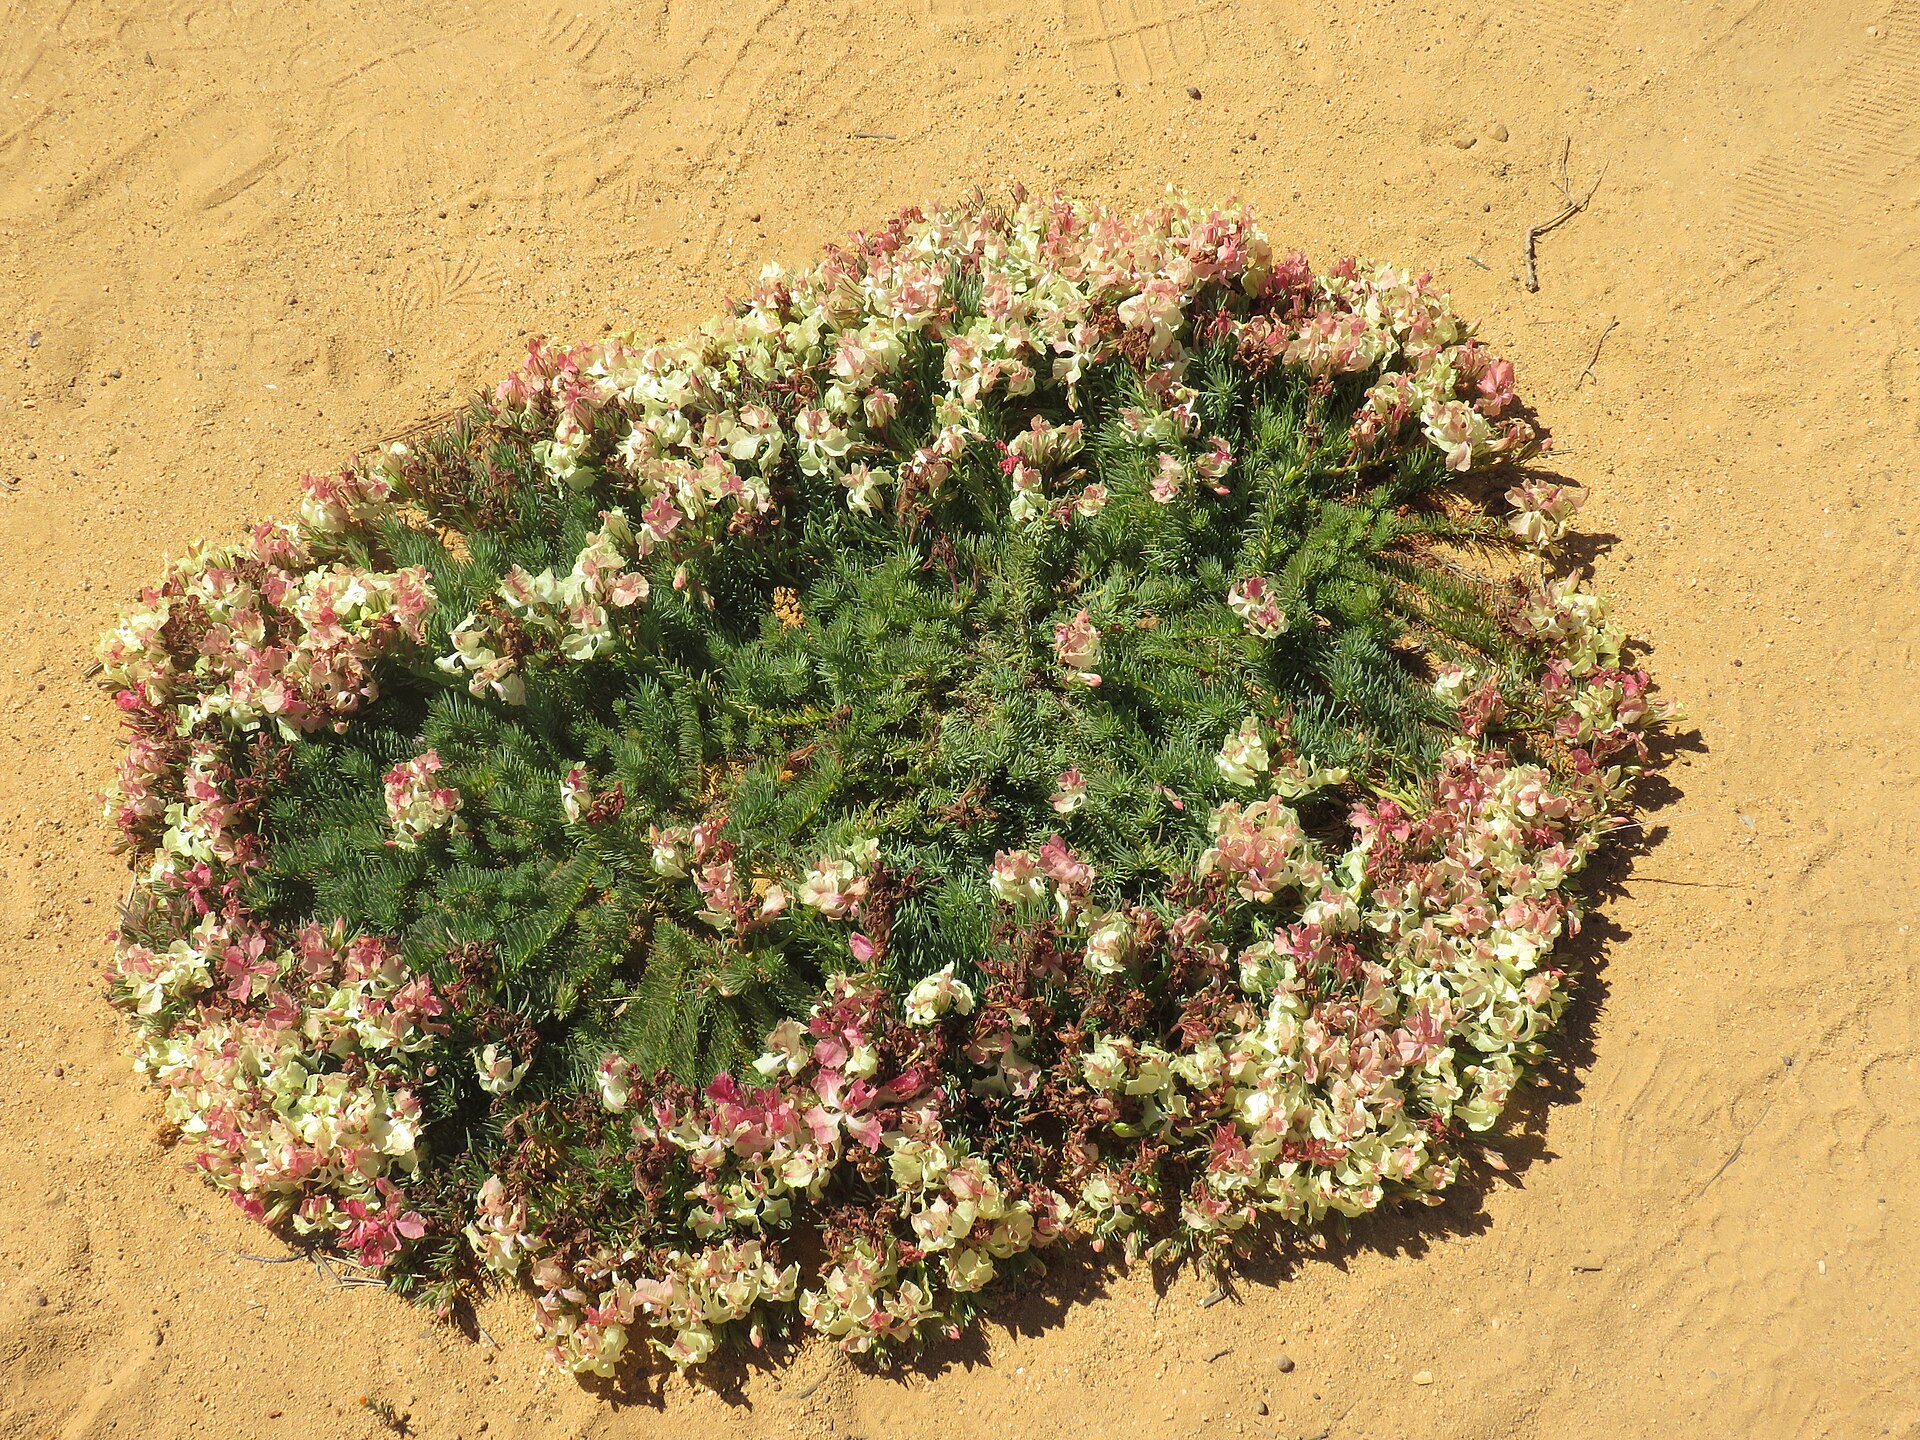
Wreath lechenaultia (Lechenaultia macrantha), Pindar, 12 September 2021. Calistemon / Wikimedia Commons · CC BY-SA 4.0. [20][21]
The seed bank: a season stored below ground
A soil seed bank is a reserve of living seeds at or below the surface. A landscape without visible flowers can still contain a next generation. In the Murchison, CSIRO’s report connects seeds dormant for years with the arrival of rain. [2]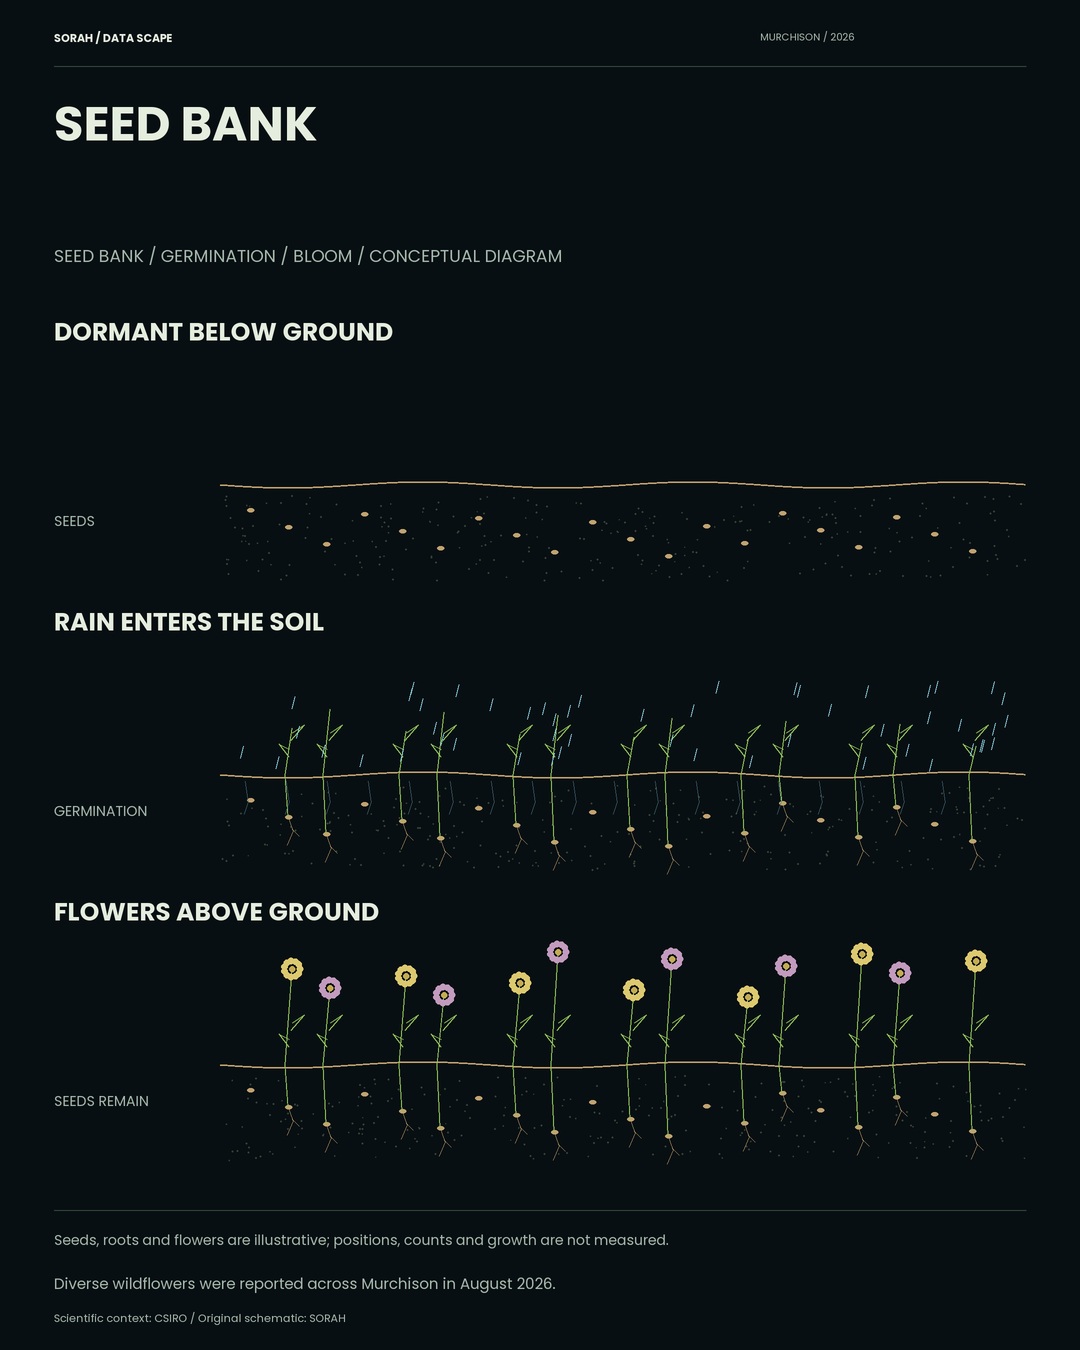
Conceptual illustration of dormant seeds, infiltrating rain, germination and flowering. [2]
This shifts attention to the conditions before a display: when water arrives and how long it remains available. Seeds below ground and plants above it need to be considered across time, not only when the flowers are most conspicuous.
After rain passes, how does the land respond?
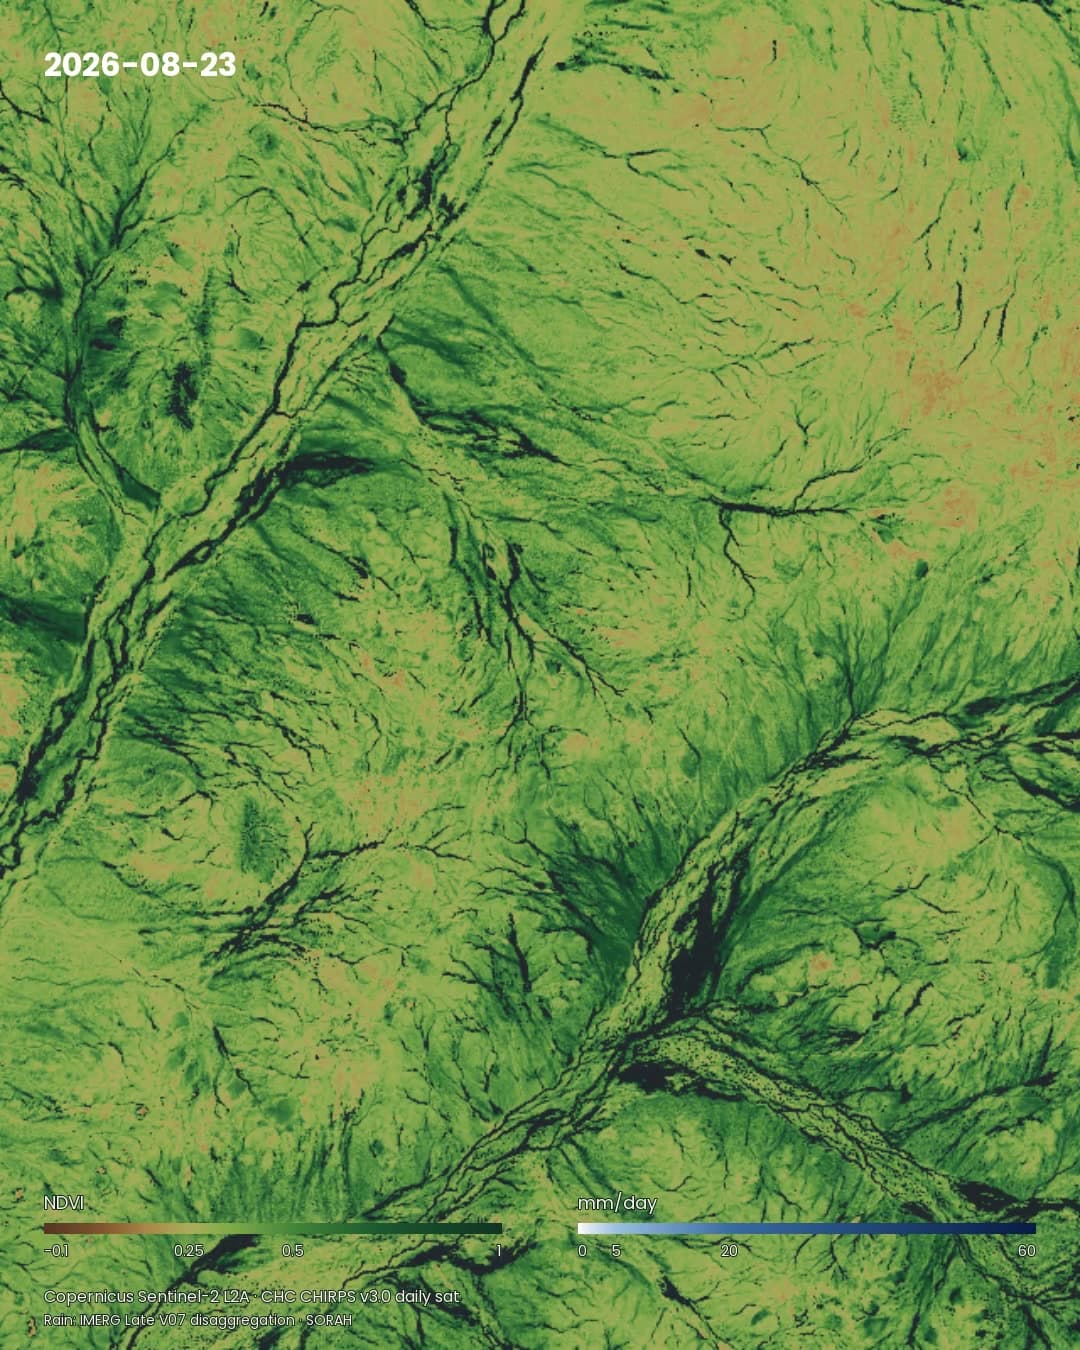
The main film compresses 4 February–31 August 2026 into 20.9 seconds. Satellite-derived NDVI forms the lower layer; daily precipitation passes above it in white-to-navy tones. Together they show rainfall and the changing vegetation signal over the same mapped area. [3][4][13][14]NDVI compares red and near-infrared reflectance. It provides information about vegetation, including grasses and shrubs, rather than counting flowers or identifying petal colors. Ground photographs and satellite measurements describe different aspects of the landscape. [5]
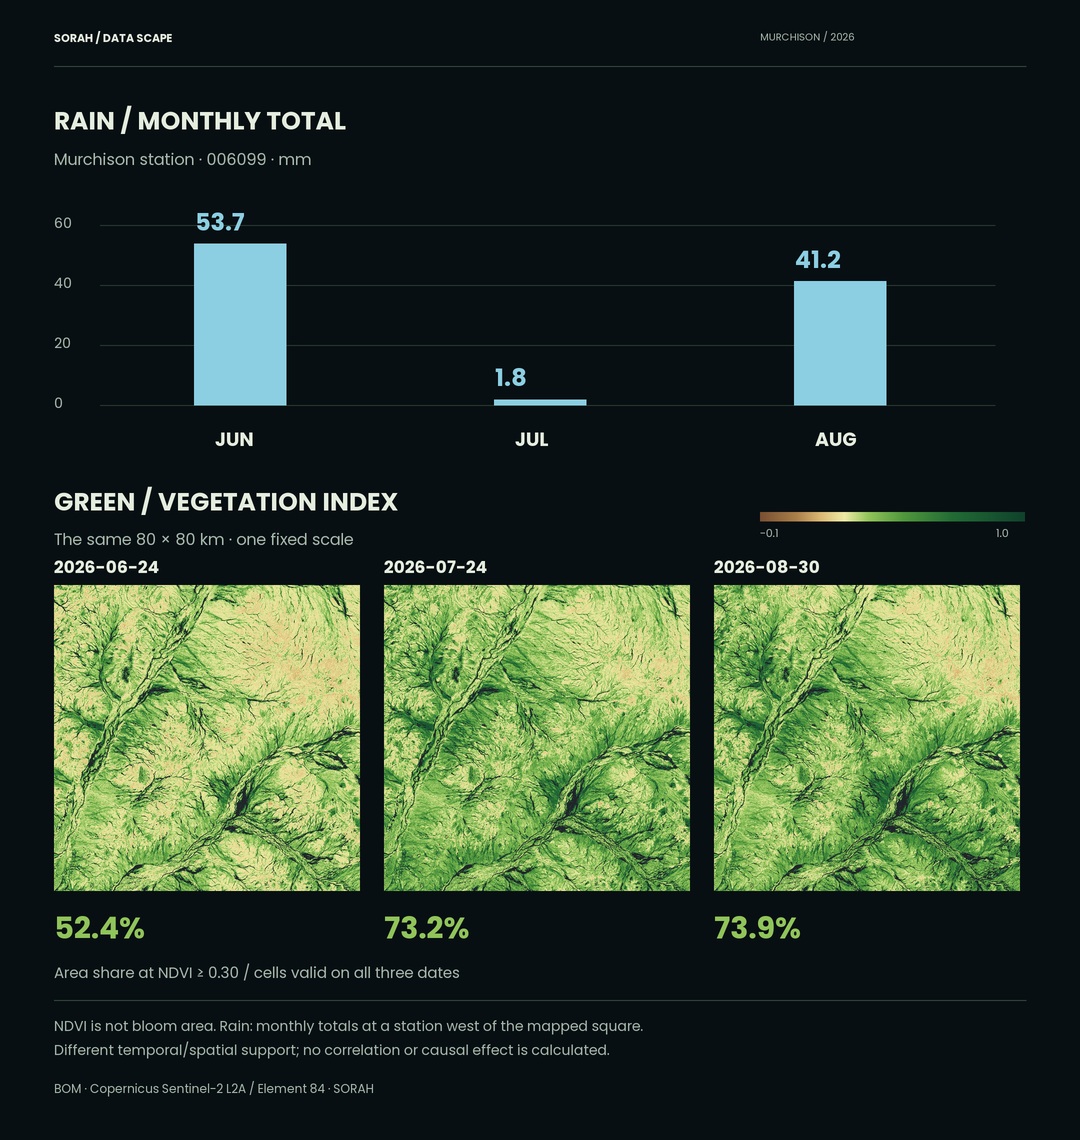
Murchison station 006099 and an 80 × 80 km Sentinel-2 square to its east. Percentages describe cells at NDVI ≥0.30 among those valid on all three dates. [3][6][7][11][12]
The station recorded 53.7 mm in June, 1.8 mm in July and 41.2 mm in August. Across the selected satellite observations, the share of common valid cells at NDVI ≥0.30 was 52.4%, 73.2% and 73.9%. The vegetation signal remained substantial in a month with little station rainfall. Matching each month’s rain directly to its greenness would miss this timing. [6][7][11][12]
Explore the timeline in Data Scape
Note · Comparison conditions Station totals and satellite maps cover different locations and temporal intervals. A monthly rain total includes days after that month’s satellite observation. No correlation coefficient or causal rainfall effect is estimated. Rain in the main film instead uses CHIRPS grid estimates projected onto the film’s mapped area.
Climate change alters the conditions for flowering
A prolific flowering year does not contradict warming. State of the Climate 2024 reports approximately 1.51°C of warming across Australia from 1910 to 2023, with more extreme heat. Across southwestern Australia, April–October rainfall has declined by about 16% since 1970. [16]Note · Regional trends and this event The temperature figure is national and the rainfall figure describes the southwest. Neither is a change measured within this satellite square. The sources reviewed here do not quantify how much human-caused warming contributed to the 2026 flowering event.
CSIRO–BOM projections for the southern Rangelands indicate declining winter rainfall and rising temperatures over this century. Potential evapotranspiration—the water that could be lost through evaporation and transpiration if sufficient water were available—is also projected to increase. The direction of annual and summer rainfall change remains less certain. [17]
The resulting question is whether rain will arrive when seeds can germinate, and whether moisture will remain through growth. This is an interpretation of the climate projections and the seed-bank process, not a flowering forecast produced by our maps. [2][17]
Beyond the moment of bloom
A photograph resolves petals, red soil and the spaces between shrubs. Satellite data reveal vegetation responses across time. A cross-section adds the seeds hidden below the surface. Read together, they turn a flowering moment into a way of examining the land and water conditions that support it.Note · Main visual: rainfall + NDVI through time 4 February–31 August 2026; 20.9 seconds, silent. Fifteen NDVI observations are interpolated at fixed locations; 209 daily rainfall fields crossfade. The on-screen date marks the timeline day. Intermediate forms are not observed daily growth or storm tracks. Pixels valid at only one endpoint fade towards grey. Data credits and scales remain in the film. [3][4][13][14]
About the data
NDVI uses Sentinel-2 L2A red/NIR reflectance, excluding cloud, shadow and water and aggregating to 100 m cells. Film extent: 64 × 80 km; comparison panels: 80 × 80 km. Rain: CHIRPS v3 final daily sat, 0.05°. Regional projections refer to the CSIRO–BOM 2015 assessment; observed national trends refer to State of the Climate 2024. Photo dates, places and licenses accompany each image.Sources
- NASA Earth Observatory — Boom Year for Desert Blooms(2026-09-23)
- CSIRO — World-leading radio telescopes give space for stunning wildflowers(2026-09-16)
- Copernicus Sentinel-2 L2A / Element 84 — 公開データ
- Element 84 — 反射率のスケール・オフセット
- Copernicus Data Space — NDVIの計算
- Bureau of Meteorology — Western Australia, August 2026
- Bureau of Meteorology — Western Australia, June 2026
- NASA — MODIS Vegetation Indices / MOD13C2
- ICDC, Hamburg — MODIS/Terra global monthly NDVI numerical archive
- Natural Earth — 1:110m land
- Bureau of Meteorology — Western Australia, July 2026
- Bureau of Meteorology — Murchison station 006099
- CHC — CHIRPS v3: daily satellite-disaggregated rainfall
- CHIRPS v3.0 final daily sat / 2026 GeoTIFF archive
- Australian Government — Murchison bioregion / Rangelands 2008
- BOM・CSIRO — State of the Climate 2024
- CSIRO・BOM — Rangelands climate projections(2015年の評価)
- 写真 / Wildflowers along a dirt road north of Yalgoo, Western Australia, October 2025 01.jpg
- 写真 / Wildflowers at Pindar, Western Australia, September 2021 02.jpg
- 写真 / Wreath Lechenaultia (Lechenaultia macrantha), September 2021 01.jpg
- Creative Commons — Attribution–ShareAlike 4.0
Author
SORAH Editorial
September 28, 2026




,_September_2021_01.jpg)