Published on 19/October/2026 · Nature
Zavodovski Island: two penguins, changing nesting grounds
By SORAH Editorial
Five survey periods connect a volcanic island’s nesting slopes to the food available in the Southern Ocean.
Two species on a volcanic slope
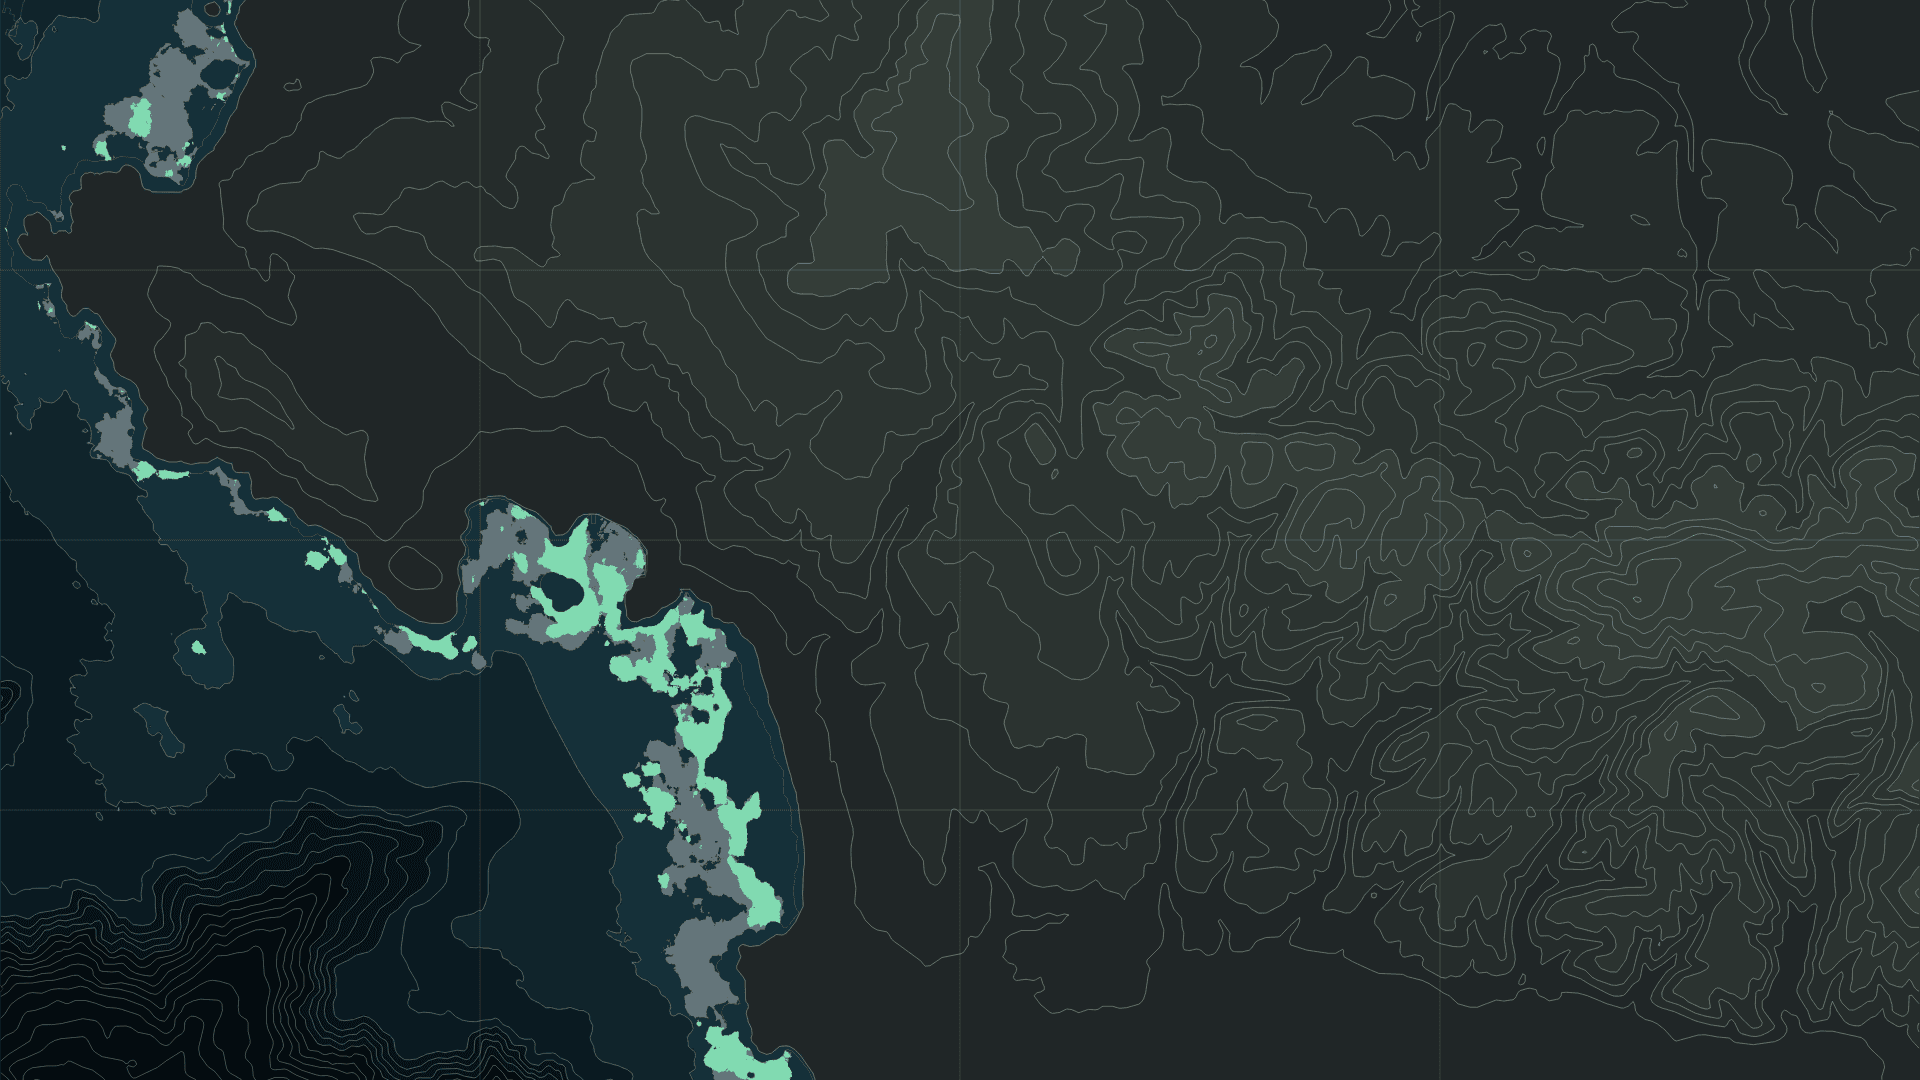
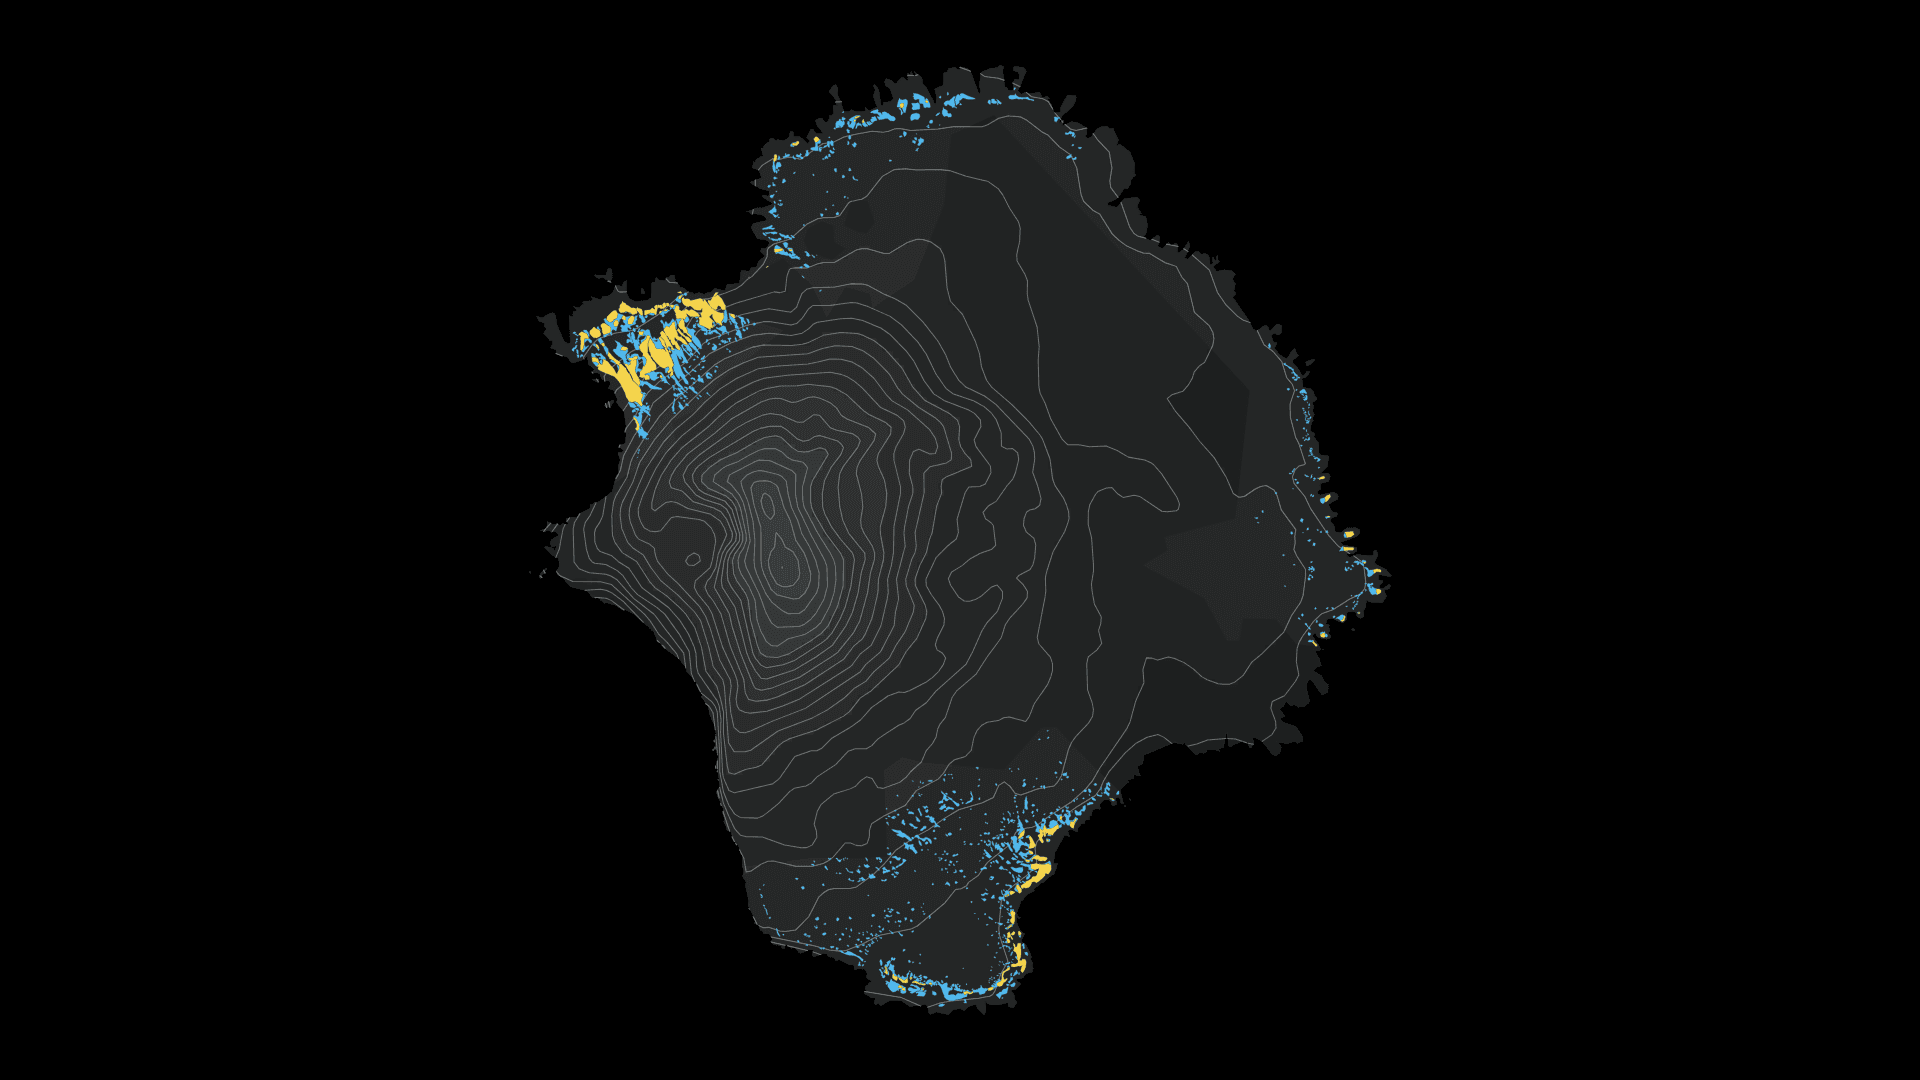
Zavodovski sits at the northern end of the South Sandwich Islands in the South Atlantic. Its volcanic slopes descend towards the sea, with penguins nesting on the exposed ground. In October 2026, the British Antarctic Survey reported a 63% decline in occupied chinstrap nests between 2011 and 2025. Field research on this remote island is helping scientists read changes in the Southern Ocean through records left on land. BAS · Penguin population collapse on volcanic island (7 October 2026)The outlines shown here come from the nesting-area maps released alongside that research. Within a footprint that can be compared across all five survey periods, chinstrap nesting area changed from about 63.6 hectares in 2011 to 18.5 hectares in 2025. Macaroni nesting area changed from about 9.2 to 11.2 hectares. Holding the geography steady reveals how the space occupied by each species has changed. BAS · Mapping of higher predators on Zavodovski Island, 2010–2025
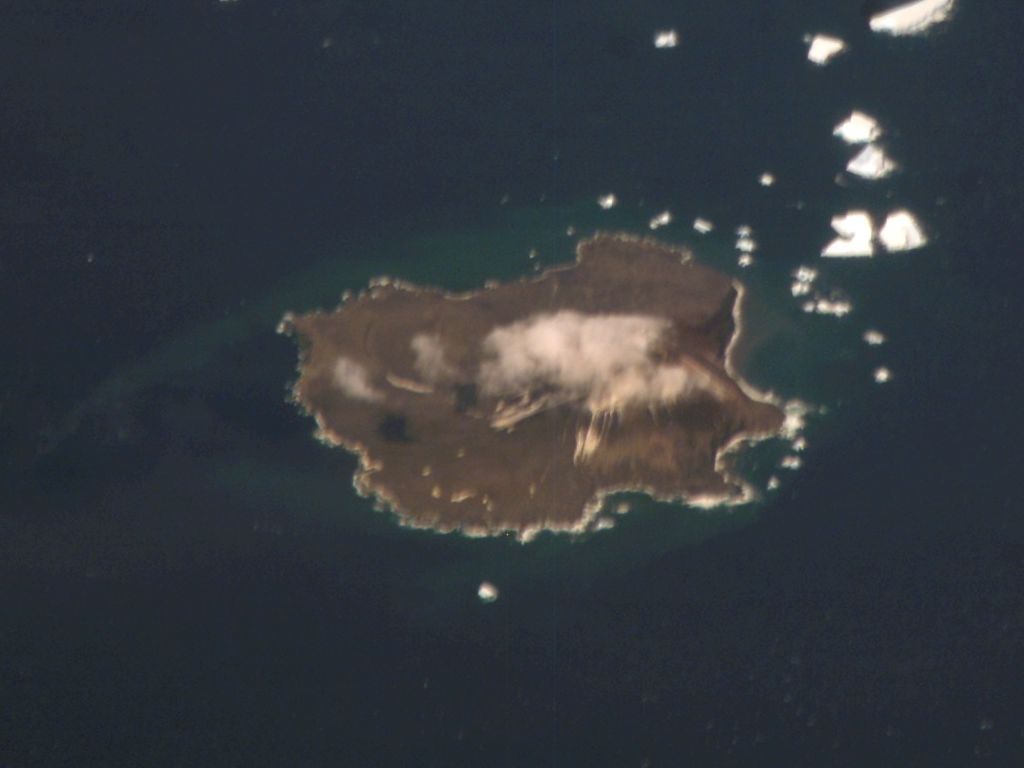
Zavodovski Island seen from the International Space Station, 27 January 2008. NASA / ISS Expedition 16 · Public domain — NASA · Source · Supplied image unchanged; cropped in the source version.
A nest on land depends on food at sea
Chinstraps take their name from the narrow dark band beneath the head. They feed mainly on krill and fish, returning to land during the breeding season. Males and females share incubation duties. A breeding colony therefore depends on both suitable nesting ground and the sea that adults can reach to find food. Australian Antarctic Program · Chinstrap penguin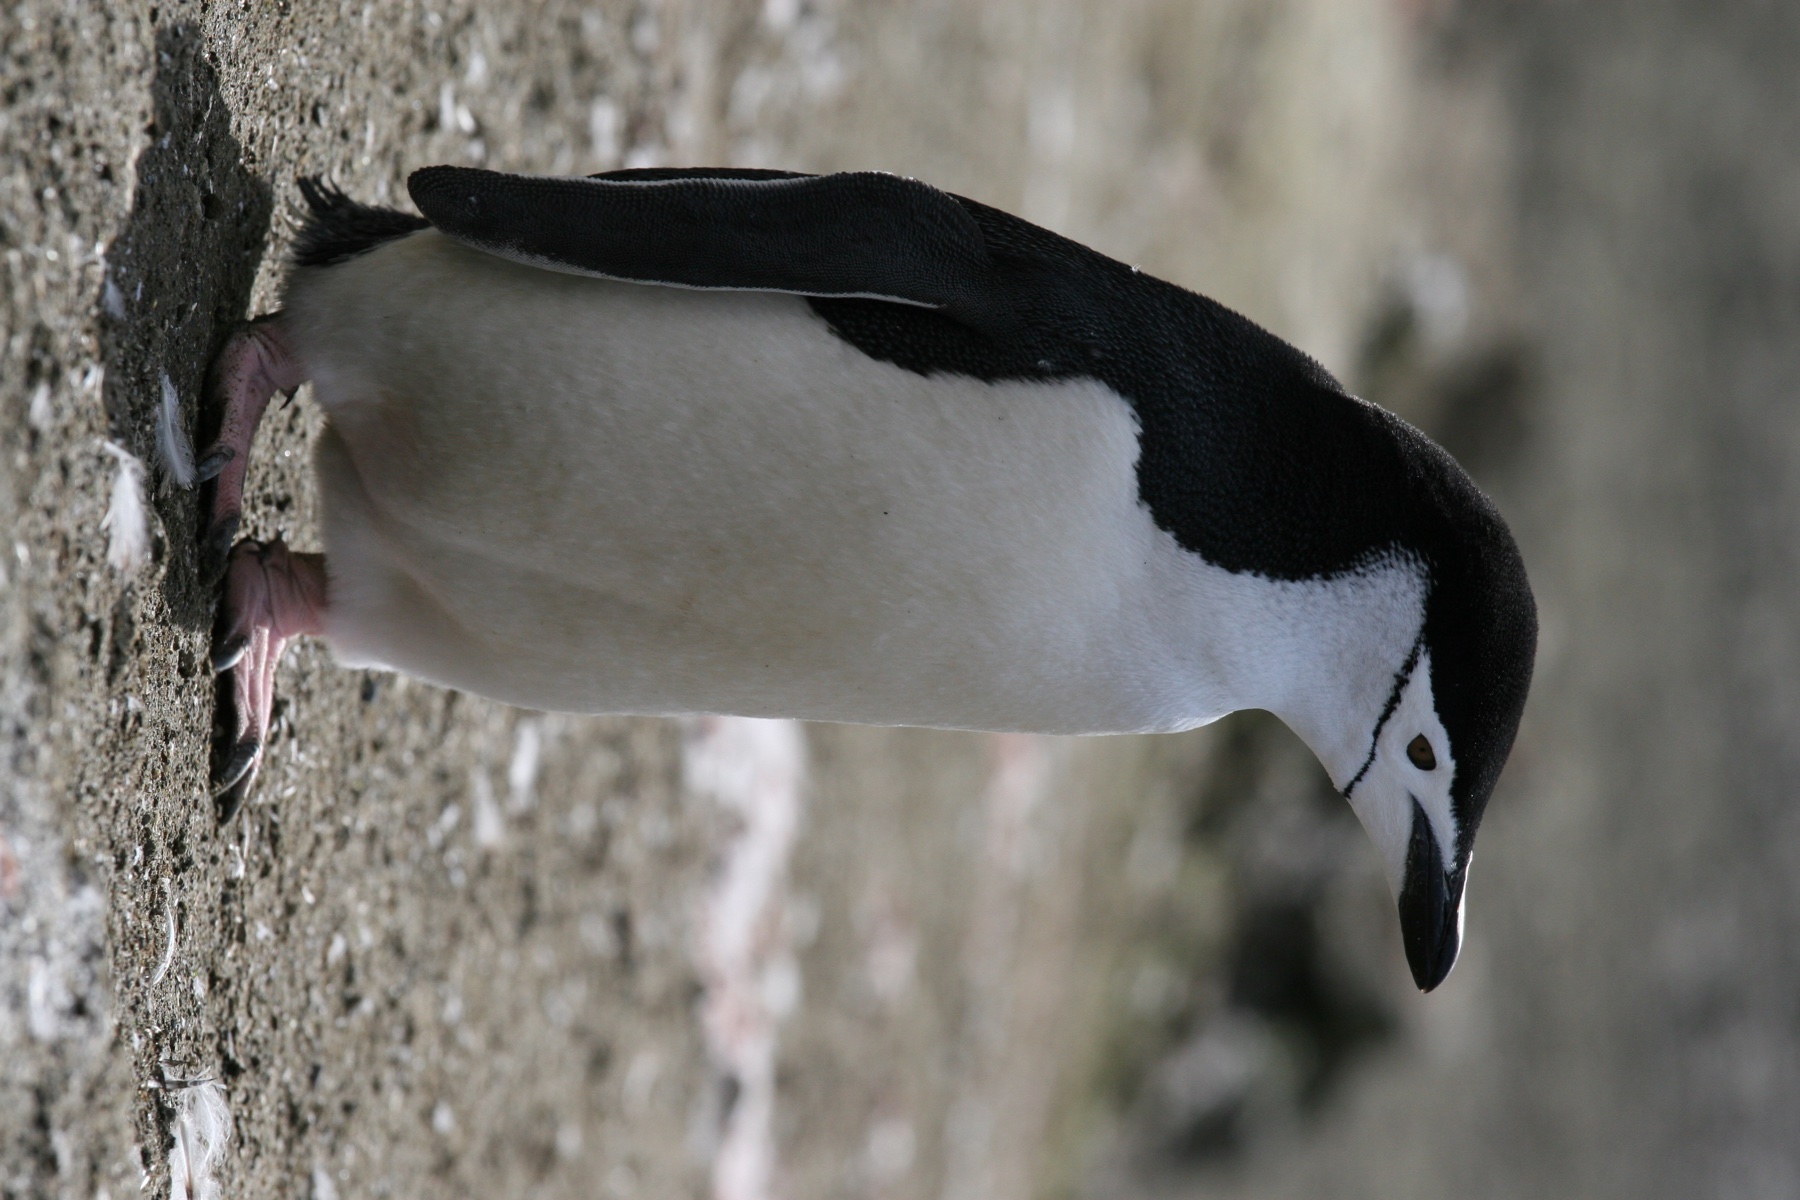
A chinstrap penguin on Livingston Island, South Shetland Islands, 13 March 2008. Gilad Rom · CC BY 2.0 · Source · Proportional resize and JPEG compression only.
Macaroni penguins, recognizable by their golden crest, also eat krill and fish. The duration and distance of their feeding trips vary with the stage of breeding. Nesting beside another species does not make their lives at sea identical: each species encounters changing marine conditions through its own behaviour and seasonal requirements. Australian Antarctic Program · Macaroni penguin
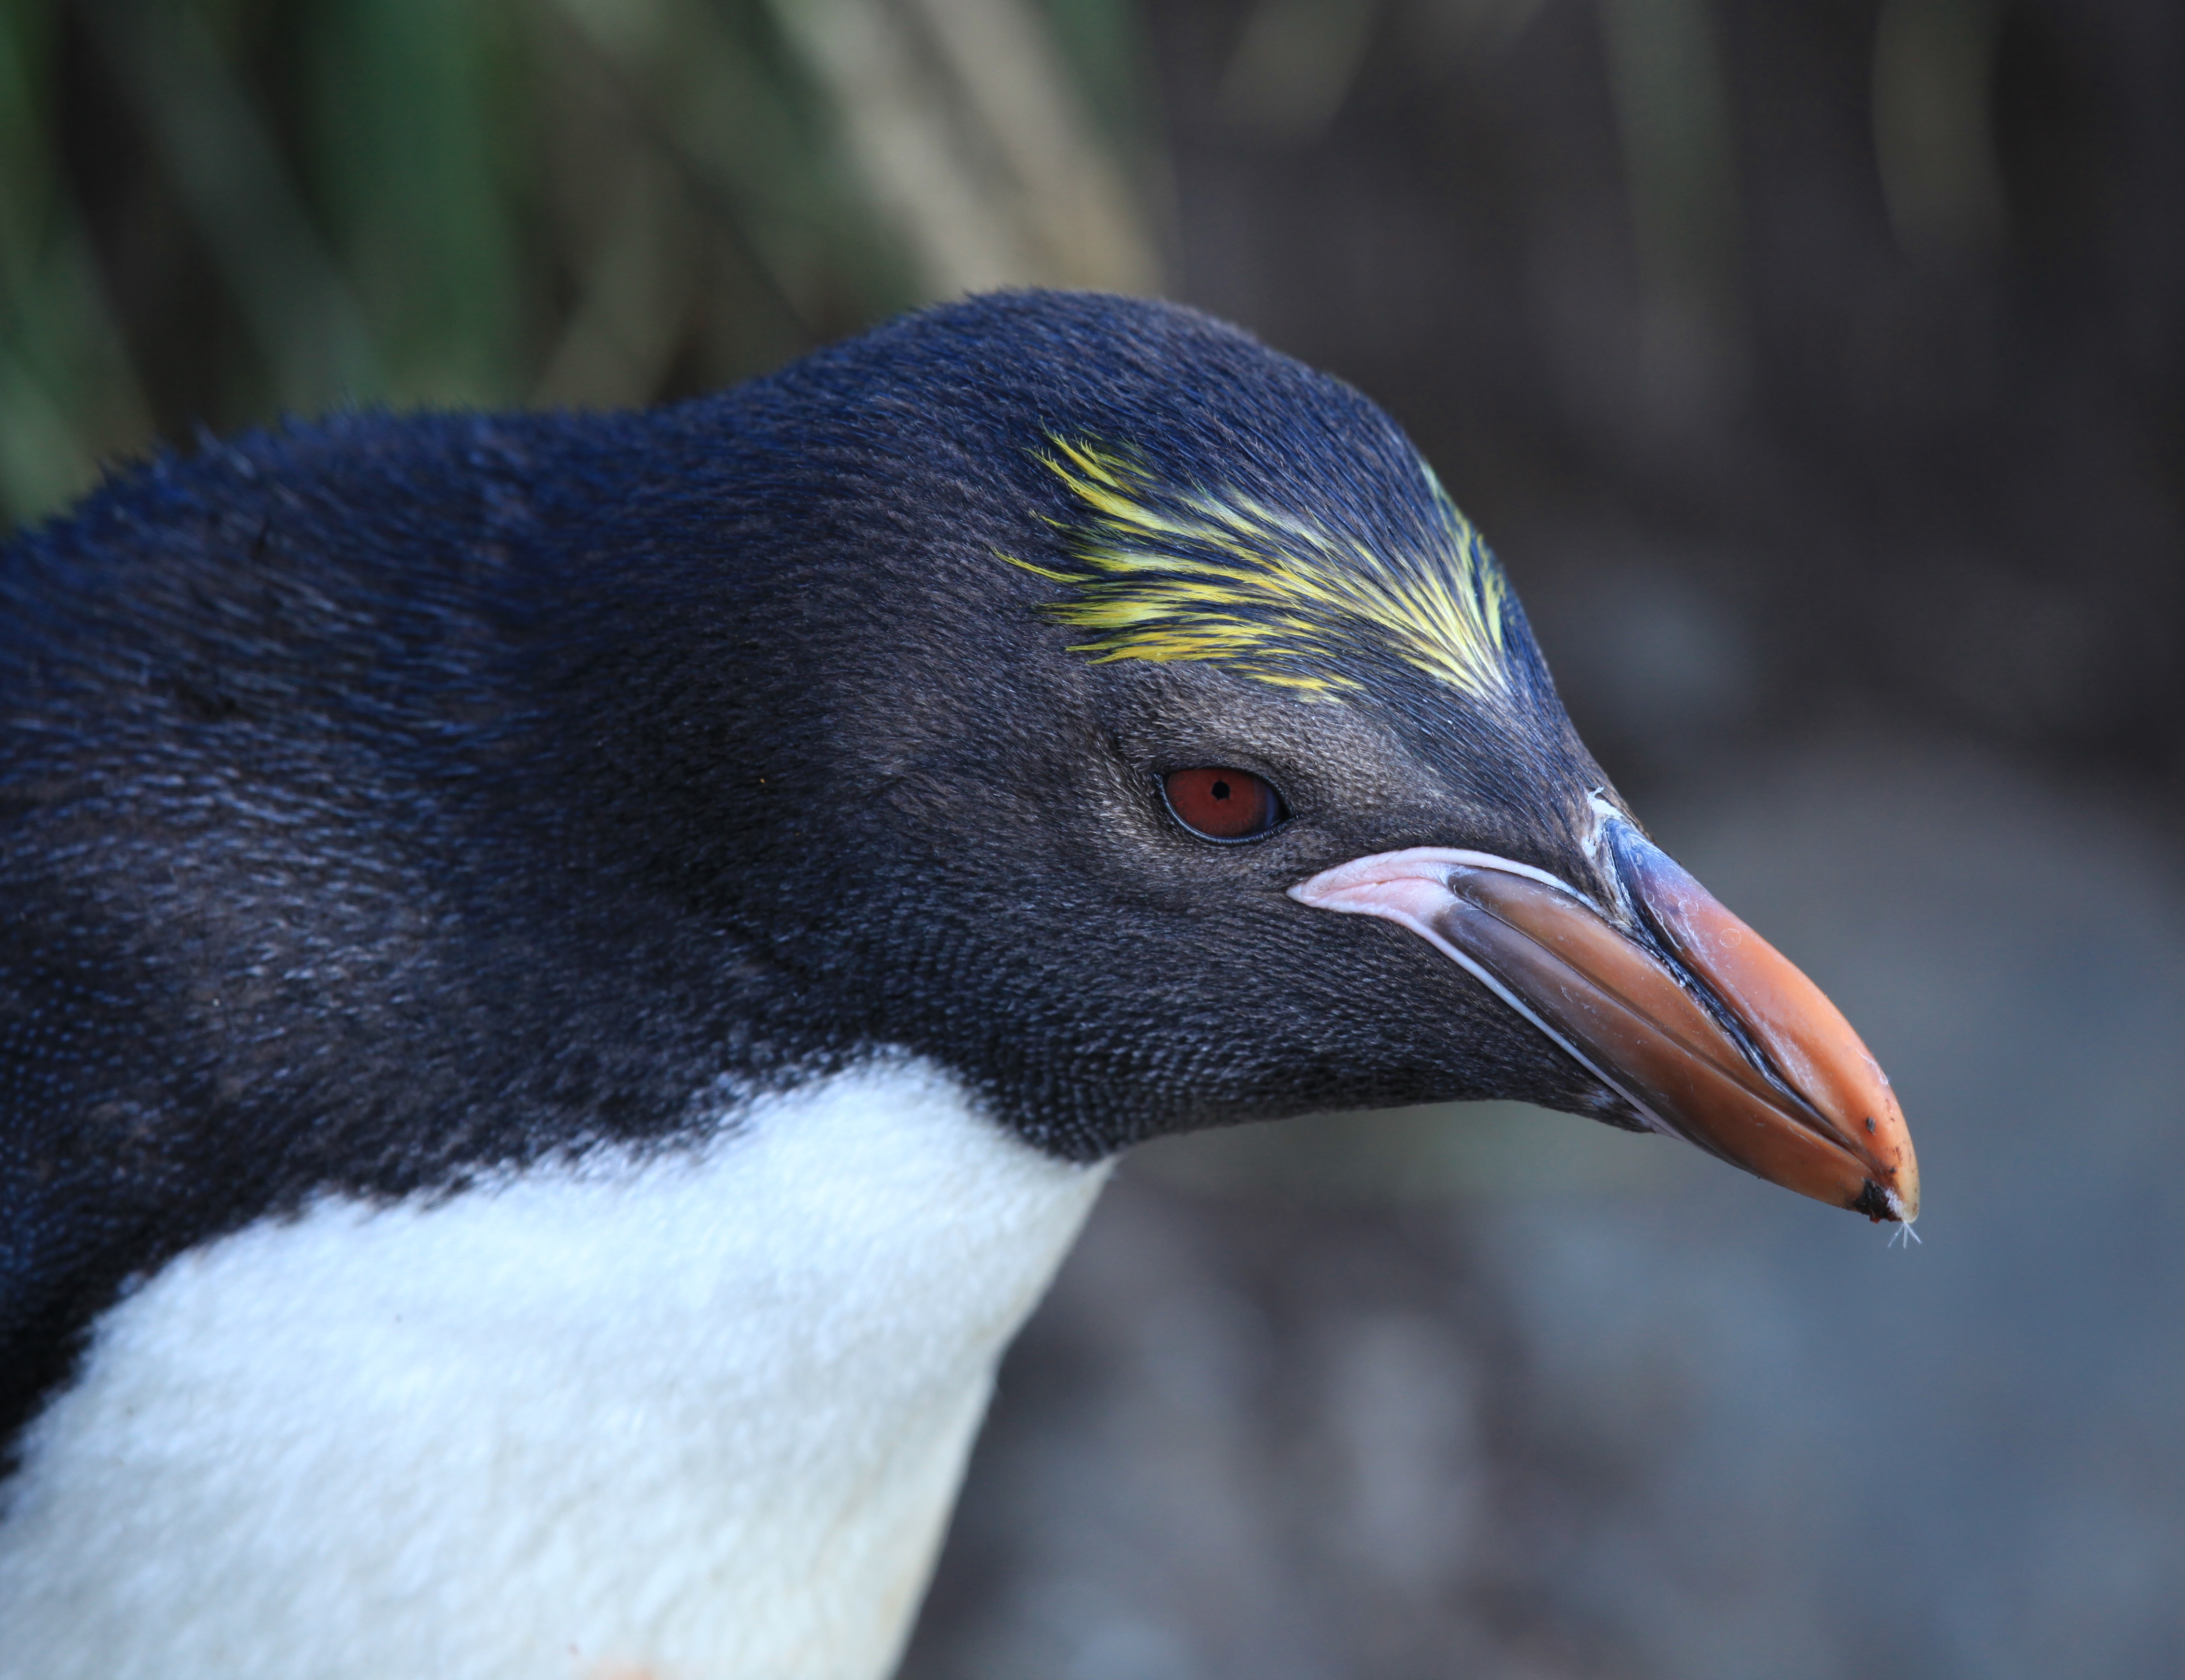
A macaroni penguin at Cooper Bay, South Georgia, 19 January 2011. Liam Quinn · CC BY-SA 2.0 · Source · Unmodified.
Five records reveal the path between the endpoints
The comparable chinstrap areas are approximately 63.6, 41.5, 27.5, 17.5 and 18.5 hectares, for 2011, 2016, 2020–2022, 2023 and 2025 respectively. The last interval shows a small increase within a much larger contraction across the full comparison. Intermediate records let us hold both observations in view. BAS · Mapping of higher predators on Zavodovski Island, 2010–2025For macaronis, the corresponding areas are approximately 9.2, 11.7, 11.1, 10.7 and 11.2 hectares. Combining the species into a single total would hide their different paths. Separate outlines keep the question attached to the ground: which species occupies which part of the slope, and how has that pattern changed?
A nesting outline records the amount of ground used for breeding. Nest density within that area requires separate measurement. Reading mapped extent alongside occupied-nest surveys allows land use and the size of the breeding population to be examined through their respective measures.
The records also bring different observing methods together, including satellite imagery and drone surveys. Checking clouds and survey coverage establishes the ground on which a comparison is possible. It is a practical part of ecological monitoring, and a way to identify where a future survey could add the most useful evidence. BAS · Mapping of higher predators on Zavodovski Island, 2010–2025
Following the change back into the food web
The 2026 paper identifies reduced krill availability associated with regional warming as the most likely primary explanation for the chinstrap decline. The authors assessed several possibilities, including the island’s 2016 eruption. Their interpretation combines evidence beyond the nesting outlines, including the behaviour of birds tracked at sea. Ratcliffe et al. · Population declines and changes in community composition (2026)Krill feed on phytoplankton and are eaten by penguins, fish, seals and whales. Their place in the food web links small organisms in the water to the feeding conditions of many predators. Looking from the nesting slope towards the ocean makes that dependence tangible: an island colony is sustained by processes extending well beyond its shoreline. Australian Antarctic Program · Antarctic food web
Returning to the same ground
Protecting a breeding colony involves both the land where birds nest and the sea where adults obtain food. In this comparison, chinstrap nesting outlines contract strongly while macaroni outlines follow a different course. Recording each species separately, and returning to a consistent footprint, keeps those changes available for closer investigation.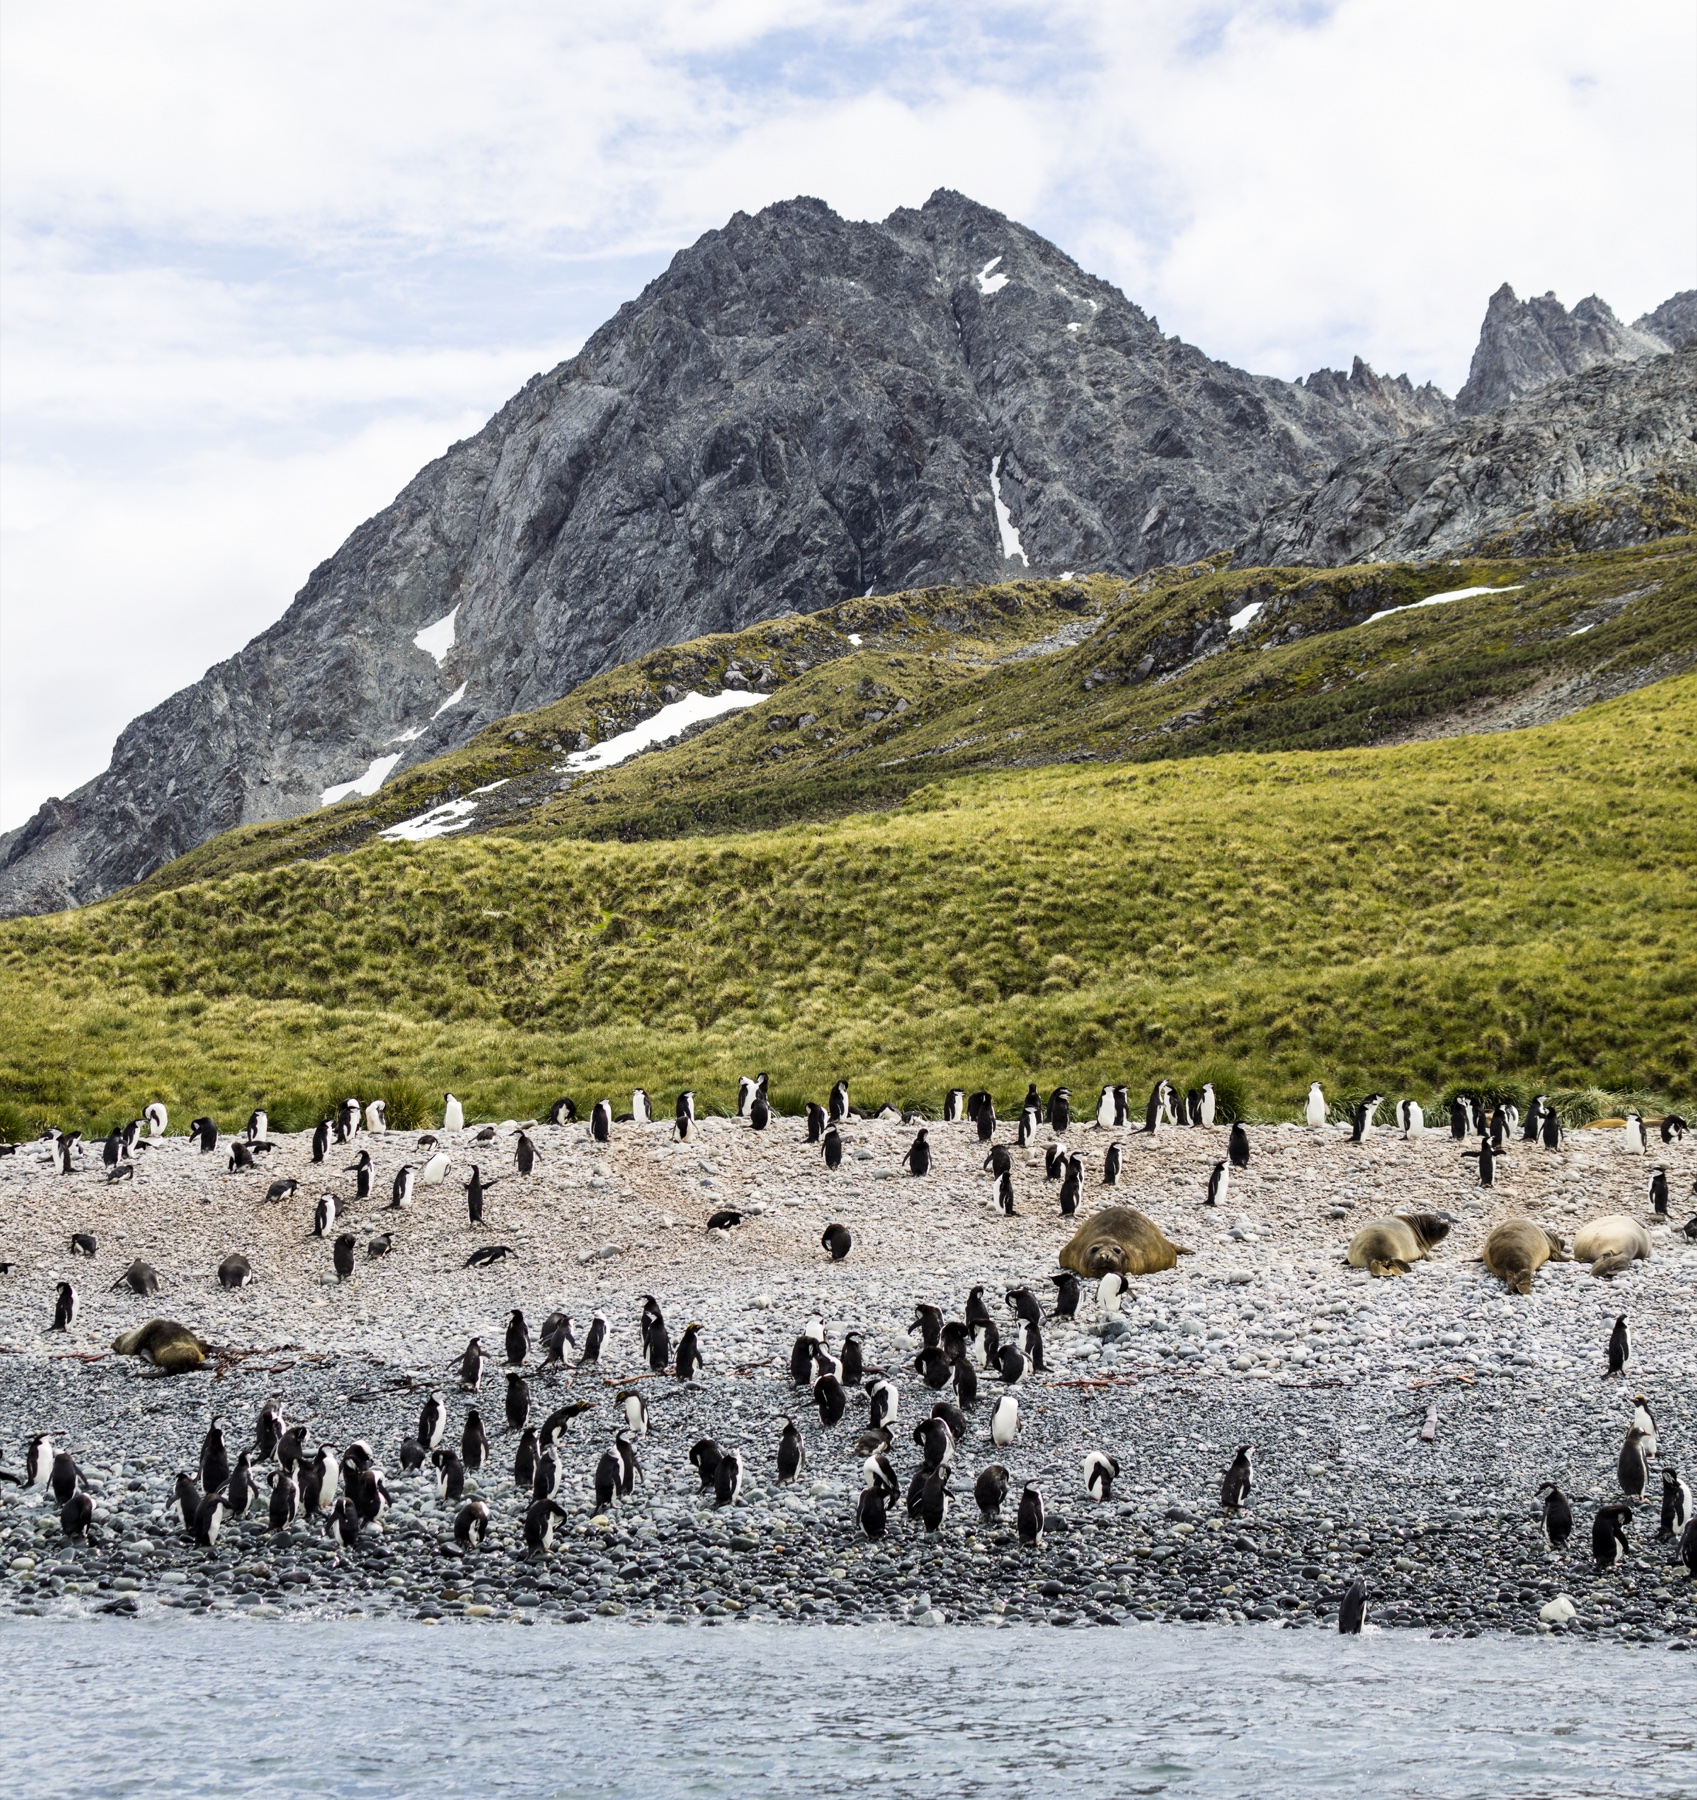
Chinstrap and macaroni penguins sharing a beach at Cooper Bay, South Georgia, 11 January 2016. Andrew Shiva / Wikipedia · CC BY-SA 4.0 · Source · Proportional resize and JPEG compression only.
A later survey can ask where nests remain and where nesting ground has appeared. Read alongside the movements of feeding adults and the conditions of their prey, those observations will connect a specific volcanic slope to the wider marine environment. The map is a place from which to begin that inquiry.
Data and representation
Areas are calculated from BAS nesting polygons within the footprint observable across all five periods. Cloud areas from 2011, 2016 and 2025 and the unsurveyed 2023 area are excluded throughout. The 2020–2022 layer combines multiple acquisition dates. Hectares measure mapped nesting area. The 63% figure in the opening is the paper’s separate result for occupied nests; these map areas are our common-footprint calculation. Species population rankings require population estimates. BAS · Mapping of higher predators on Zavodovski Island, 2010–2025 Ratcliffe et al. · Population declines and changes in community composition (2026)Terrain uses Copernicus GLO30 elevations with 25-metre contours. Blue identifies chinstraps and yellow identifies macaronis. Smooth crossfades connect five observed survey periods, with both survey dates and both recorded areas shown during each transition. Intermediate frames are visual transitions between records. Photographic locations and dates are identified in the captions.
Sources
- BAS · Penguin population collapse on volcanic island (7 October 2026)
- Ratcliffe, Dickens & Clucas (2026) · BAS · OGL v3
- Australian Antarctic Program · Chinstrap penguin
- Australian Antarctic Program · Macaroni penguin
- Ratcliffe et al. · Population declines and changes in community composition (2026)
- Australian Antarctic Program · Antarctic food web
- Data repository / layer definitions
- Copernicus DEM / licence
- BAS · Zavodovski expedition
Author
SORAH Editorial
October 19, 2026