
Published on 18/October/2026 · Nature
Where the Amazon’s forests changed over 30 years
By SORAH Editorial
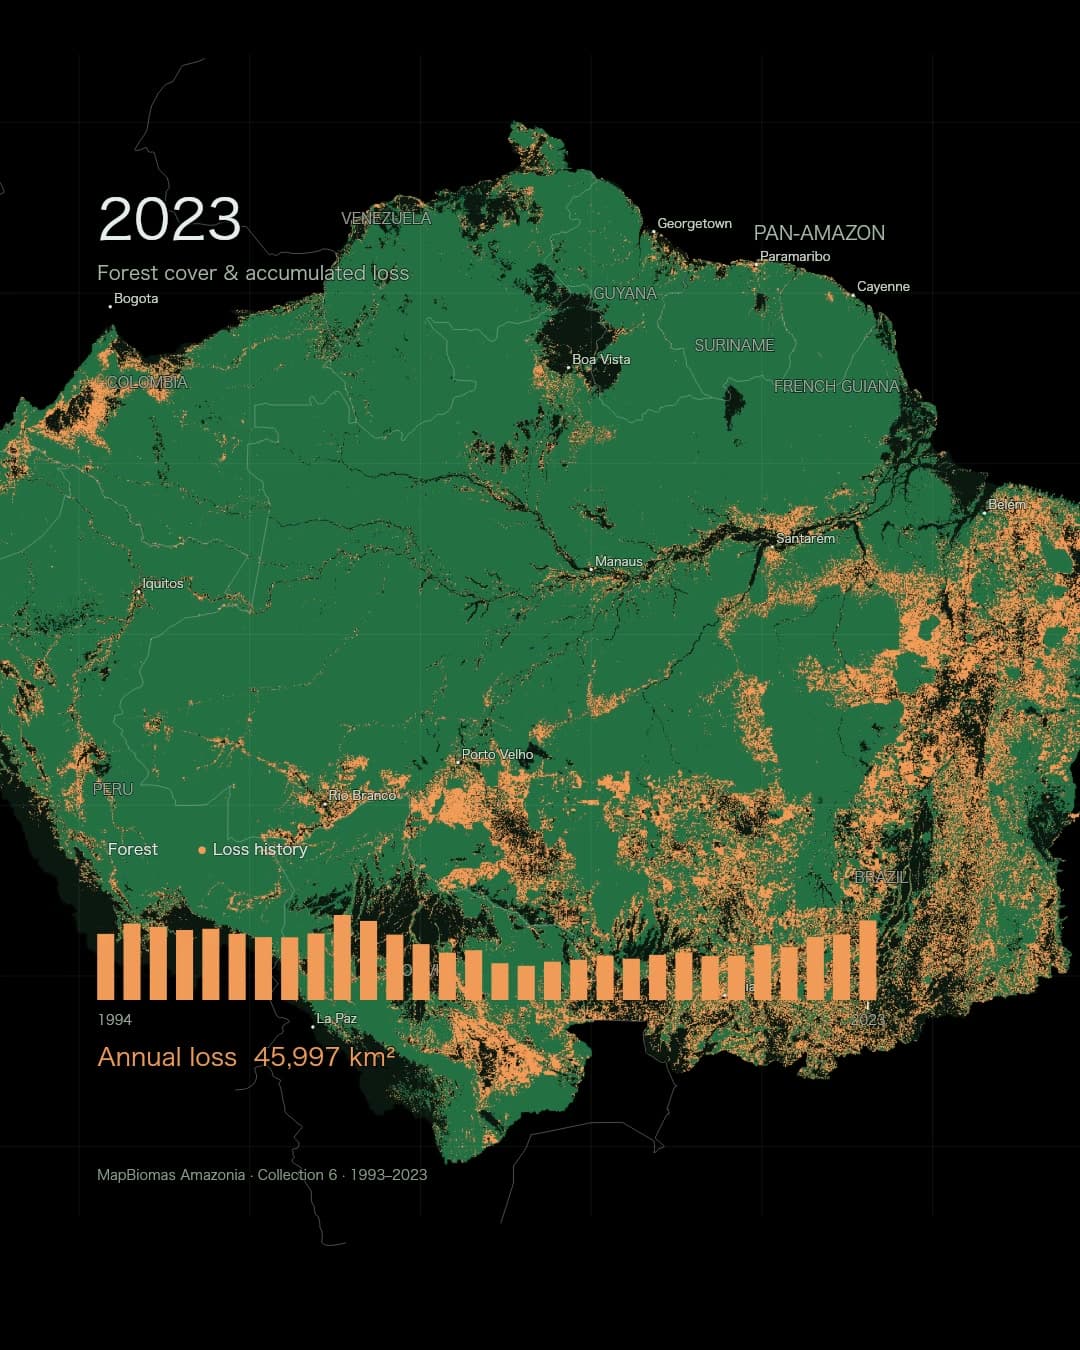
From 1993 to 2023, follow forests across national borders, from Brazil to Peru, Colombia and the Guianas. Overlay annual losses on comparable forest cover across eight countries and French Guiana.
West of Brazil, Amazon forests continue towards the Andean foothills of Peru and Colombia. Venezuela and the Guianas lie to the north; Bolivia extends the region to the south. Rivers and forests cross political boundaries. Understanding their change calls for a shared view of geography, classification and time.
MapBiomas Amazonia Collection 6 classifies land cover and land use from satellite imagery year by year. The analysis region used here spans approximately 8.42 million km² across eight countries and French Guiana. The period from 1993 to 2023 provides both a 30-year comparison and a record of the changes between those endpoints. MapBiomas Amazonia
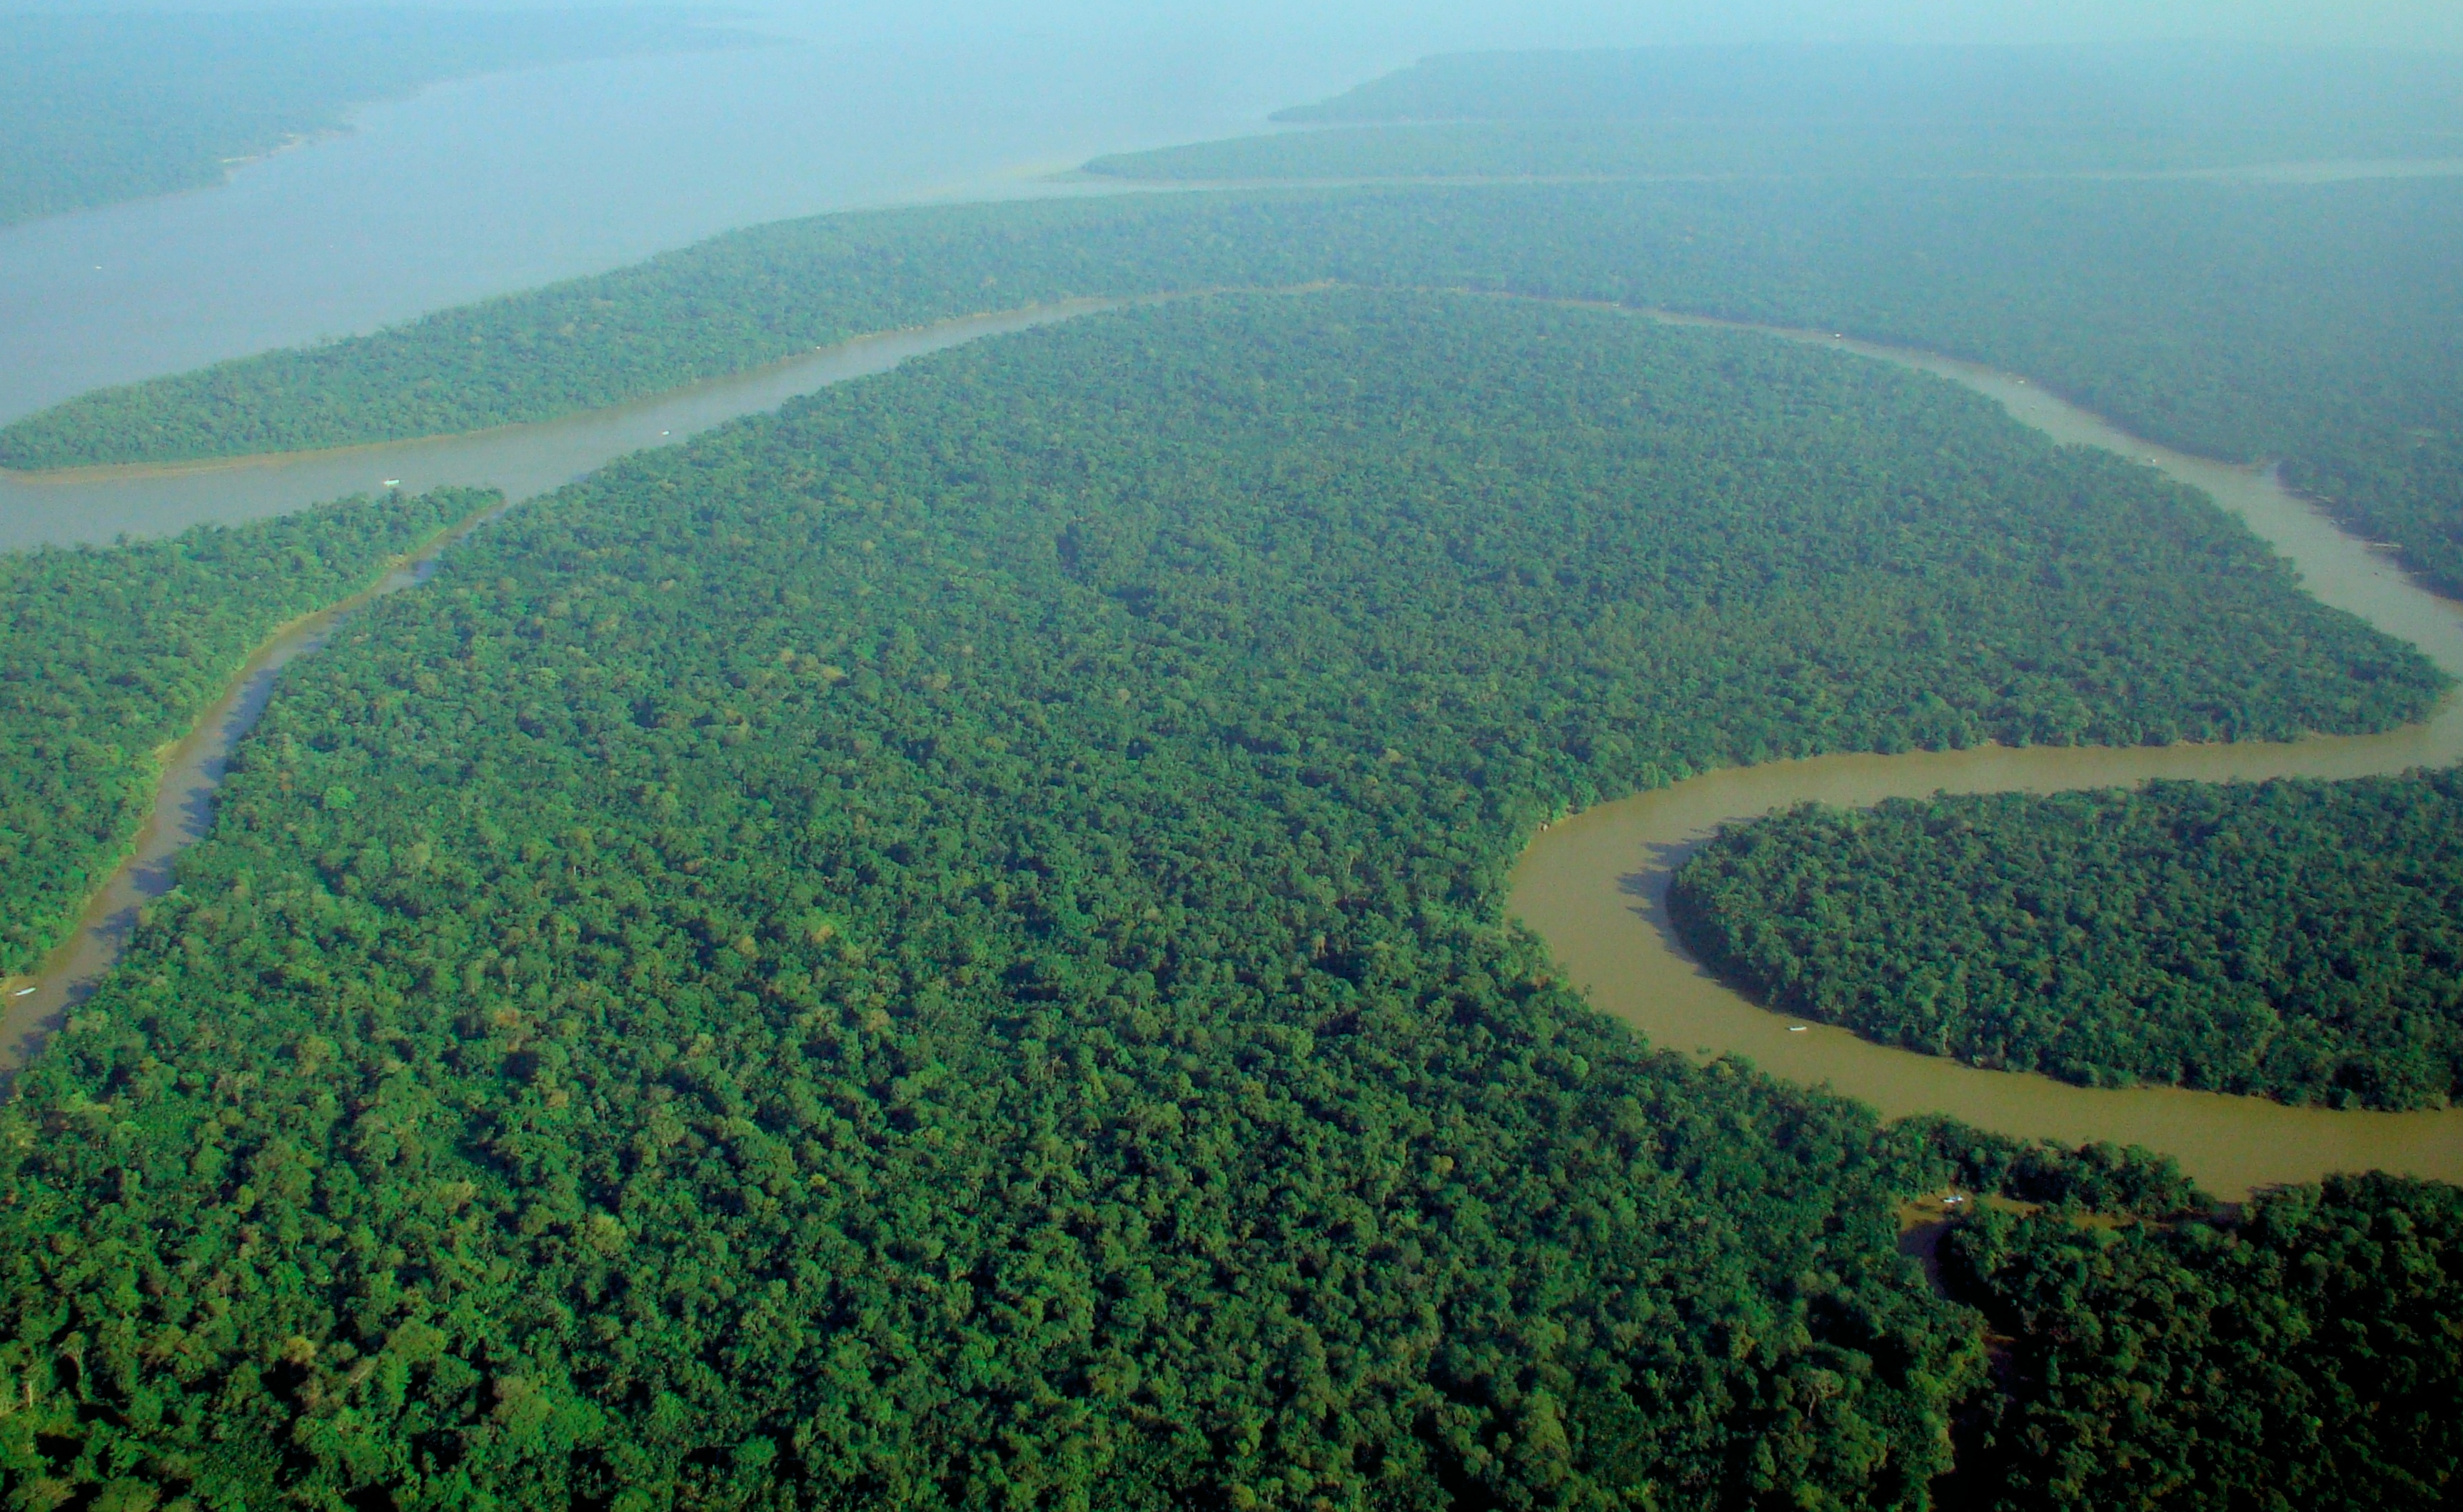
Forest and winding river channels in the Brazilian Amazon, photographed from the air on 9 September 2009. lubasi · Source · CC BY-SA 2.0 · Unmodified.
A net decrease of about 694,000 km²
Area within the selected forest group changed from approximately 6.88 million km² in 1993 to 6.19 million km² in 2023. The difference is approximately 694,000 km², or about 10.1% of the 1993 forest area. This group comprises forest formations, savanna/open forest, mangroves and flooded forest. A continuous green landscape therefore holds different relationships between trees, land and water. Calculated from the official area and transition tablesA net decrease compares the forest area present at the two endpoints. During those decades, places also move out of and back into the forest classes. Annual observations add the sequence that an endpoint comparison cannot show on its own.
Where the forest changes each year
Repeated satellite observations allow the same location to be compared from one year to the next. The official transition table records approximately 36,413 km² changing from forest to other cover in 2021, 37,837 km² in 2022 and 45,997 km² in 2023. Across this full analysis region, the annual area of that transition increased over these three years. Holding the geography and source constant makes the comparison legible.The map adds another question: where does the change occur? It may appear along the margins of a large forest or within its interior. These patterns provide starting points for examining land use alongside local records. MapBiomas supports analysis at different scales, including countries, catchments and protected areas, making it possible to move between a regional picture and a specific place. Collection 6 methodology
Why forests shrink: a change in how land is used
What replaces a forest helps explain its loss. MapBiomas’ analysis for 1985–2022 reports that roughly three quarters of converted natural vegetation in its Amazon study region became pasture. Land for cattle is therefore a major driver. Conversion is prominent across Brazil’s southern forest frontier, while agricultural expansion stands out in Bolivia’s Santa Cruz department. MapBiomas land-use analysisCropland and mining add other pressures. MapBiomas’ report covering 1985–2023 describes natural vegetation replaced by pasture, crops including soy and oil palm, and gold-mining sites. These regional differences connect forest change to the kinds of production taking place on the land. MapBiomas Collection 6 report
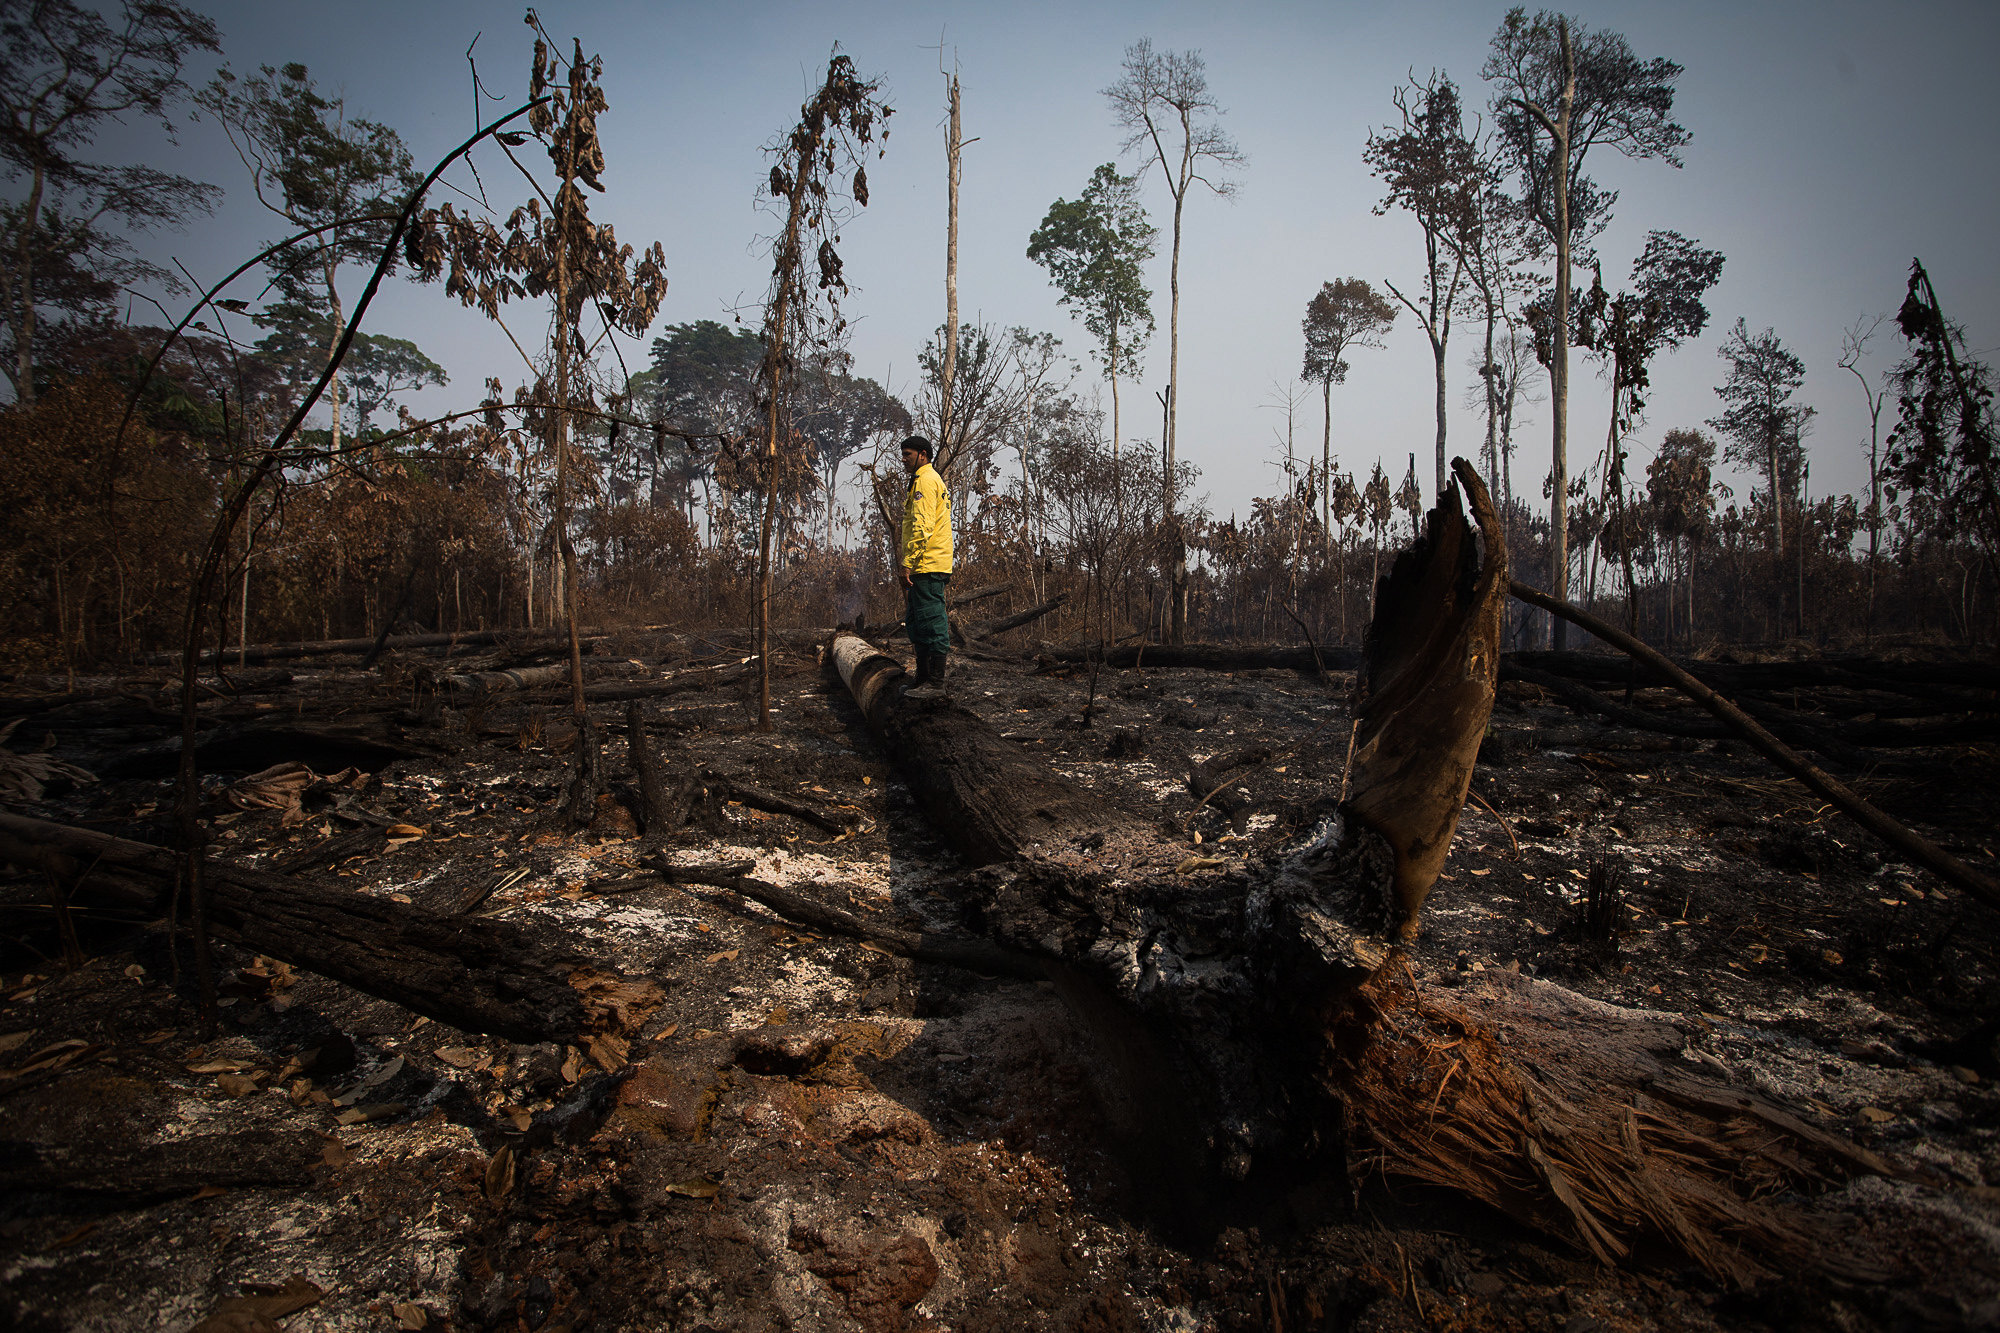
An Ibama firefighter inspects a cleared and burned forest area in Apuí, Amazonas, Brazil, on 11 August 2020. Bruno Kelly / Amazônia Real · Source · CC BY 2.0 · Unmodified.
The photograph brings the map down to a cleared and burned site, where a firefighter examines the ground. Combining annual cover changes with land-use records can help trace what a particular patch of forest became.
Forest area also shapes the movement of water
Trees take up water from the ground and return it to the atmosphere through their leaves. This evapotranspiration contributes moisture that can later fall as rain. A 2023 study compared tropical forest loss with precipitation observations and found reduced rainfall associated with forest loss at broad spatial scales. Forest cover is consequently relevant both to life within the canopy and to water moving beyond it. Smith, Baker & Spracklen, Nature (2023)River communities and agricultural landscapes depend on the condition of land and water. Extending the view across national borders brings neighbouring forests and catchments into the same frame. The 30-year record shows both the continuity that remains and the places where change gathers. It creates a geographical starting point for asking how land is used, and which forests will remain through the seasons ahead.
Data and representation
Scope: MapBiomas Amazonia / RAISG analysis region, about 8.42 million km²: eight countries and French Guiana. 31 annual maps, 1993–2023. The region follows country-specific definitions and includes all three Guianas and the Araguaia–Tocantins basin, among other areas.Forest definition: Collection 6 classes 3/4/5/6: forest formation, savanna/open forest, mangrove and flooded forest. Includes primary and secondary forest. Plantation class9 and oil palm35 excluded; Ecuador class3 can include plantations.
Map metric: A: spatial union of annual forest-to-other transitions since 1994, retained after regrowth. C: 1993 forest classified as other observed cover in the selected year. Includes natural changes and classification uncertainty.
Area metric: Headline net decrease uses COVER_RAISG forest stocks. Bars use TRANS_RAISG forest-to-other areas for 1994–2023. Worksheet versions0-2.1 and0-2.2 do not exactly reconcile stock changes with net transitions. Values are preserved separately as published.
Display: Native classification:30m. Display imagery:2400×2093 samples over a shared extent (about0.01625°, or1.81km at the equator). Annual changes compare corresponding samples. Quantitative areas use official statistics.
Alignment and missing data: Common observed-data mask for all31years. Classes0/27 excluded and transparent. All layers share extent, projection and clipping.
Source: MapBiomas Amazonia Collection 6.0 · Official area and transition tables · CC BY 4.0. Regrouped and redrawn by SORAH.
Borders and labels: Natural Earth country borders, country/region names and selected cities. 5° graticule; colliding labels suppressed. Natural Earth: public domain.
Film: 20 seconds, 1993–2023. Current forest cover with the spatial union of annual forest-to-other transitions since 1994. Each affected display sample remains orange, including after regrowth; repeated losses are painted once. Bars retain official annual gross transition area, a separate metric from the orange spatial footprint. Close framing clips map edges.
Sources
Author
SORAH Editorial
October 18, 2026


.jpg)