Published on 16/October/2026 · Nature
Forest biomass: adding the weight of trunks and branches to a green map.
By SORAH Editorial
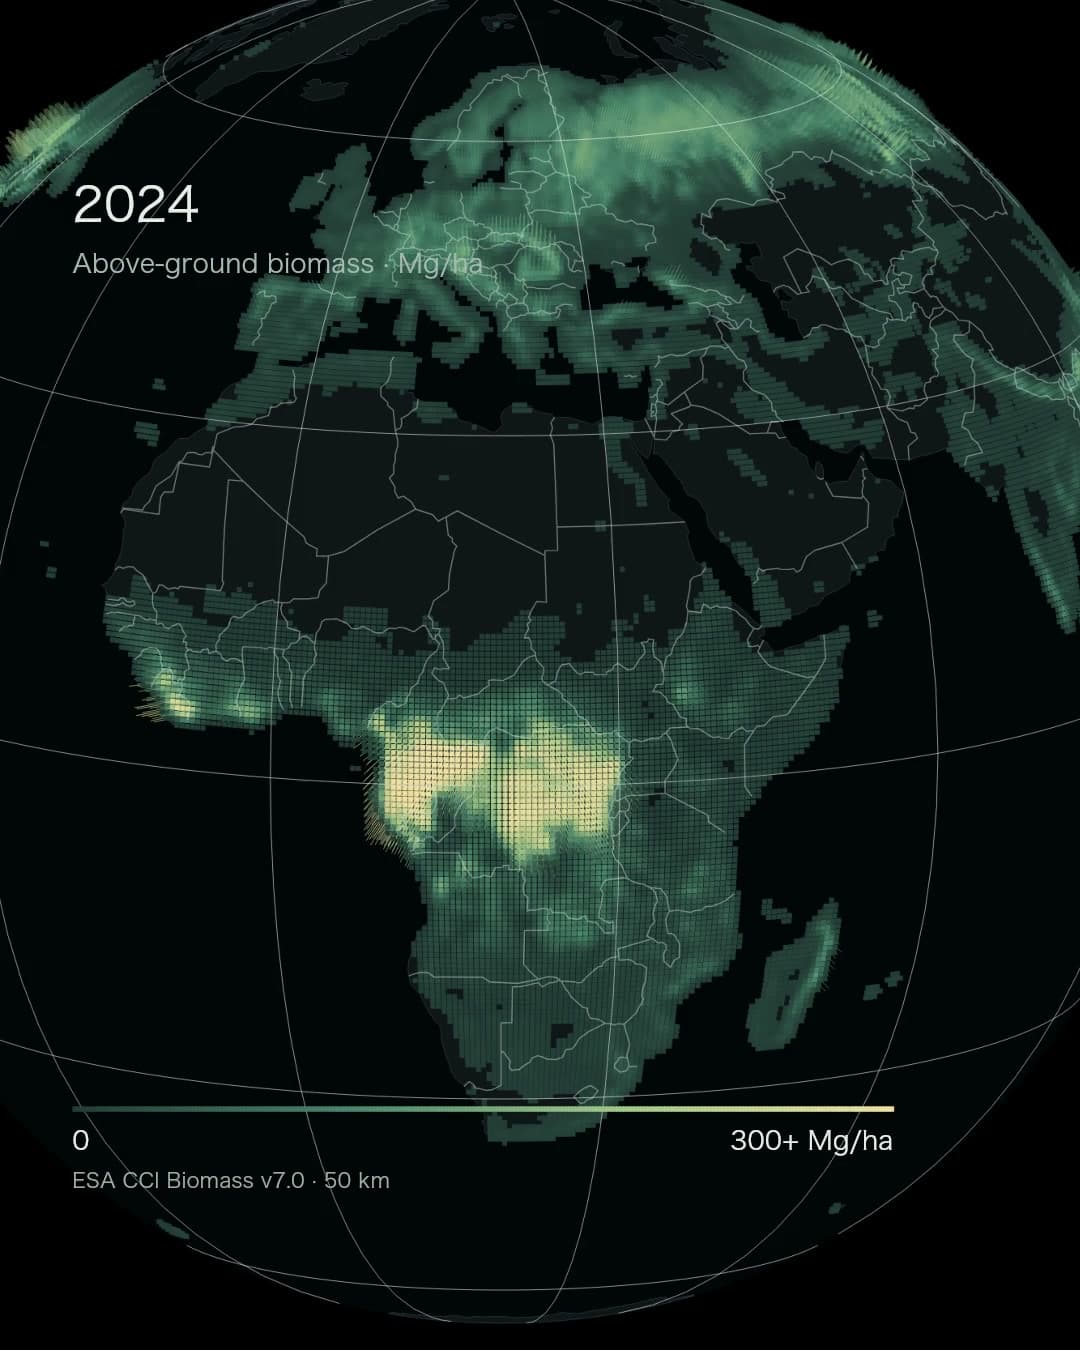
A global view of above-ground woody biomass in 2024.
From above, a forest first appears as green cover. Below the canopy, trunks thicken, branches extend and trees compete for space. Biomass offers another way to read that landscape: through the dry mass of living wood stored on the land.
Weight per hectare
The unit is Mg/ha, equivalent to tonnes per hectare. The ESA CCI Biomass v7.0 release, published on 21 May 2026, includes estimates through 2024. This film holds 2024 constant while the viewpoint moves across the globe. Santoro & Cartus, 2026The official aggregated product used here has 0.5° cells, nominally about 50 km near the equator. Its denominator is the whole cell area. The density therefore reflects both the extent of wooded land within a cell and the mass held by its trees. A bright area invites a closer look at the forests and land uses behind that estimate.
A hectare can hold many different forests
A square 100 metres on each side covers one hectare. It might hold slender young trees, large spreading trunks, or a mixture of woodland and open ground. Similar amounts of green cover can contain different dry masses. Estimating mass from wood volume also requires information such as wood density. The US Forest Service maintains linked models of tree volume, biomass and carbon for its forest inventory. US Forest ServiceA simple calculation illustrates the whole-cell denominator. Suppose woodland averaging 200 tonnes per hectare occupies half a cell, and the other half has zero above-ground biomass. The cell average would be 100 tonnes per hectare. This hypothetical example shows why a mapped value reflects both the amount within wooded land and the fraction of the landscape that woodland occupies.
People measuring trees, satellites measuring landscapes
Field measurements record the dimensions and condition of trees. Connecting that knowledge with satellite observations underpins large-scale estimates. The photograph shows tree measuring and marking in the Apache–Sitgreaves National Forests in Arizona.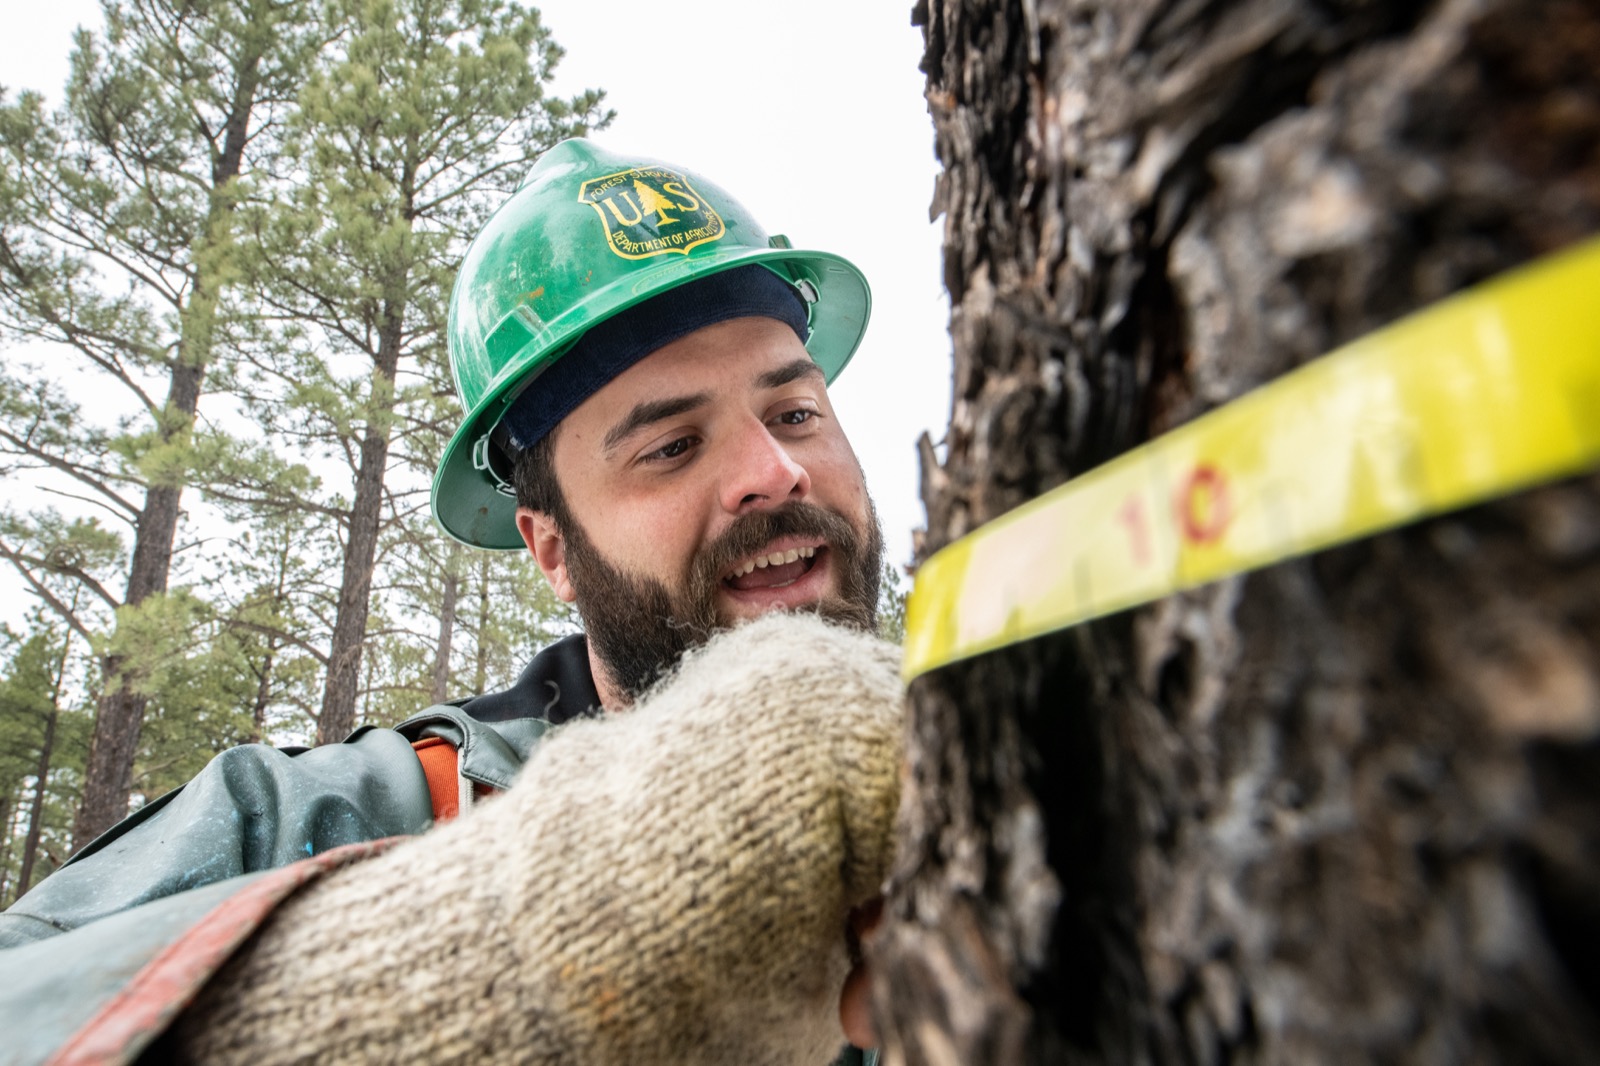
Measuring a tree in Apache–Sitgreaves National Forests, Arizona, USA. 6 December 2018. Lance Cheung / USDA · Public domain · US federal work · Source
The CCI product combines observations from missions including ALOS, ALOS-2, Envisat and Sentinel-1. Radar contributes information about woody structure alongside other observations. Estimates are accompanied by uncertainty, allowing the confidence in a value to be considered with the value itself. ESA CCI Biomass
Laser observations add another dimension. NASA’s GEDI instrument on the International Space Station uses returning laser light to measure the vertical structure from canopy to ground. Height information helps describe how vegetation occupies space. GEDI mission overview Field measurements, radar and laser observations each contribute different evidence. The person measuring a trunk and the instrument passing overhead are investigating the same landscape from very different distances.
The amount stored, and the amount changing
As trees grow, they retain some of the carbon taken from the atmosphere. Biomass provides a basis for investigating this accumulated material. Thinking of the quantity present as a stock, and changes over time as flows, helps distinguish two useful questions about a forest. ESA’s Biomass mission is designed to improve understanding of these quantities and their role in the carbon cycle. ESA: forests and climateThe same present-day value could prompt different questions in a growing forest and in a landscape recently affected by harvesting or fire. Earlier imagery and management records help establish that history. Comparing annual estimates together with their uncertainties can then place the current map within a longer trajectory. Protecting existing stocks and supporting recovery become more concrete questions when that history is understood.
A new generation of forest observations
ESA launched its Biomass satellite on 29 April 2025. Its long-wavelength P-band radar is designed to investigate forest structure and improve understanding of the carbon cycle. The 2024 map shown here belongs to the CCI record built from earlier missions; new observations will extend the questions researchers can ask. ESA Biomass missionThe first images released in June 2025 included forests in Bolivia, Brazil and Indonesia. The long radar wavelength explores structures beneath the canopy, extending the view into the forest interior. ESA, 23 June 2025 As observations develop, they can help connect areas visited by field teams with wider landscapes. Researchers, forest managers and people using wood as a resource work across different timescales. A shared measure of forest stocks gives them a way to ask related questions.
Reading beyond the return of green
Adding weight to forest area makes the accumulated wood of a landscape visible. It invites questions about the time involved in planting, protecting mature trees, harvesting and growing the next forest. Knowing the present stock is one way to begin following those longer processes. Each cell is an invitation to look closer at the forest on the ground.Data and representation
ESA CCI Biomass v7.0, Santoro & Cartus (2026), DOI:10.5285/6429d1aafe1e43b9b414e4a5a7f8b903; acknowledged under ESA data terms.Official 50 km aggregate, 0.5° spacing. Explorer: 18 years, 2005–2012 and 2015–2024. Film: fixed 2024. 51,190 retained cells; cells zero in every year omitted. Annual zero remains valid.
Above-ground dry woody biomass per whole pixel area, Mg/ha; excludes roots and stumps. No carbon conversion. Short strokes visually emphasize mass.
Uncertainty uses provider agb_sd, standard deviation in Mg/ha. Temporal change assessment requires the change product’s uncertainty and quality flags. Natural Earth geography is public domain.
Sources
Author
SORAH Editorial
October 16, 2026