Published on 16/October/2026 · Nature
Wildfire as a landscape: tracing the shapes of the fire season.
By SORAH Editorial
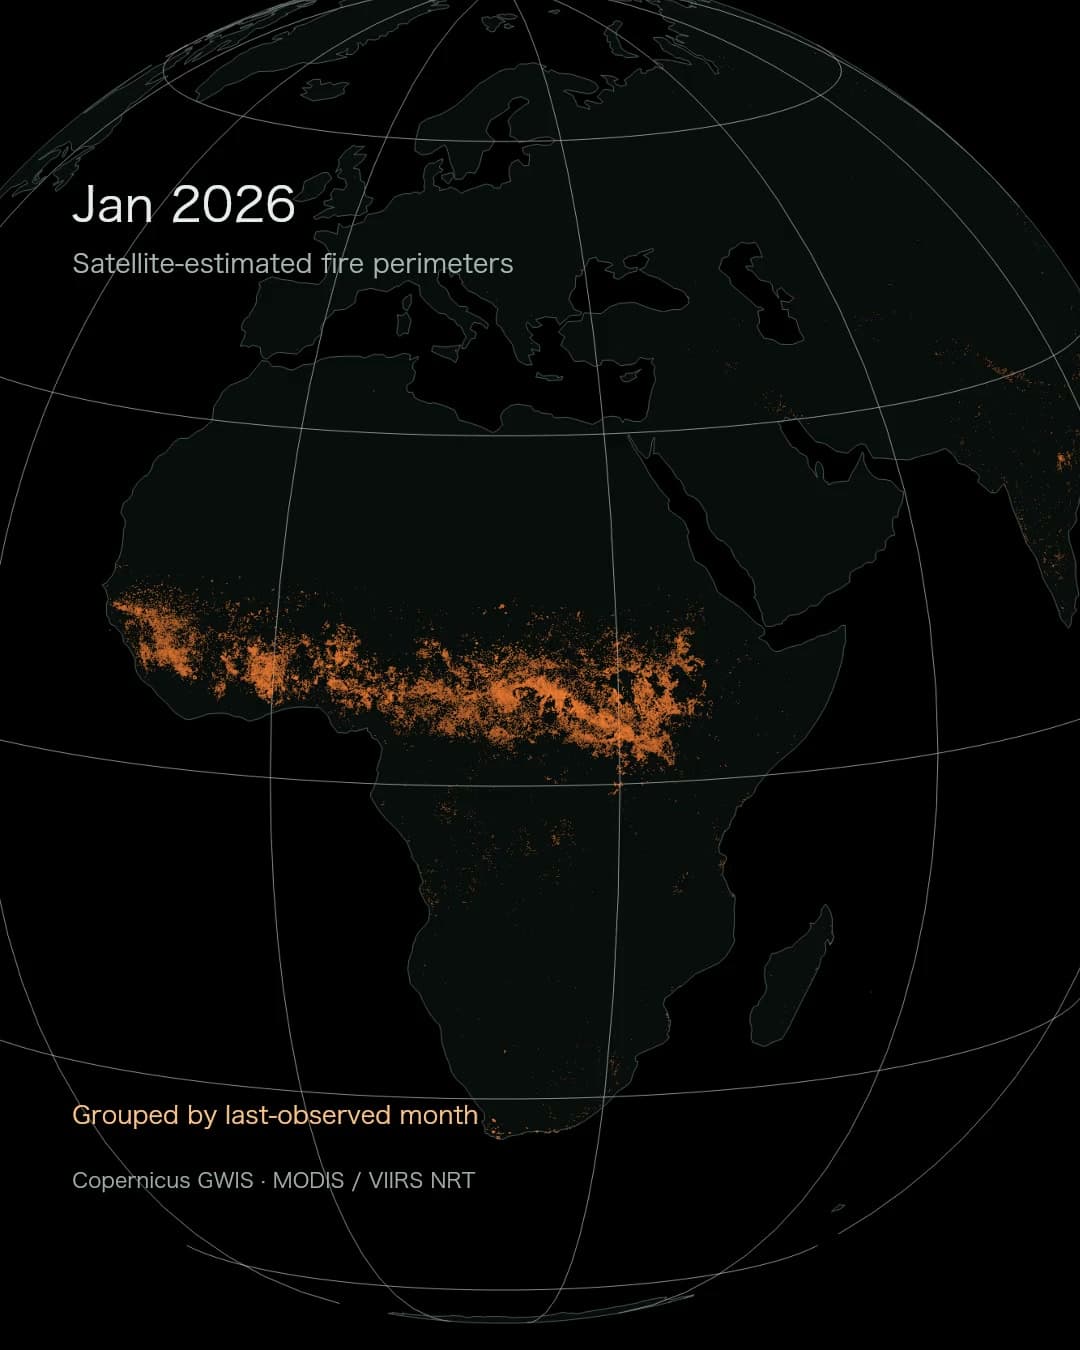
Monthly distributions of satellite-estimated fire perimeters across the world in 2026.
A point becomes a shape on the land. Some fire perimeters are elongated; others are intricate or clustered. Within one country, events differ in size and season. Arranging the 2026 record by month makes it possible to follow that geography at the scale of actual footprints.
From detected heat to a perimeter
The Copernicus Global Wildfire Information System, GWIS, combines thermal anomalies detected by MODIS and VIIRS to estimate fire-event perimeters. MODIS active-fire pixels are approximately 1 km across; VIIRS provides 375 m detections. These complementary observations support the delineation of fire activity. GWIS methodologyThis work contains 769,722 events whose last observation falls between 1 January and 15 October 2026. Each month displays the event footprints available at acquisition, grouped by their final observation month. October is a partial period through the 15th. This dating convention is essential to reading the sequence.
Three conditions behind a fire season
Fuel, weather and topography shape fire behaviour. The amount and moisture of dead grass or branches, wind and humidity, and the slope of the ground combine to influence how readily fire spreads. The US National Park Service describes these as the three sides of a fire-behaviour triangle. NPSVegetation that grew during wet months can become fuel as it dries. Following the map through the months invites a parallel look at rainfall and dry seasons. Within a single country, climate and terrain vary, along with the periods when preparation is most urgent. The global sequence provides a broad view to compare with regional weather and event records.
Forests, grasslands and working land
Global fire observations include forest fires, grassland fires and land-management burning. The US National Park Service describes fires in vegetation as wildland fires, distinguishing wildfires from prescribed fires. Looking at the land cover and local history behind a perimeter helps explain what happened there. NPS fire types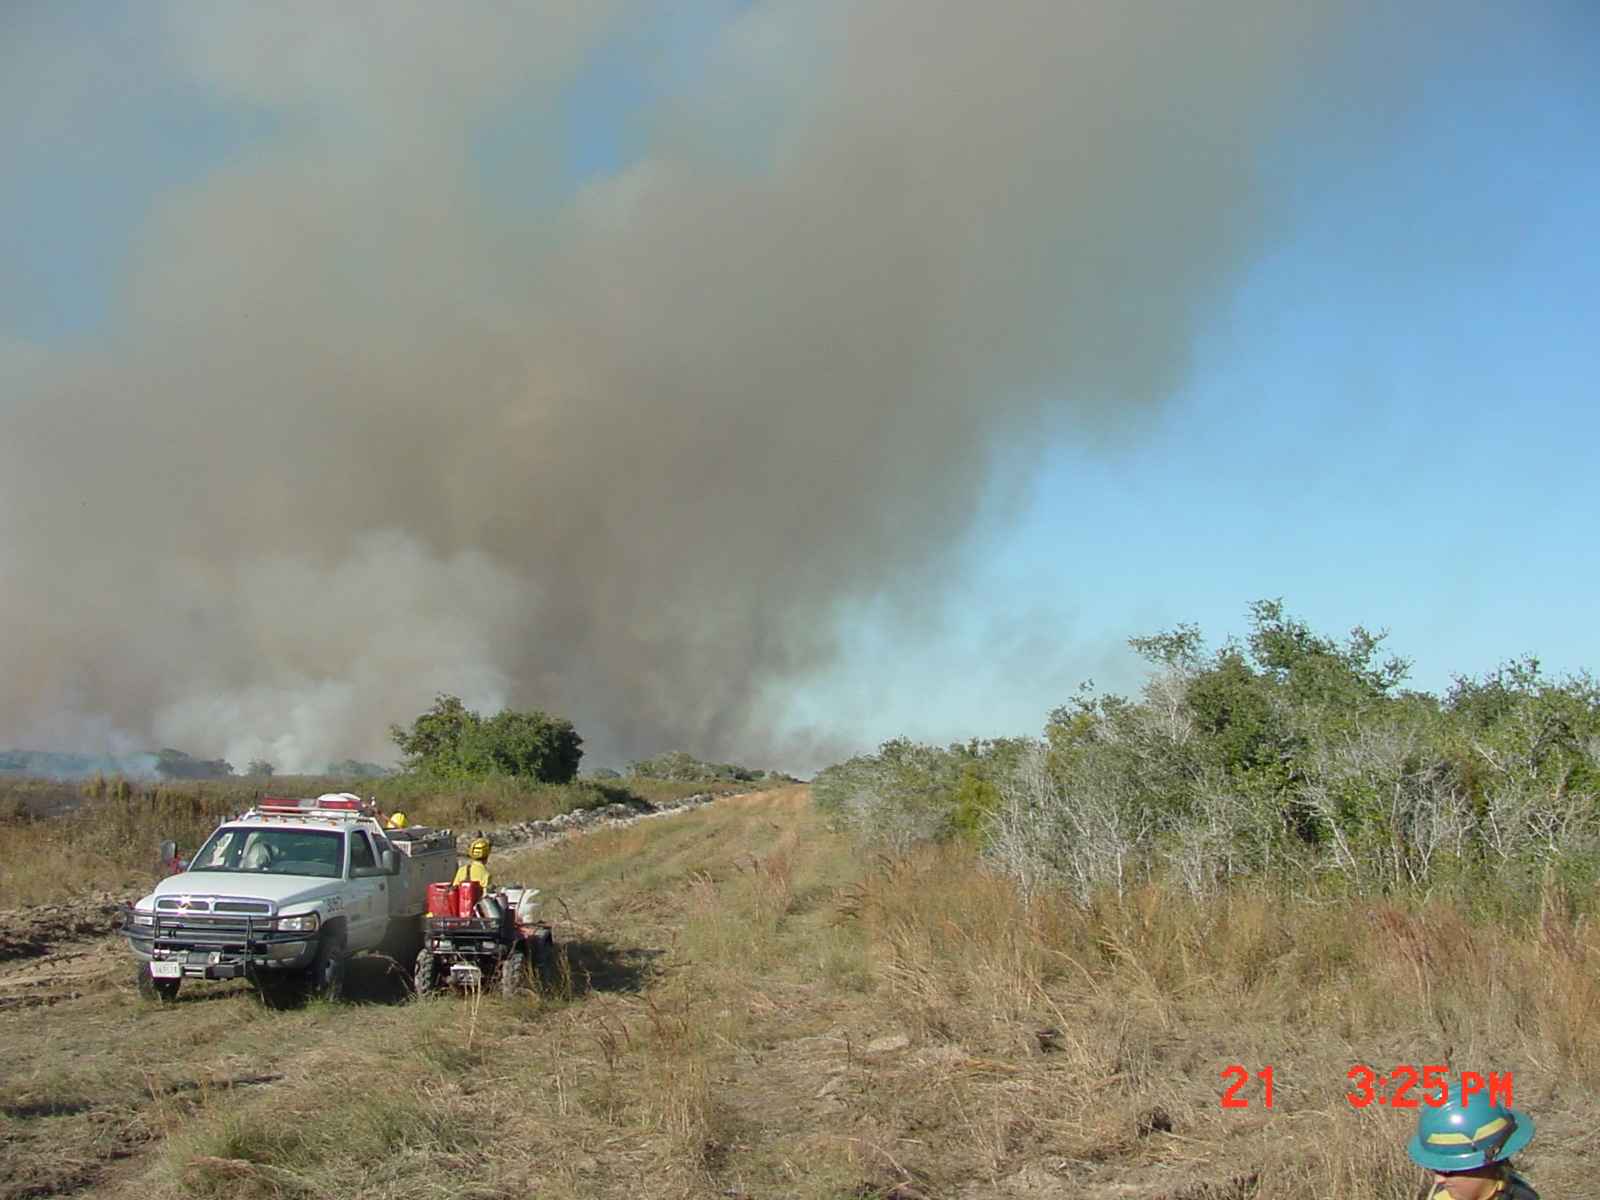
A prescribed burn in an oak savanna, USA. Date and exact location are not recorded by the source. U.S. Fish and Wildlife Service · Public domain · US federal work · Source
Extent, behaviour and lasting effects
Several measurements help describe a fire. Perimeter area indicates its mapped extent. Energy released during burning and subsequent effects on vegetation or soil require their own observations. At Yosemite National Park, fire ecology considers type, intensity, frequency, severity, season, size and spatial distribution together to describe a fire regime. NPS: Yosemite fire ecologyThe orange shape therefore opens a more detailed investigation. Where did tree crowns remain? Where did ground vegetation change? How close were homes or roads? Combining the footprint with land-cover information and field surveys brings the question from a national total down to specific places where a response may be needed.
Keeping fire away, and managing its return
In parts of the US Midwest, periodic fire helps maintain grasslands and savannas. Managers use prescribed burning under specified weather and fuel conditions to limit tree encroachment and support plant growth. NPS Heartland fire ecologyPerimeters drawn in the same colour may encompass very different relationships with fire: a threat close to homes, an agricultural practice or a planned ecological intervention. Satellite coverage supplies a broad, consistent view. Local records add the circumstances needed to interpret an event and decide how to respond.
After the flames, what the rain carries
Fire can change what happens during later rainfall. Loss of vegetation and litter, together with changes in soil properties, can increase water flowing over the surface. Storms can then carry sediment and ash into streams, with potential consequences for water quality and reservoirs. USGS investigates these links between burned landscapes, runoff, erosion and water quality. USGSThat perspective draws attention downstream of the perimeter. Which slopes drain towards a river or reservoir? Looking at a fire footprint within its watershed helps identify places to investigate after the flames have gone. Following vegetation recovery and the material carried by successive storms extends the story beyond the month of the event.
Returning through the seasons
A monthly sequence broadens the view from an individual event to patterns across regions. A longer record could also follow how often fire returns to the same land and how vegetation responds between events. Frequency and ecological response together help sharpen questions about management and future monitoring.After looking across the globe, return to one footprint. Compare its shape with the terrain and investigate the decisions people faced there. Moving between a consistent satellite view and local experience makes the relationship between fire and a particular landscape easier to understand.
Zooming in turns an area statistic back into a place. What vegetation grows there, who lives nearby and what might return next season? Following the shapes of fire can lead beyond the burning itself, towards the ways a landscape and its people live with it.
Data and representation
European Commission JRC / Copernicus GWIS, nrt.ba.poly.season; MODIS/VIIRS satellite-estimated perimeters. 769,722 events with final observation dates 1 January–15 October 2026; October is partial.Each monthly snapshot groups acquired event footprints by last-observed month. Areas are provider hectares; summed event areas retain overlaps.
Orange identifies fire footprints. No temperature, intensity, severity or spread-rate scale is encoded. Dissolves are editorial transitions between monthly maps.
Display simplification: at most 0.001°, coordinates rounded to five decimals; 92 invalid source geometries retained without simplification. Detection depends on event size and observation conditions. Forest, grassland and agricultural burning can occur in the source.
Natural Earth background is public domain. GWIS attribution and data terms accompany the work.
Sources
Author
SORAH Editorial
October 16, 2026