Published on 18/October/2026 · Nature
Bogong moths: a mountain journey guided by stars
By SORAH Editorial
South in spring, north in autumn. An experiment reveals how Bogong moths use the night sky to orient their journeys.
In southeastern Australia, spring sends Bogong moths into the night towards cool mountain refuges. They spend summer crowded into rock crevices and caves in places such as the Snowy Mountains, then return towards their breeding grounds in autumn. How does a small moth find a destination it has never visited?
A study published in 2025 identified one part of the answer: the arrangement of the stars. Turn the projected night sky, and the direction the moths attempt to fly changes with it. Light far above the landscape becomes useful information for a journey through it. Dreyer et al., Nature (2025)
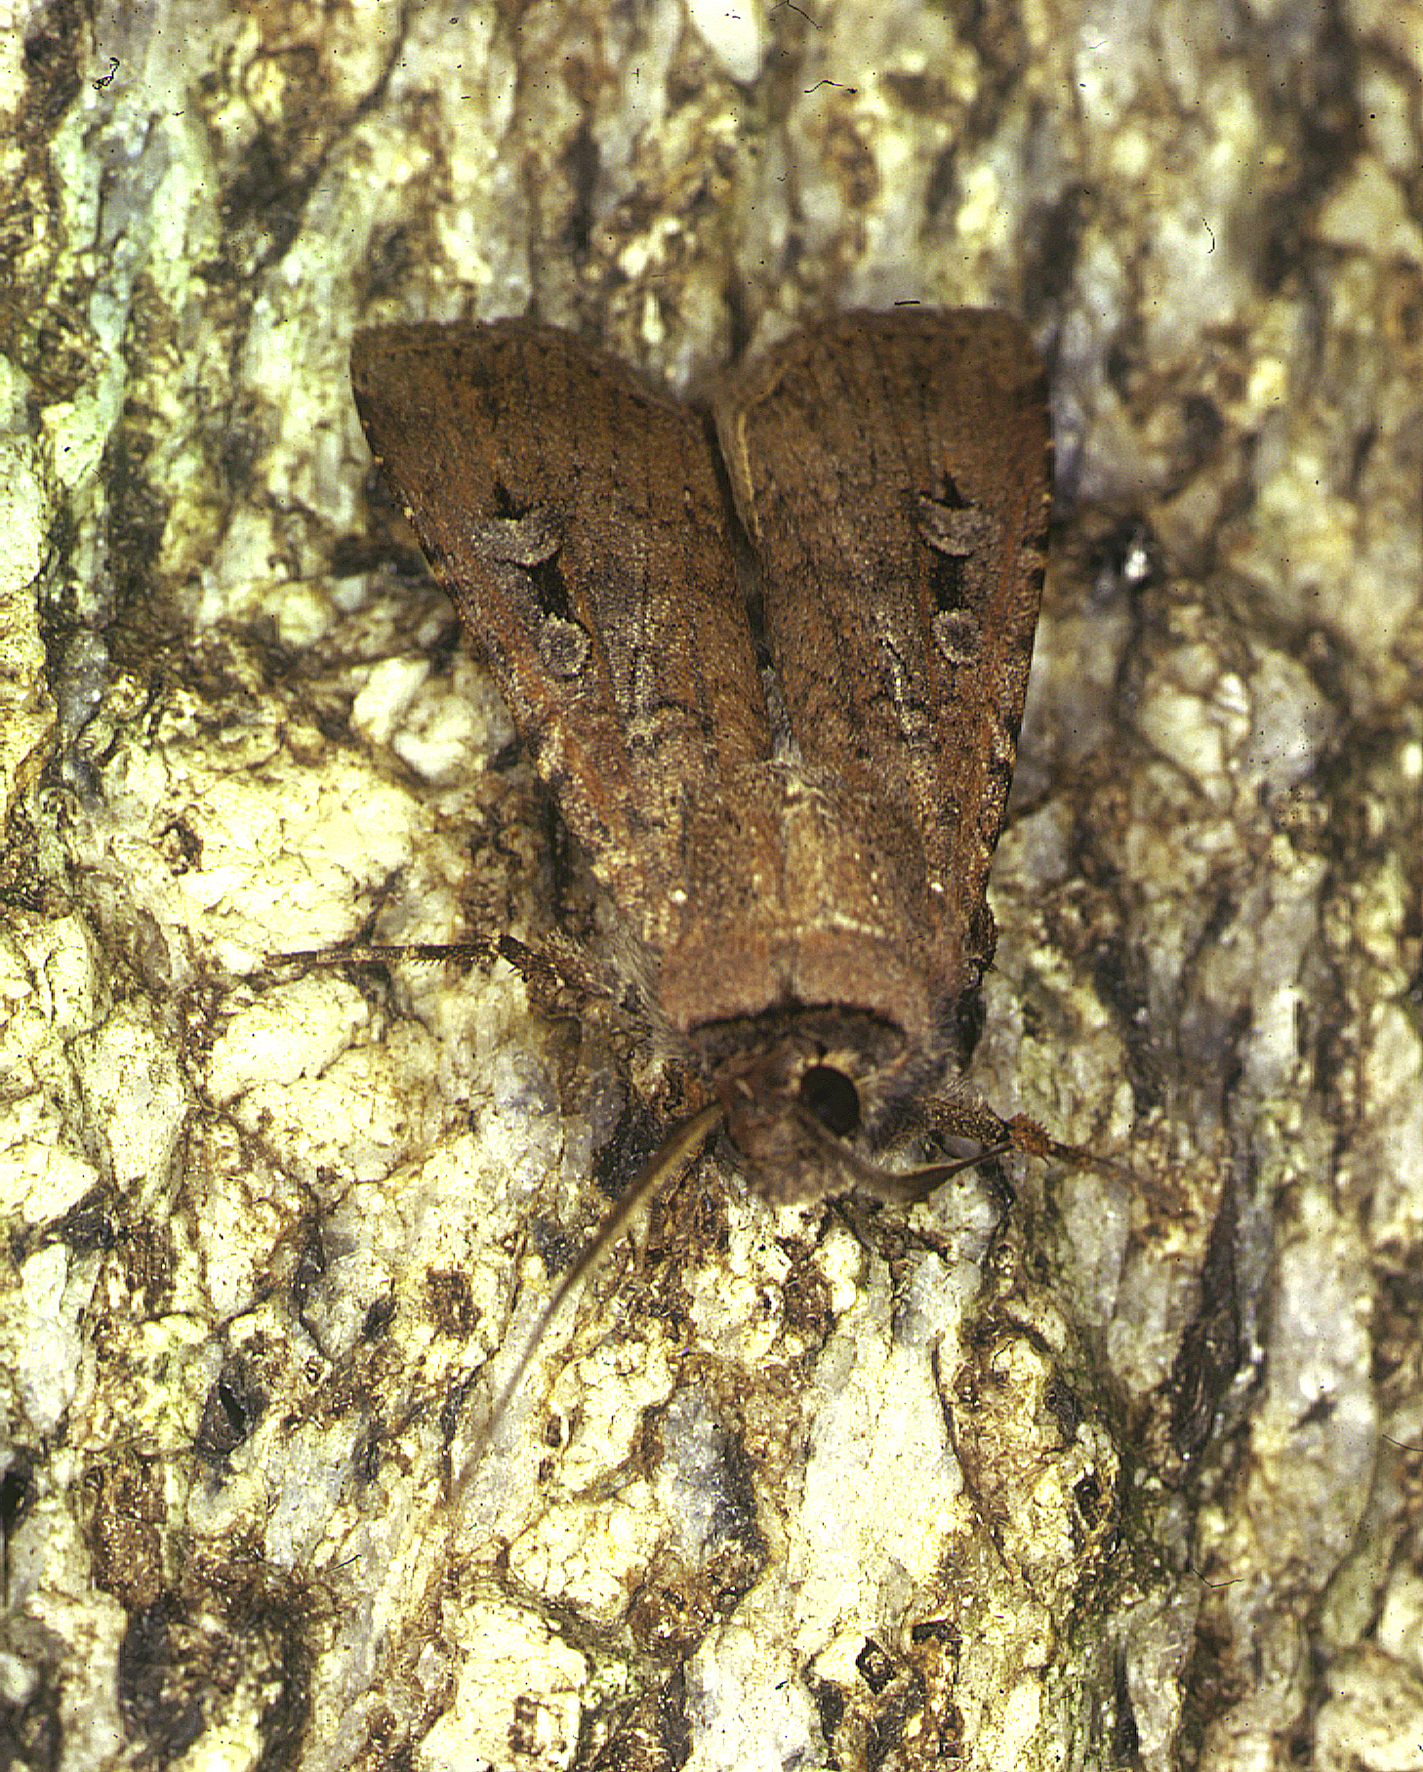
A Bogong moth (Agrotis infusa) on bark. Source date: 1 September 2000; precise location unspecified. Entomology / CSIRO · Source · CC BY 3.0 · Unmodified.
A season spent in the mountains
Bogong moths move between lowland breeding areas, including parts of New South Wales and Victoria, and the Australian Alps. Some migrations reach roughly 1,000 km. In the mountains, the moths gather in sheltered cracks and spend the hot season in a state known as aestivation. Seasonal journeys often associated with birds also take place on the scale of an insect only a few centimetres across. Australian National UniversityThe direction needed to reach a mountain depends on where a moth begins. Returning in autumn adds another requirement: the appropriate direction changes with the season. The relationship between origin, time and heading is central to the navigational problem.
Keep the ground still. Turn the sky.
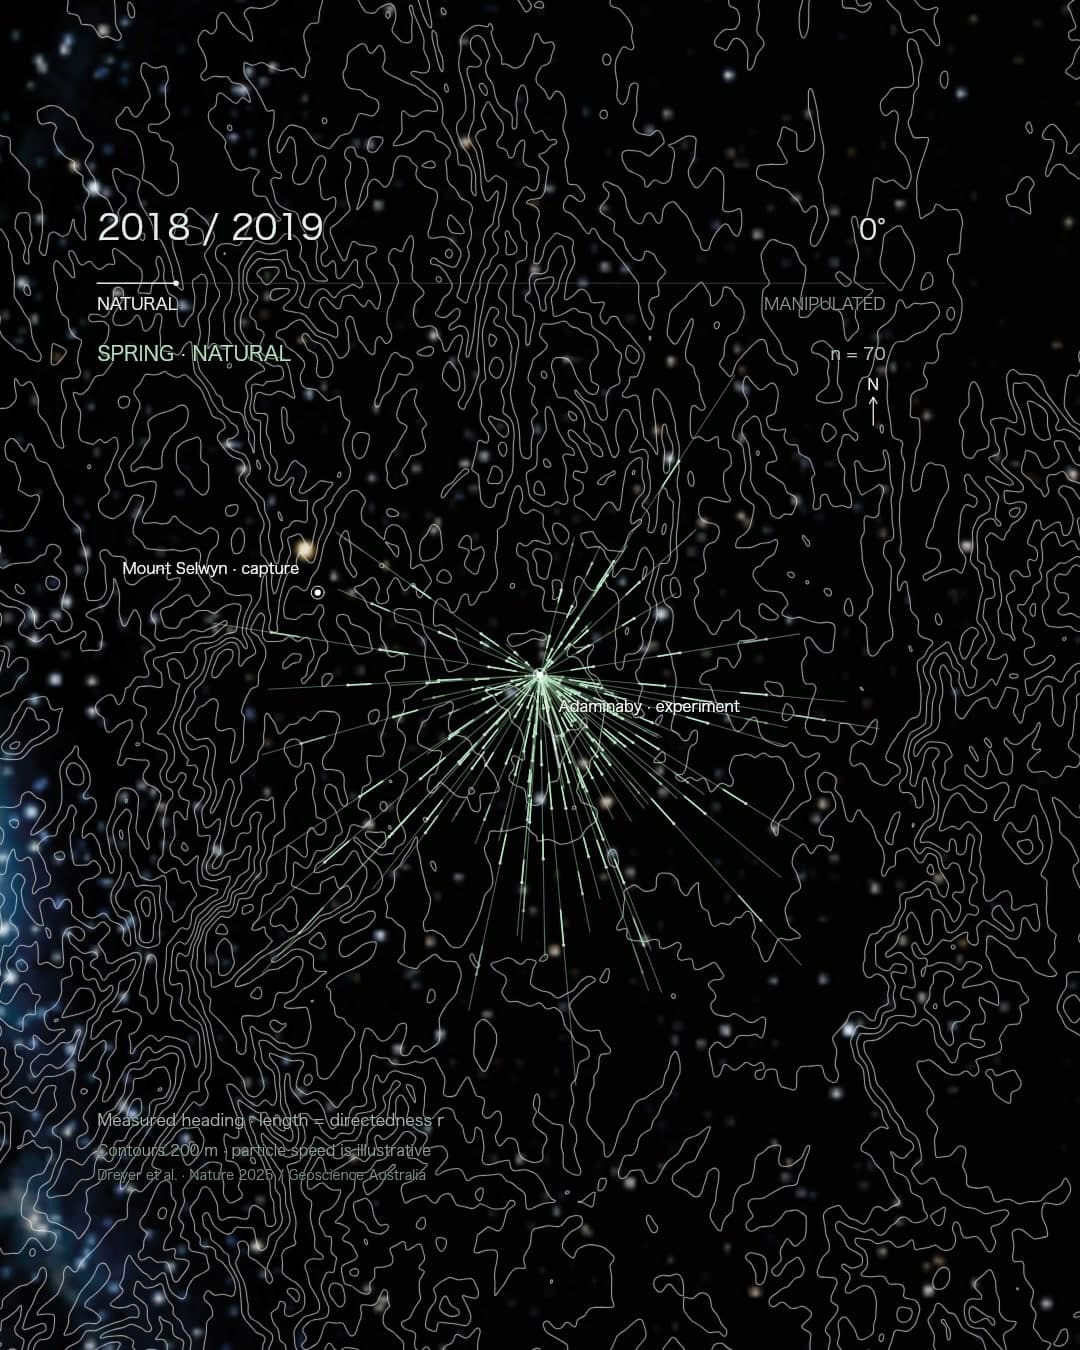
Researchers tethered moths in a flight simulator and recorded their orientation under projected skies. They cancelled the magnetic field to isolate the celestial information, then compared natural, 180-degree-rotated and randomized star patterns. The 2018–2019 records used here come from spring and autumn experiments at Adaminaby, New South Wales. Open experimental datasetUnder the natural sky, spring moths tended southward and autumn moths northward. Rotating the sky nearly reversed the average headings; disrupting the star arrangement weakened directional organization. The result makes the pattern of the sky meaningful, beyond the presence of light alone. Comparing bearings above the same terrain helps locate the experiment: moths at one place choose different headings when the celestial conditions change. Lund University research account
A journey that feeds another life
The moths’ arrival also matters to animals waiting in alpine habitat. The mountain pygmy-possum, a small marsupial living among high-country rocks, feeds on Bogong moths. Australia’s environment department identifies reduced food availability, including moths, among the threats to the species. A flying insect carries nourishment from distant lowlands into a mountain ecosystem. DCCEEW conservation priorities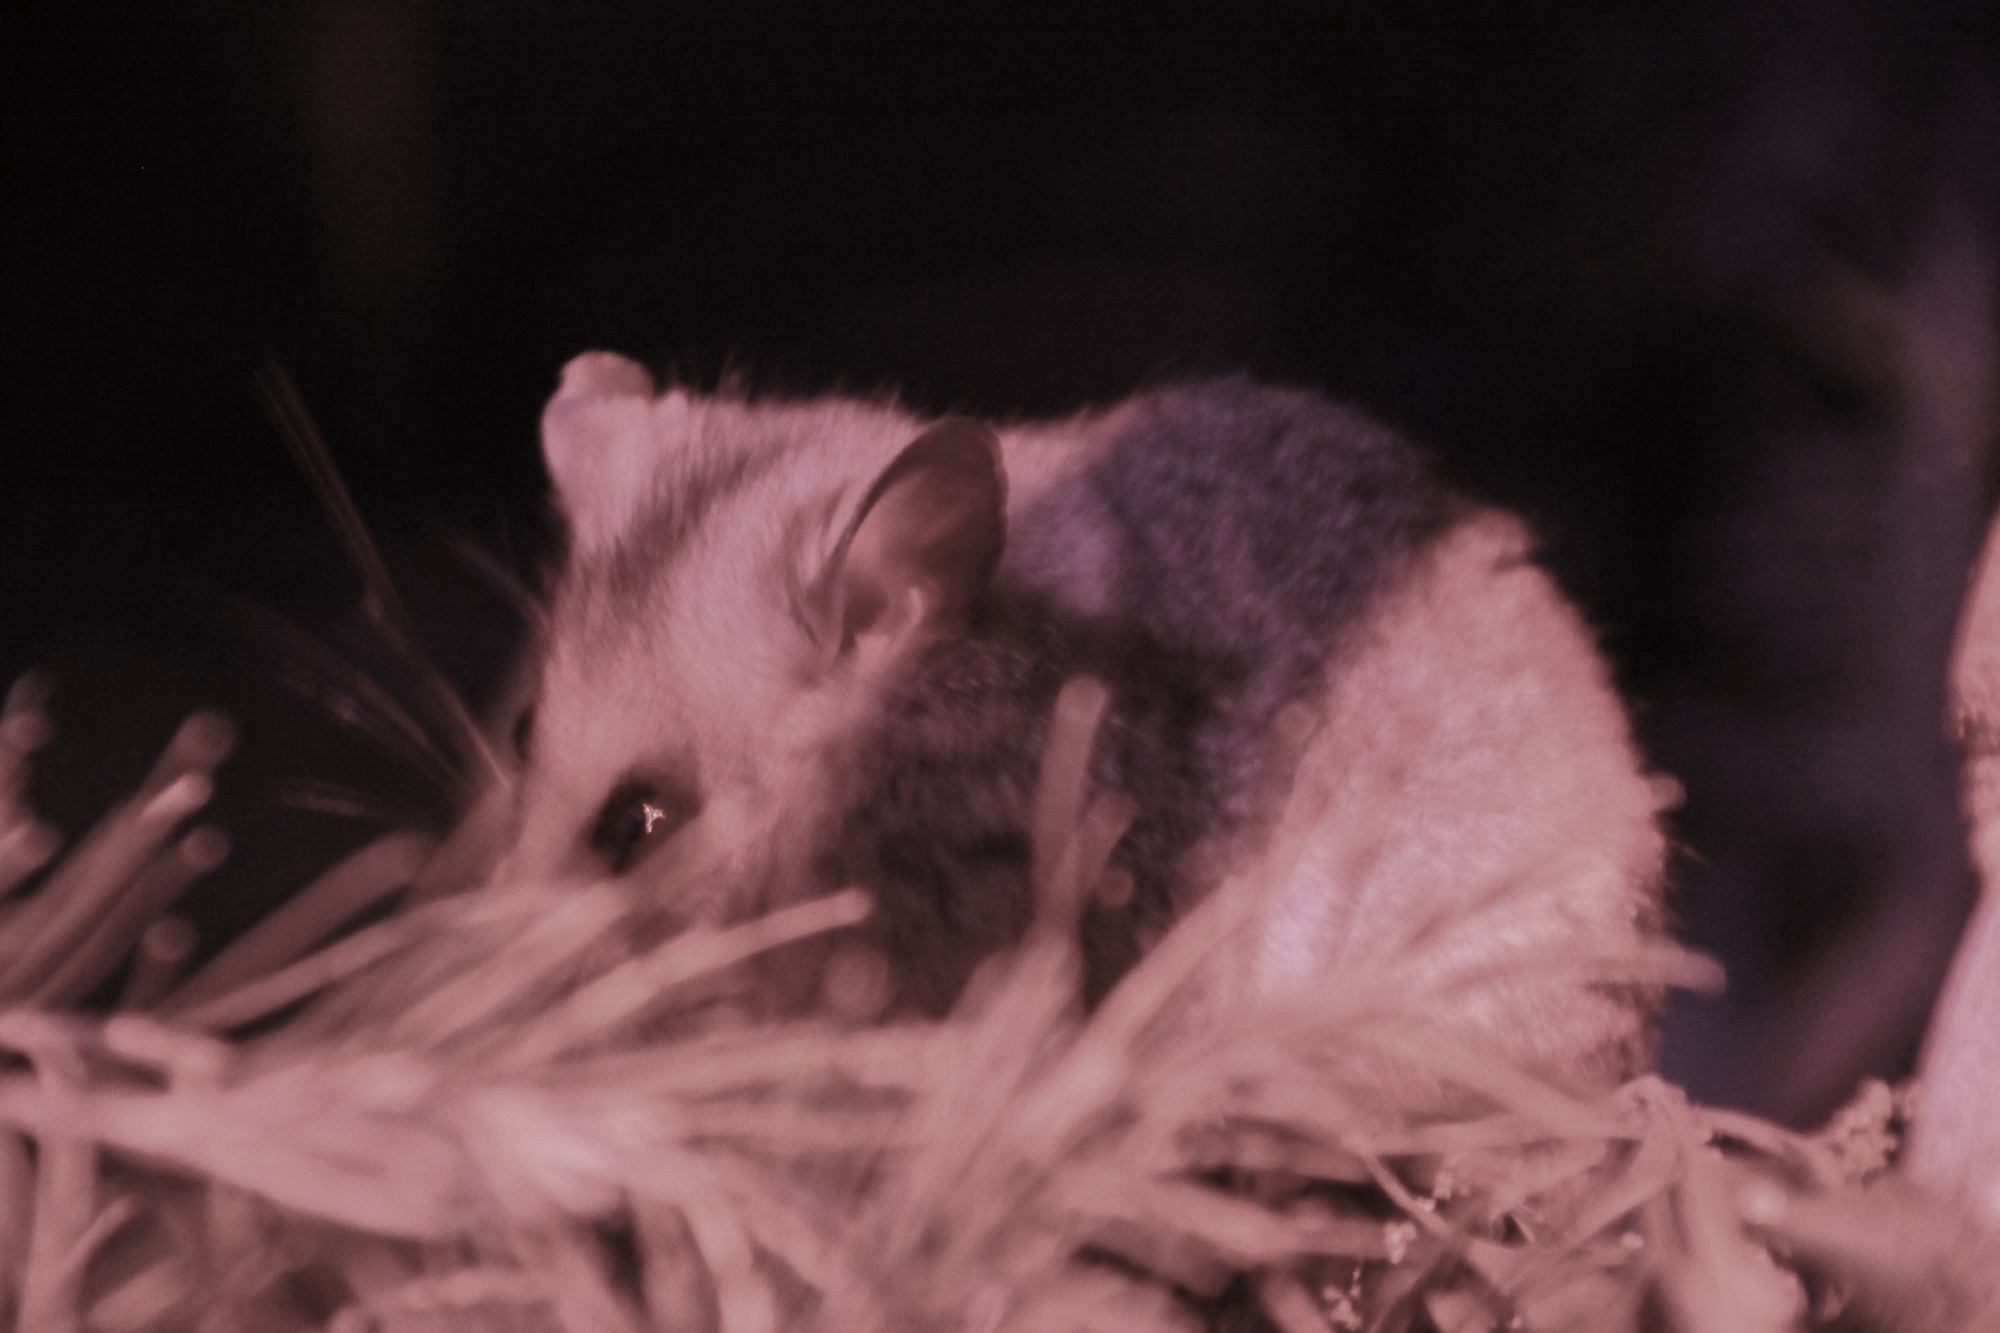
A mountain pygmy-possum (Burramys parvus) in captivity at the Australian Reptile Park, Gosford, on 2 July 2013. John Englart · Source · CC BY-SA 2.0 · Unmodified.
Understanding the moth’s compass draws attention to the entire journey: breeding ground, mountain refuge and the night environment between them. The stars supply information that helps connect these places through the seasons. When moths reach the mountains in spring, that information has consequences for life on the ground.
Data and representation
Sky & ground: Published spring/autumn stimuli from Nature Fig.3a (Stellarium), rotated 180° for the rotated condition. Randomized condition shows the autumn stimulus example in Fig.3b. Sky and ground have different coordinates/scales and are composited with corresponding north. Circular clipping, scaling and opacity adjusted.Scope: Agrotis infusa. Spring/autumn experiments in 2018/2019.
Encoding: North = 0°, clockwise. Direction = individual mean heading; radius = concentration r (0–1). White line = r-weighted mean vector.
Sample: Spring: 70 / 68 / 58. Autumn: 54 / 56 / 49. Individual matching across conditions is unconfirmed.
Geography: Experiment: Adaminaby (36.040°S, 148.864°E); capture: Mount Selwyn (35.914°S, 148.444°E). Lines encode tethered-flight bearing and directedness r. Field routes and travel distances were not measured.
Source: Dreyer et al., Nature (2025) · Figshare v2 · CC BY 4.0. Data redrawn.
Sky source & rights: Dreyer et al., Nature Fig.3; sky imagery Stellarium. CC BY 4.0. Published panels clipped, scaled, rotated and composited with adjusted opacity.
Terrain contours: Geoscience Australia / CSIRO SRTM DEM-S (2000, native ~30m), working grid ~200–247m. Gaussian smoothing of one common elevation surface (sigma 3 pixels, ~600–741m), followed by contour extraction every 200m; all contours share the same color, opacity and width. 25m simplification; contours shorter than 800m omitted. Original DEM and original contours retained. Geoscience Australia · © Commonwealth of Australia · CC BY 4.0 · SORAH derived contours.
Contour rendering: Cartographic generalization for legible ridges and valleys. Closed contours join seamlessly; small corners are rounded during rendering. Coastline omitted; black background and published experimental sky retained.
Heading display: Heading vectors enlarged with one common scale fitted to all six experimental conditions. Arrowheads show measured mean headings; length represents directedness r (0–1). White vector: r-weighted mean. Display enlargement does not convert these values into geographic travel distances.
Film: 20 seconds, one view. Natural spring (0–4s), natural autumn (4–8s), sky rotation (8–12s), manipulated spring (12–16s), manipulated autumn (16–20s). Fixed terrain, site and common bearing scale. Seasons change over time on the same map. Bearings fade during transitions; no intermediate measured bearings are generated. English timeline; illustrative particle speed. Full-frame white 200 m contours, experiment/capture-site labels and a north arrow anchor the geographic context. Film bearings use one common scale near the full-frame edges. Published sky stimulus opacity is 90%.
Sources
Author
SORAH Editorial
October 18, 2026