Published on 19/October/2026 · Nature
Monterey’s kelp canopy through eight Septembers
By SORAH Editorial
Track contraction and recovery along the same coast from September 2017 to September 2024.
A forest rises beside the coast
Kelp forests grow just offshore from California’s Monterey Peninsula. These large brown algae anchor to rock and other material, extend stipes and blades through the water, and form a canopy near the surface. Beneath the bands visible from shore is a three-dimensional habitat where animals move, shelter and feed. NOAA Ocean Today · Underwater forestsResearch published in 2026 by Cavanaugh and colleagues used high-resolution Planet Dove imagery to map California’s kelp canopy in detail. This work follows eight September observations, one each year from 2017 to 2024, along the same coast around Monterey. Cavanaugh et al. · High-resolution Planet Dove data identify local drivers of kelp canopy persistence (2026) Cavanaugh & Cavanaugh · Planet Dove kelp canopy maps (2025)
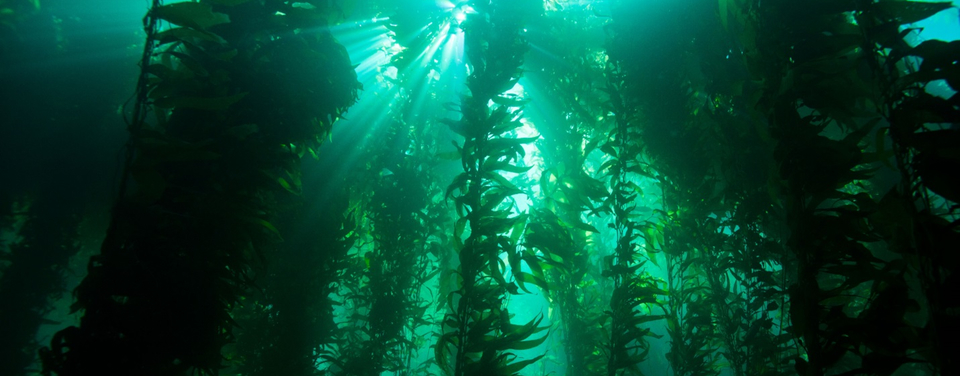
An underwater kelp forest, from NOAA’s Monterey Bay materials. Exact location and capture date unknown. NOAA / National Marine Sanctuaries · Public domain — U.S. NOAA official work · Source · Unmodified.
From about 328 hectares to about 133
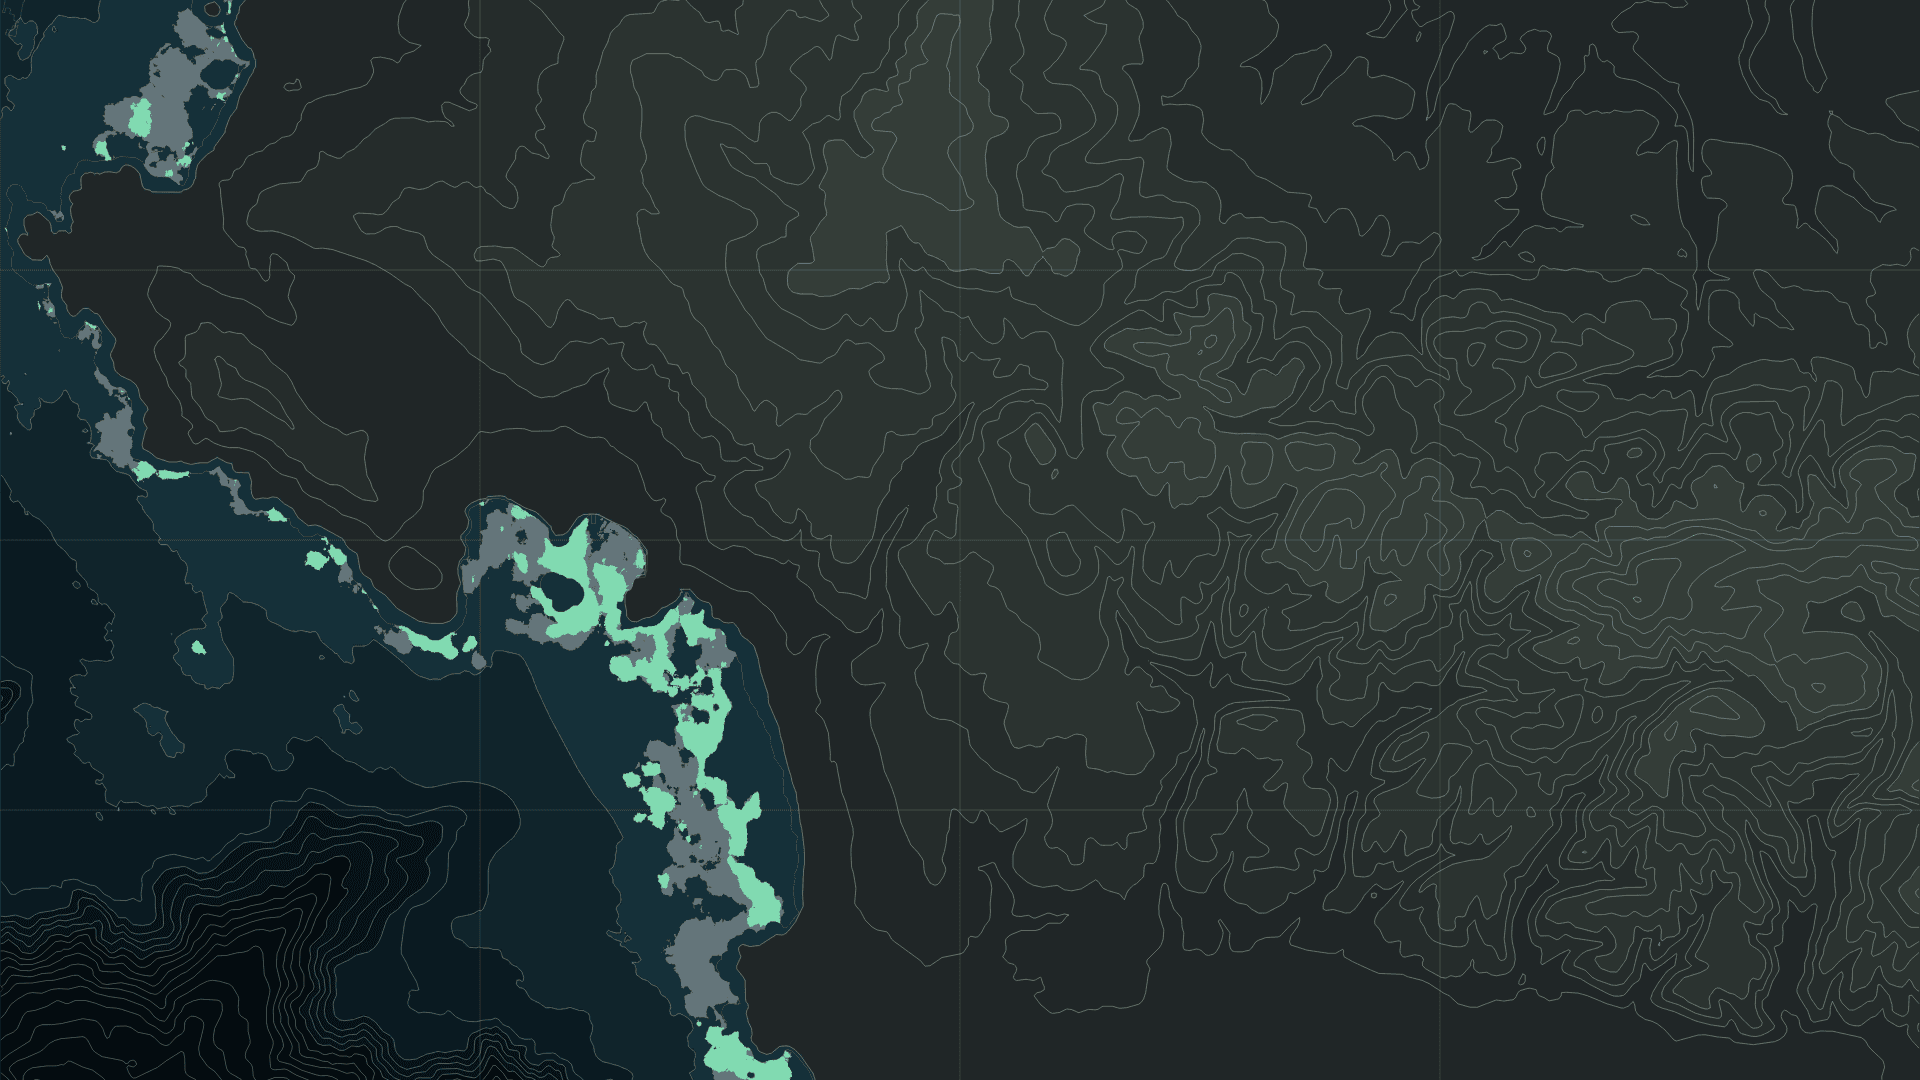
Within the survey footprint shared by all eight years, mapped surface canopy changed from approximately 328.1 hectares in 2017 to 133.1 hectares in 2024: a difference of about 195.0 hectares, or 59.4%. The intervening years include increases. Canopy reached about 375.3 hectares in 2018 and 232.2 hectares in 2022, then increased again from 69.9 hectares in 2023 to 133.1 in 2024. Holding 2017 in grey beneath each selected year in green reveals where contraction and recovery occurred. Cavanaugh & Cavanaugh · Planet Dove kelp canopy maps (2025)Total area conveys the magnitude of change; geometry locates it. Where did a continuous band become interrupted? Which coves or headlands still have canopy nearby? Adding geography to a summary value gives a more specific starting point for investigating temperature, waves and seabed conditions.
The selected window extends from 121.98°W to 121.86°W and 36.49°N to 36.64°N. Focusing on this part of the peninsula makes the narrow coastal bands easier to follow. Contours on land and beneath the sea provide a second spatial reference, inviting closer attention to the terrain beside the mapped canopy.
Structure in the sunlit water
A kelp forest contains different levels: surface canopy, stipes and blades below it, and structures attached to the seabed. These create space for different organisms. The complex habitat provides refuge for fish and invertebrates and alters water movement. A change in canopy area can therefore prompt questions about the living space associated with the forest. NOAA Fisheries · Kelp forest habitat on the West CoastDivers add another view. Returning to the same places to record the organisms present and their abundance connects what is visible from above to life beneath the canopy. Remembering the depth between the blades in an underwater photograph helps turn a flat mapped patch back into a habitat extending through the water. NOAA · What is a kelp forest?
Warmer water and a forest under grazing pressure
Monterey Bay National Marine Sanctuary describes recent kelp changes in the context of interacting pressures: marine heatwaves, sea star wasting disease and increased sea urchin grazing. Sustained warm conditions and changes in the relationships among organisms can both affect whether a forest persists or recovers. Monterey Bay National Marine Sanctuary · Iconic kelp forestsCavanaugh and colleagues examined conditions associated with canopy persistence during 2017–2024. Cooler water, shallow habitat, less fragmentation and a history of persistent canopy were associated with greater persistence. The relationships varied geographically, making local context important when interpreting the coast. Cavanaugh et al. · High-resolution Planet Dove data identify local drivers of kelp canopy persistence (2026)
Following annual outlines helps locate places where canopy returned and places where it remained smaller. These changes can guide further observations: temperature measurements where canopy contracted, or seabed surveys where it persisted. Connecting mapped changes to causes calls for evidence from those additional observations.
Keeping the remaining forest in view
Organizations in Monterey Bay and along the north-central California coast are working at selected sites to restore kelp habitat, including efforts to reduce urchin density. Learning from that work depends on understanding local conditions and continuing to observe the places where interventions take place. Monterey Bay National Marine Sanctuary · Iconic kelp forestsSatellite maps and underwater surveys cover different scales and depths. Eight Septembers reveal which bands persisted into the following year and where canopy appeared again. Fine outlines along Monterey’s coast become reference points for returning to the living forest below.
Data and representation
The source is the public Planet Dove-derived dataset by Katherine Cavanaugh and Kyle Cavanaugh, Zenodo 17717965, CC BY 4.0. September observations from 2017–2024 are compared within the 6,207.5453-hectare footprint shared by all eight surveys. WGS84 geodesic canopy areas in year order are 328.1171, 375.2924, 265.6800, 209.7857, 191.1970, 232.2355, 69.9132 and 133.1417 hectares. Each layer is a monthly surface-canopy composite from classified imagery. This public record provides one September observation per year. Crossfades show the observed dates and values together. Cite Cavanaugh et al. (2026), doi:10.1038/s43247-025-03134-y. Cavanaugh & Cavanaugh · Planet Dove kelp canopy maps (2025) Cavanaugh et al. · High-resolution Planet Dove data identify local drivers of kelp canopy persistence (2026)Background contours use NOAA’s Monterey elevation and bathymetry model, referenced to NAVD88, at 25-metre intervals. Terrain is a static spatial reference. Grey denotes 2017 and green the selected year. Uncertainty includes classification performance, sea-surface conditions and observation conditions. Surface canopy, underwater biomass and carbon are separate metrics. The contextual photograph carries its own location, date and rights information.
Sources
- NOAA Ocean Today · Underwater forests
- Cavanaugh et al. · High-resolution Planet Dove data identify local drivers of kelp canopy persistence (2026)
- Katherine & Kyle Cavanaugh · Time Series of Kelp Canopy Maps from Planet Dove (Raster) · CC BY 4.0
- NOAA Fisheries · Kelp forest habitat on the West Coast
- NOAA · What is a kelp forest?
- Monterey Bay National Marine Sanctuary · Iconic kelp forests
- Kelpwatch · ecological context & methods
- NOAA NCEI · Coastal elevation models
- NOAA NCEI · DEM catalogue
Author
SORAH Editorial
October 19, 2026