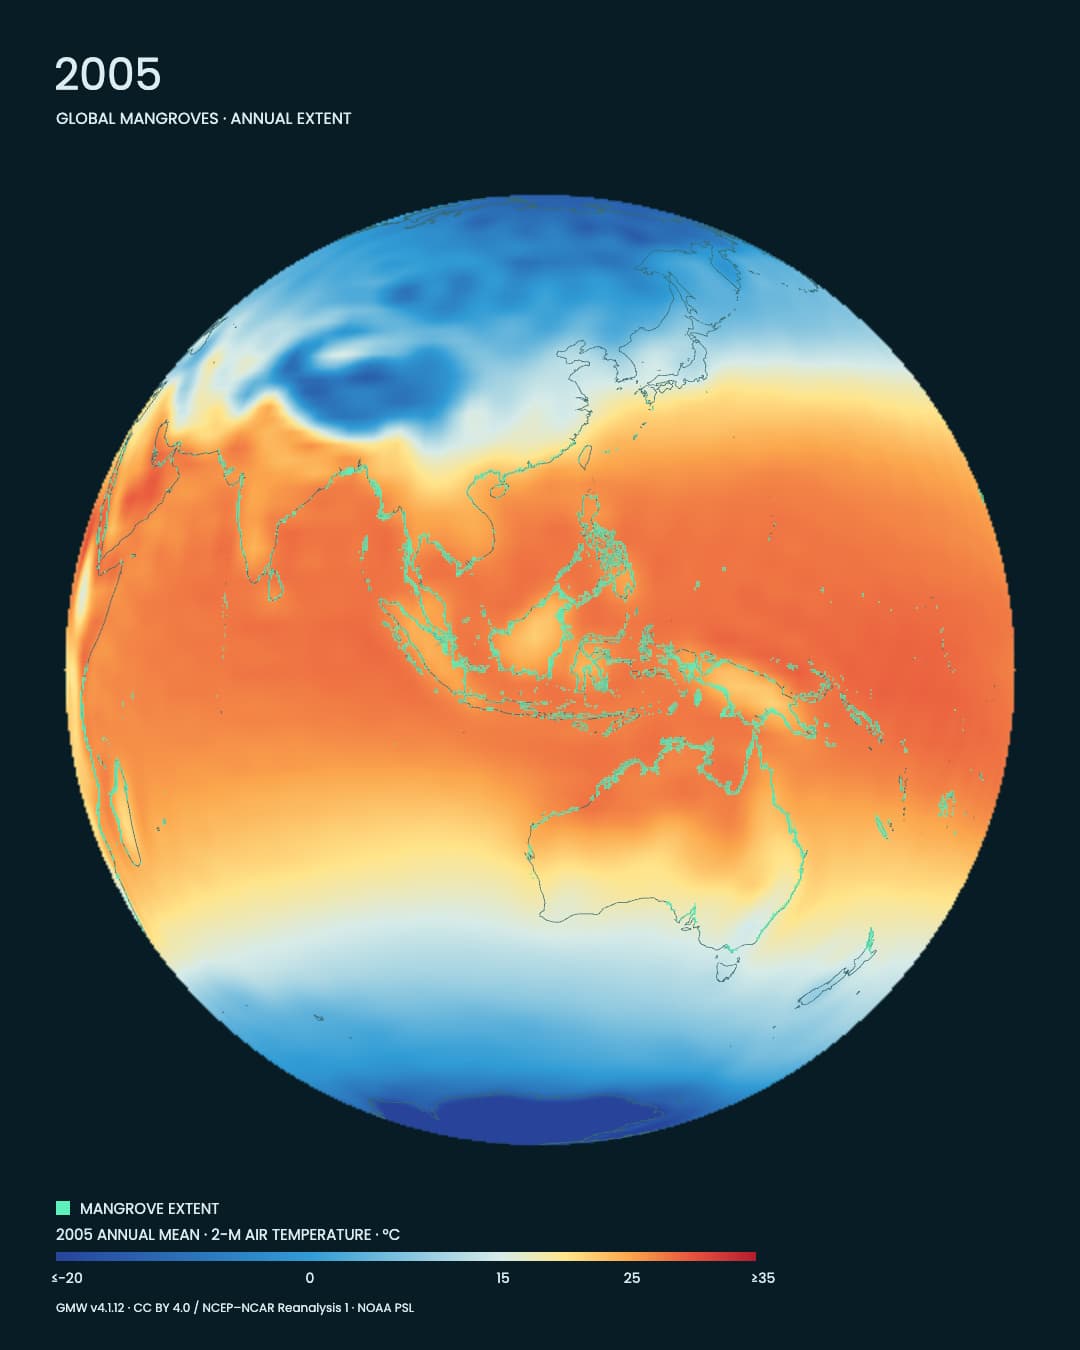
A global view of mangroves and air temperature, sharing a timeline from 1985 to 2025.
A global view of mangroves and air temperature, sharing a timeline from 1985 to 2025.
Explore forty years of mangroves in Data Scape
Small green areas follow the meeting of land and sea. They gather around bays, islands and coastal margins. Seen globally, mangroves form a distinctive geography of forest along the world’s warm coasts.
Mangroves are trees and shrubs that live on intertidal coasts. NOAA describes about 80 species of mangrove trees. They grow mainly in the tropics and subtropics, with freezing conditions limiting their range. Their roots retain sediment and shelter fish and other organisms: a narrow coastal forest with a role on both sides of the shoreline. [5]
![Mangrove extent and mean air temperature in 1985. Green cells aggregate locations classified as mangroves in that year. [1][4]](/images/articles/mangroves/01-global-en.jpg)
Mangrove extent and mean air temperature in 1985. Green cells aggregate locations classified as mangroves in that year. [1][4]
Forests along warm coasts
Blue marks colder places; yellow, orange and red mark warmer ones. Adding the forest layer places coastal habitats within that broad temperature pattern. These forests belong to a setting shaped by both climate and tides.Asian islands, African shores and the coasts of the Americas come into a shared frame on the world map. Even within warm regions, forest does not cover every coast evenly. It forms its own geography along bays, river mouths and island margins.
![Global extent in 1985, over annual mean 2-m air temperature. Every year uses the same −20 to 35°C colour scale. [1][4]](/images/articles/mangroves/02-world-en.jpg)
Global extent in 1985, over annual mean 2-m air temperature. Every year uses the same −20 to 35°C colour scale. [1][4]
Forty years on one timeline
The film advances from 1985 to 2025. Forest classification and temperature always belong to the same year. The camera stays fixed, allowing us to follow the green shapes and the temperature behind them in the same places.Some coastal areas remain green; elsewhere the mapped outline or intensity changes. Forty years bring a different timescale to the view. Following small differences along the coast reveals a landscape whose shape is not fixed.
![2025, with the same extent and scale as the 1985 world map. Green shows that year’s mangrove classification; the background is that year’s mean air temperature. [1][4]](/images/articles/mangroves/04-2025-en.jpg)
2025, with the same extent and scale as the 1985 world map. Green shows that year’s mangrove classification; the background is that year’s mean air temperature. [1][4]
A living coast through time
Putting the records together lets us ask what the temperature was in a year when mapped forest changed. A shared timeline gives us a starting point for thinking about the relationship between organisms and their environment.A coastline looks like a thin line on a map. Around it, forests provide habitat and hold sediment. After following forty years of change, trace the green again: the boundary between land and sea becomes a place where life gathers.
Note · Data and representation Global Mangrove Watch v4.1.12: all 1,696 tiles, 41 annual states from 1985 through 2025, shown in twenty seconds. Provider overviews at approximately 480 m are aggregated in 4×4 groups, preserving the classified fraction in each year. Adjacent square display cells are brighter where that fraction is greater; there is no minimum-distance thinning or filling of unclassified gaps. Display-cell counts and sizes do not measure trees or physical area. Early years include classification filled from other years; mapped changes do not directly establish growth, loss, ecosystem recovery or changes in carbon storage. Native grid: approximately 30 m. GMW: CC BY 4.0. [1][2]
Note · About temperature NOAA PSL / NCEP–NCAR Reanalysis 1 supplies 2-m air temperature on a roughly 1.9° grid. Monthly means are weighted by calendar month length to form annual means. These are broad-scale reanalysis estimates, not sea-surface temperatures or local forest measurements. Spatial interpolation is for display; annual states are not temporally interpolated. The −20 to 35°C scale is fixed and saturates at its limits. The overlay does not establish a causal relationship between temperature and vegetation change. [4]
Sources
Author
SORAH Editorial
October 1, 2026