Published on 25/September/2026 · Nature
Below-normal river flows in 2025: what they mean for people and ecosystems
By SORAH Editorial
The Nile, Congo and Zambezi were among the great river basins with below-normal flows in 2025. Following their tributaries reveals what depends on that water: food, electricity and places for wildlife to live.
The Nile, Congo and Zambezi were among the great river basins with below-normal flows in 2025. Following their tributaries reveals what depends on that water: food, electricity and places for wildlife to live.
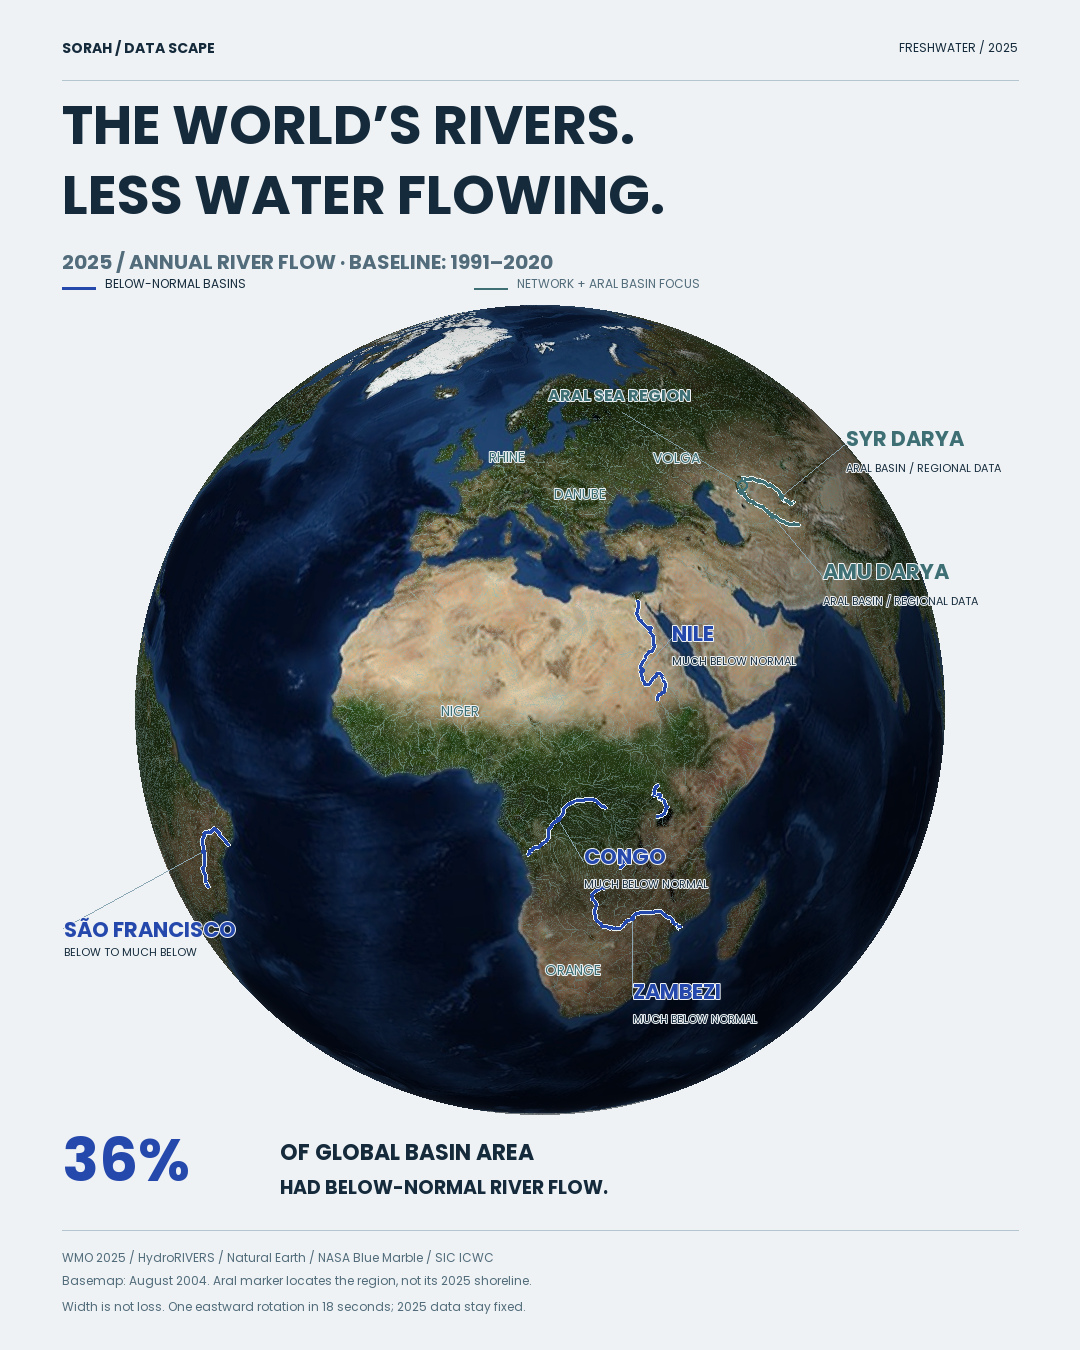
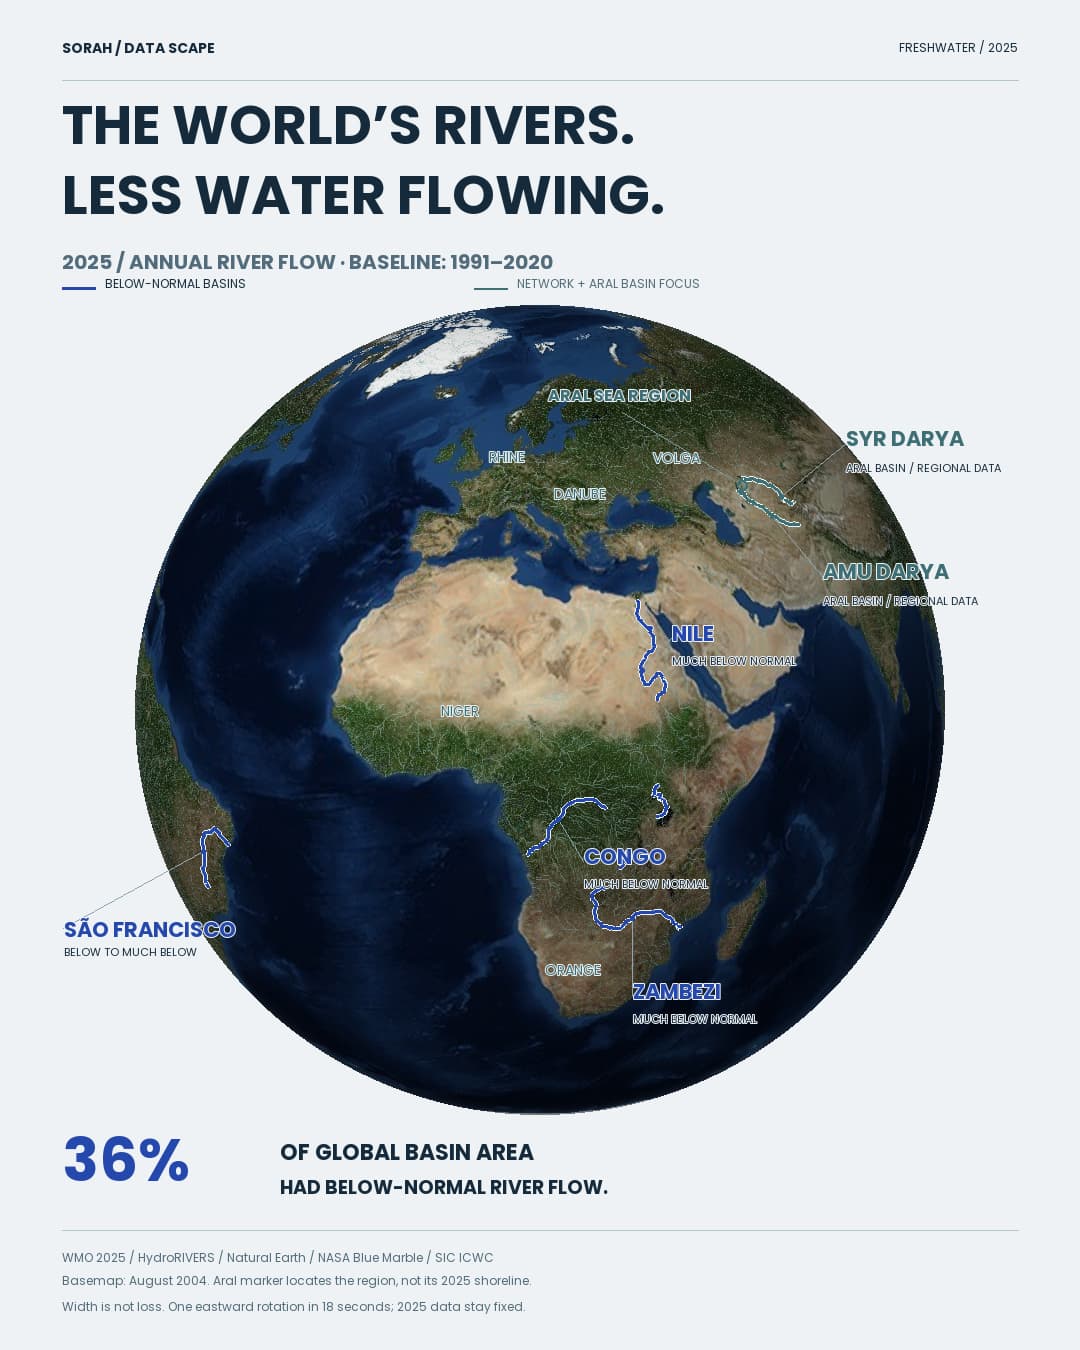
Blue identifies main stems in four below-normal-flow basins in 2025. Teal shows the tributary network and the Amu Darya and Syr Darya, included as a regional-data focus rather than assigned a WMO flow class. The 36% metric is a global basin-area share. Background: NASA, August 2004. The Aral marker locates the region.[1][2][3][5][17]
01 / Rivers that sustain life
Look closely at the globe. Around each named river, finer lines spread across the land. The Nile, Congo, Zambezi and Brazil’s São Francisco are the visible centres of much larger networks. Each gathers water from a catchment: the land that drains towards a common outlet.[16]Along these waterways, people grow crops, catch fish and build settlements. Rivers supply drinking water, move goods and people, generate electricity and carry sediment that sustains deltas. They are habitats as well as resources. A change in their flow can therefore reach far beyond the riverbank.[9]
Our map places the main stems of four basins with below-normal flows in 2025 over a branching network of tributaries. The point is not simply to trace long blue lines. It is to see the extent of the places served by a single river.
02 / Where flows were low in 2025
In its assessment released on 17 September 2026, the World Meteorological Organization reported below-normal annual river flows across 36% of global basin area in 2025.[1]Note · Reading the figure The 36% figure is a share of basin area, not a percentage loss of water. The assessment uses 1991–2020 as its baseline and 13 global hydrological models driven by observed weather.[1]
The geography matters. The Nile, Congo and Zambezi basins had much-below-normal flows; the São Francisco basin was also among the regions classified as below to much below normal. Yet the Niger and Orange basins, also in Africa, had above-normal flows. A single colour for an entire continent would erase these differences.[7]
Note · Reading the map Blue main stems locate the selected low-flow basins; they do not establish the same decline in every tributary. The teal network shows geography, not a rating of normal flow.
Turning toward Central Asia brings the Amu Darya and Syr Darya into view: two rivers connected to the Aral Sea region. SIC ICWC reports that 2.291 billion m³ reached the Amu Darya delta in 2025, 297 million m³ less than in 2024. Regional records also report withdrawals and Aral Sea inflows for the Syr Darya.[17]
Note · The Central Asian indicators The delta-supply total includes water from canals and drainage collectors. It is not the entire river’s annual discharge or an anomaly against 1991–2020. The two rivers appear in teal as a regional-data focus, separate from the four basins with identified WMO low-flow classes.[17]
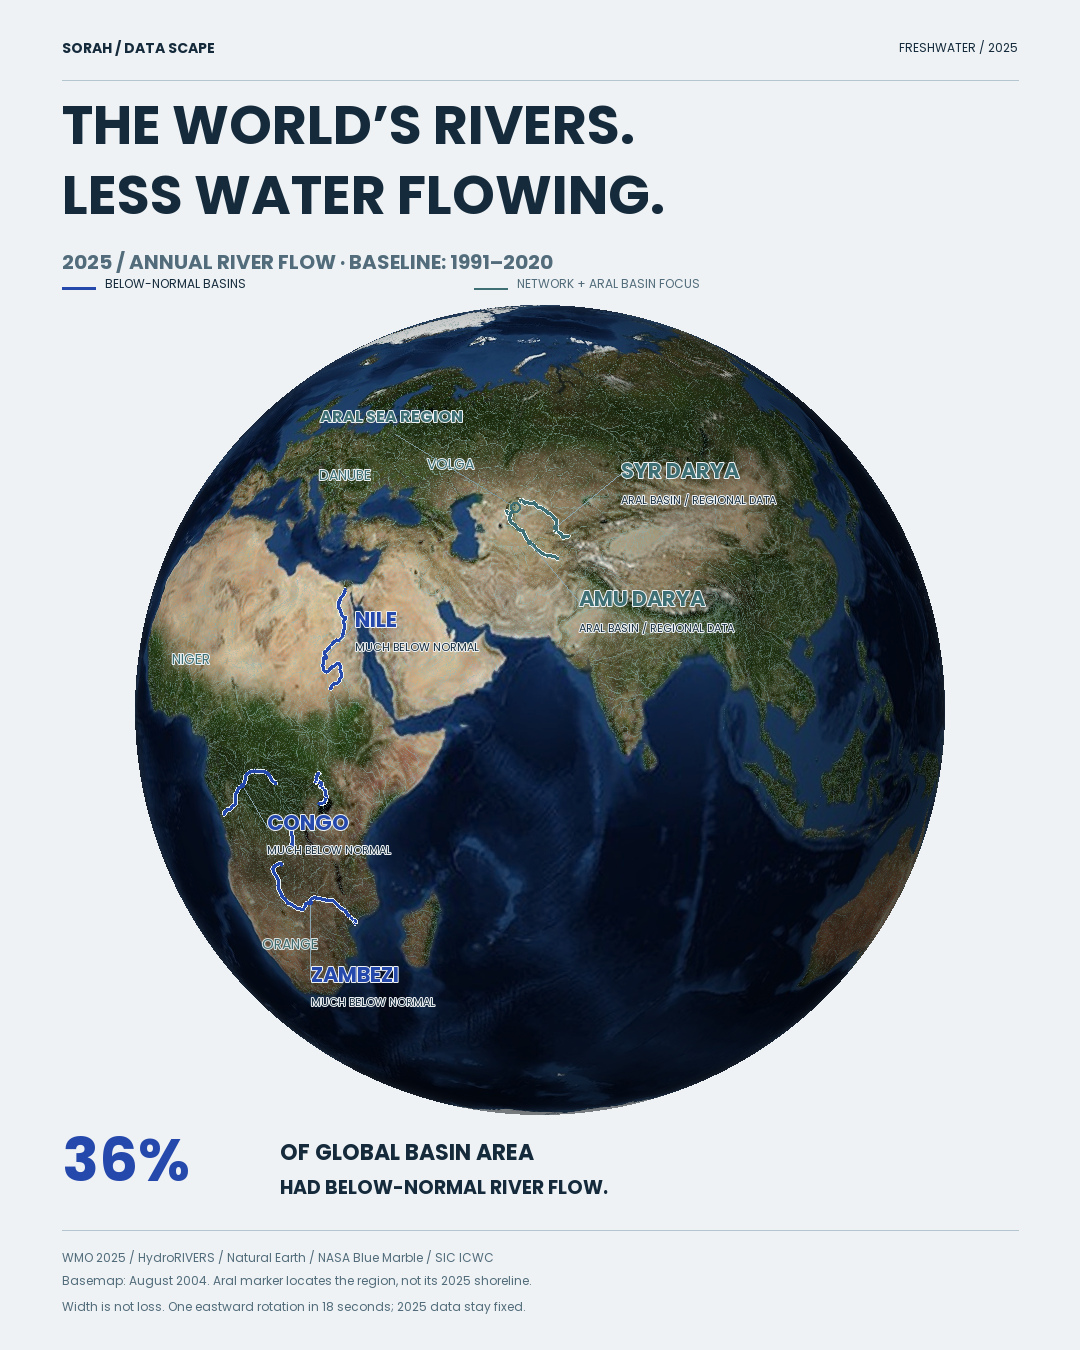
Blue identifies main stems in four below-normal-flow basins in 2025. Teal shows the tributary network and the Amu Darya and Syr Darya, included as a regional-data focus rather than assigned a WMO flow class. The 36% metric is a global basin-area share. Background: NASA, August 2004. The Aral marker locates the region.[1][2][3][5][17]
03 / Water moving, water stored
River discharge is the amount of water passing a location in a given time. It differs from the height of the river or the volume held in a lake. Here, the comparison concerns annual flow relative to a historical baseline.[16]Water is also stored in groundwater, lakes, soil, snow and ice. WMO reports a long-term decline in total terrestrial water storage since the mid-2010s. These stores interact with rivers, but the colours on this river map do not measure groundwater depletion or shrinking lakes.[1]
Rainfall is only one influence on flow. Snowmelt, groundwater exchange, irrigation, water withdrawals, dam operations and changes in land use can also matter. Understanding what a low-flow classification means for a particular place requires looking inside its basin.[16]
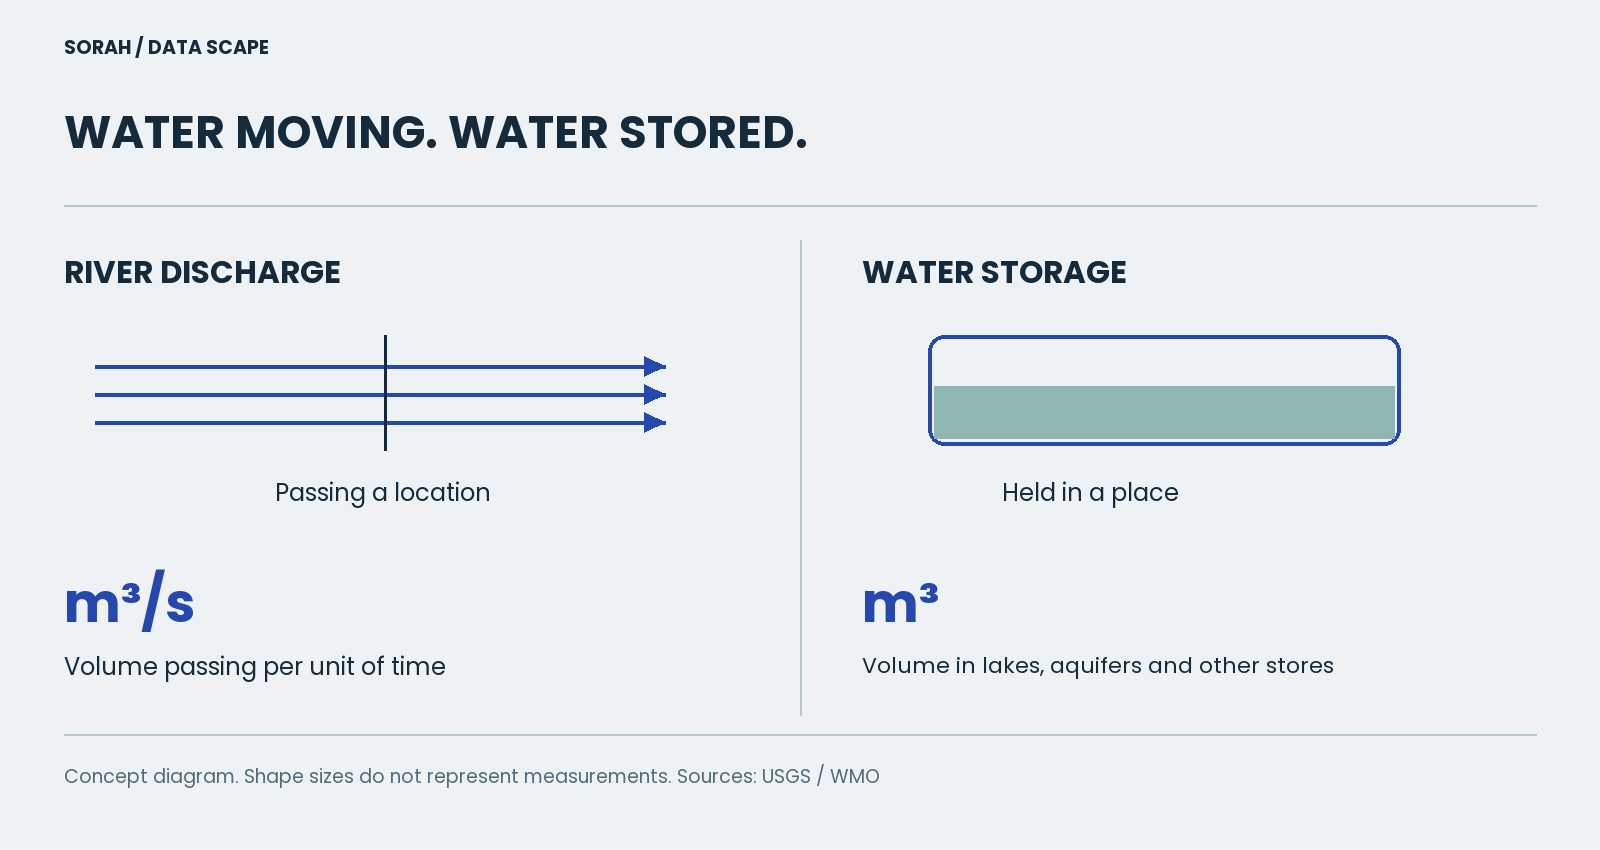
Discharge is volume per unit time; storage is a volume held. This is a concept diagram; shape sizes are not measurements.[1][16]
04 / Food, power and ecosystems: what changes with the water
In Zambia’s Kafue Flats, on a tributary of the Zambezi, seasonal inundation is part of the landscape’s functioning. Wetlands support waterbirds and fish alongside fishing, farming and livestock rearing. Lagoons left as floodwater recedes become fish breeding sites. The arrival and retreat of water help sustain both habitats and livelihoods.[13][14]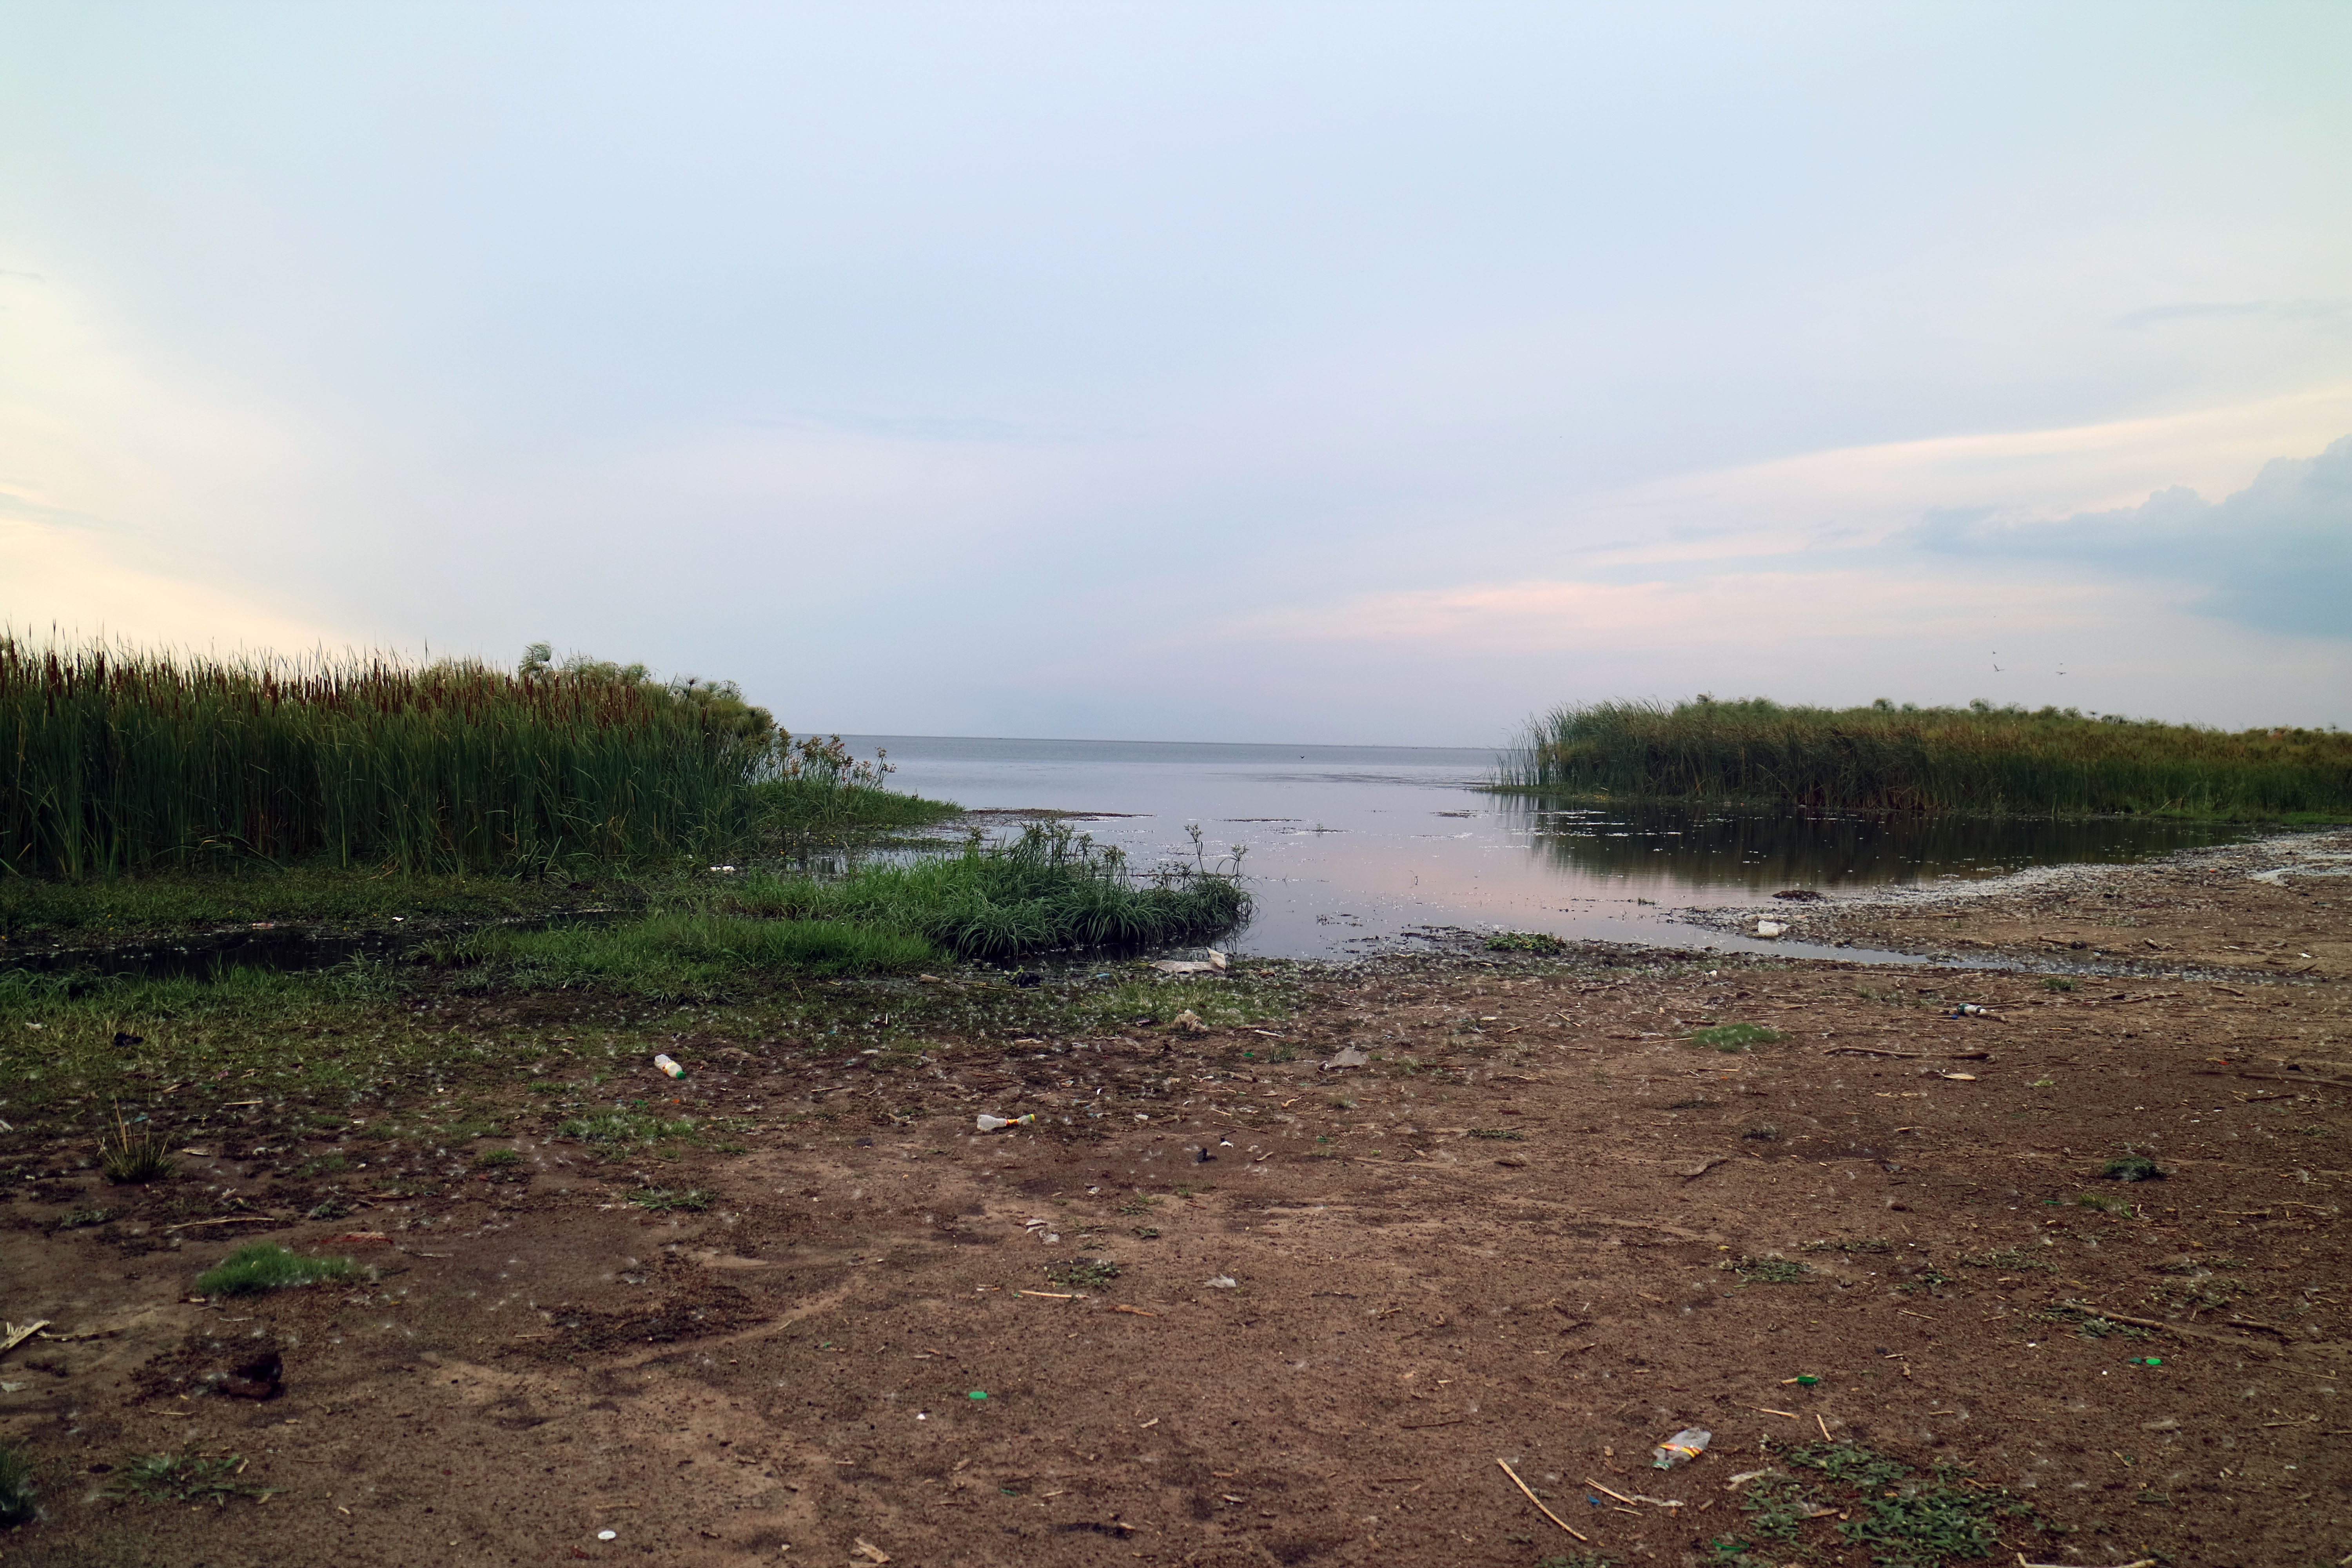
The Kafue Flats, viewed from Lochinvar National Park, Zambia, on 10 October 2020. Photograph: Anayawa Nyambe / Wikimedia Commons. CC BY-SA 4.0; original image unmodified.[18][19]
Water also becomes electricity. Hydropower accounts for more than three quarters of Zambia’s installed generating capacity. According to the World Bank, the 2024 drought reduced available power by about one third, with households, small businesses and public services suffering. It shows how a shortage of water can become a shortage of power far from the river itself.[12]
Note · The year of this example Zambia’s power shortage is a documented 2024 event, separate from the map’s 2025 flow assessment.[12]
Too much water brings different dangers. On 12 January 2024, WHO reported that flooding in the Republic of Congo had left more than 336,000 people needing urgent humanitarian assistance. Areas bordering the Congo River were among the worst affected. Floods damaged or destroyed 34 health facilities and 120 schools, and submerged farmland. More water in a landscape does not necessarily mean secure food supplies or safe drinking water.[15]
Seasonal water can sustain a wetland; a flood can overwhelm a neighbourhood. A river can power homes, while drought can interrupt that supply. These relationships cannot be reduced to a preference for more water or less. Timing, location and the ways people and ecosystems depend on a river all matter.
Return to the tributaries on the globe. Beyond each line are fields, fishing grounds, homes and workplaces. Following a great river’s flow is a way to bring those places into view—and to understand what is at stake when the water changes.
About the data
Flow classes use WMO’s 2025 basin assessment relative to 1991–2020, based on 13 global hydrological models. River geometry comes from Data Scape’s HydroRIVERS v1 network: about 2.58 million segments at Strahler order 3 and above. The visible hemisphere changes as the globe rotates. Natural Earth provides river names and highlighted main stems. Basin classes are not individual tributary measurements. The 36% value is a basin-area share. NASA’s August 2004 composite provides geographical context, not 2025 water conditions. Monitoring is uneven: GRDC reports that Africa and Asia accounted for about 7% of the assessment’s stations. The north-up globe rotates west to east, with one continuous revolution in 18 seconds and matching opening and closing views. The 2025 assessment remains fixed; rotation is not a flow time series or a depiction of flow speed.[1][2][3][5][7] The Amu Darya and Syr Darya are regional-data focus rivers, with individual WMO classes unverified. The Aral marker is a regional locator, not a 2025 shoreline.[17]Sources
- WMO — 2025年の世界の水資源(2026年9月17日)
- HydroRIVERS v1 — 河川網・Strahler階層
- Natural Earth v5.1.2 — Data Scape採用の川名・主流形状
- NASA Earth Observatory — Blue Marble(採用背景・2004年8月)
- GRDC — 2025年水資源評価・観測網と地域差
- UNEP — Four reasons to protect rivers(河川の社会・生態的な価値)
- World Bank — Powering Zambia’s Transformation(2024年干ばつと電力供給)
- UNESCO — Kafue Flats / Man and the Biosphere(湿地と生業)
- Ramsar — Kafue Flats Information Sheet(ザンベジ流域の湿地)
- WHO — Supporting flood emergency response in Congo(2024年1月12日)
- USGS — Streamflow and the Water Cycle(流量と流域)
- SIC ICWC — Water Yearbook 2025 / Aral Sea Basin(BWO Amu Darya・BWO Syr Darya)
- Anayawa Nyambe — Lochinvar National Park / カフエ・フラッツの写真(2020-10-10)
- 写真の利用条件 — Creative Commons Attribution-ShareAlike 4.0
Author
SORAH Editorial
September 25, 2026