Published on 09/October/2026 · Nature
Ocean noise: a day of ships and sound off Boston.
By SORAH Editorial
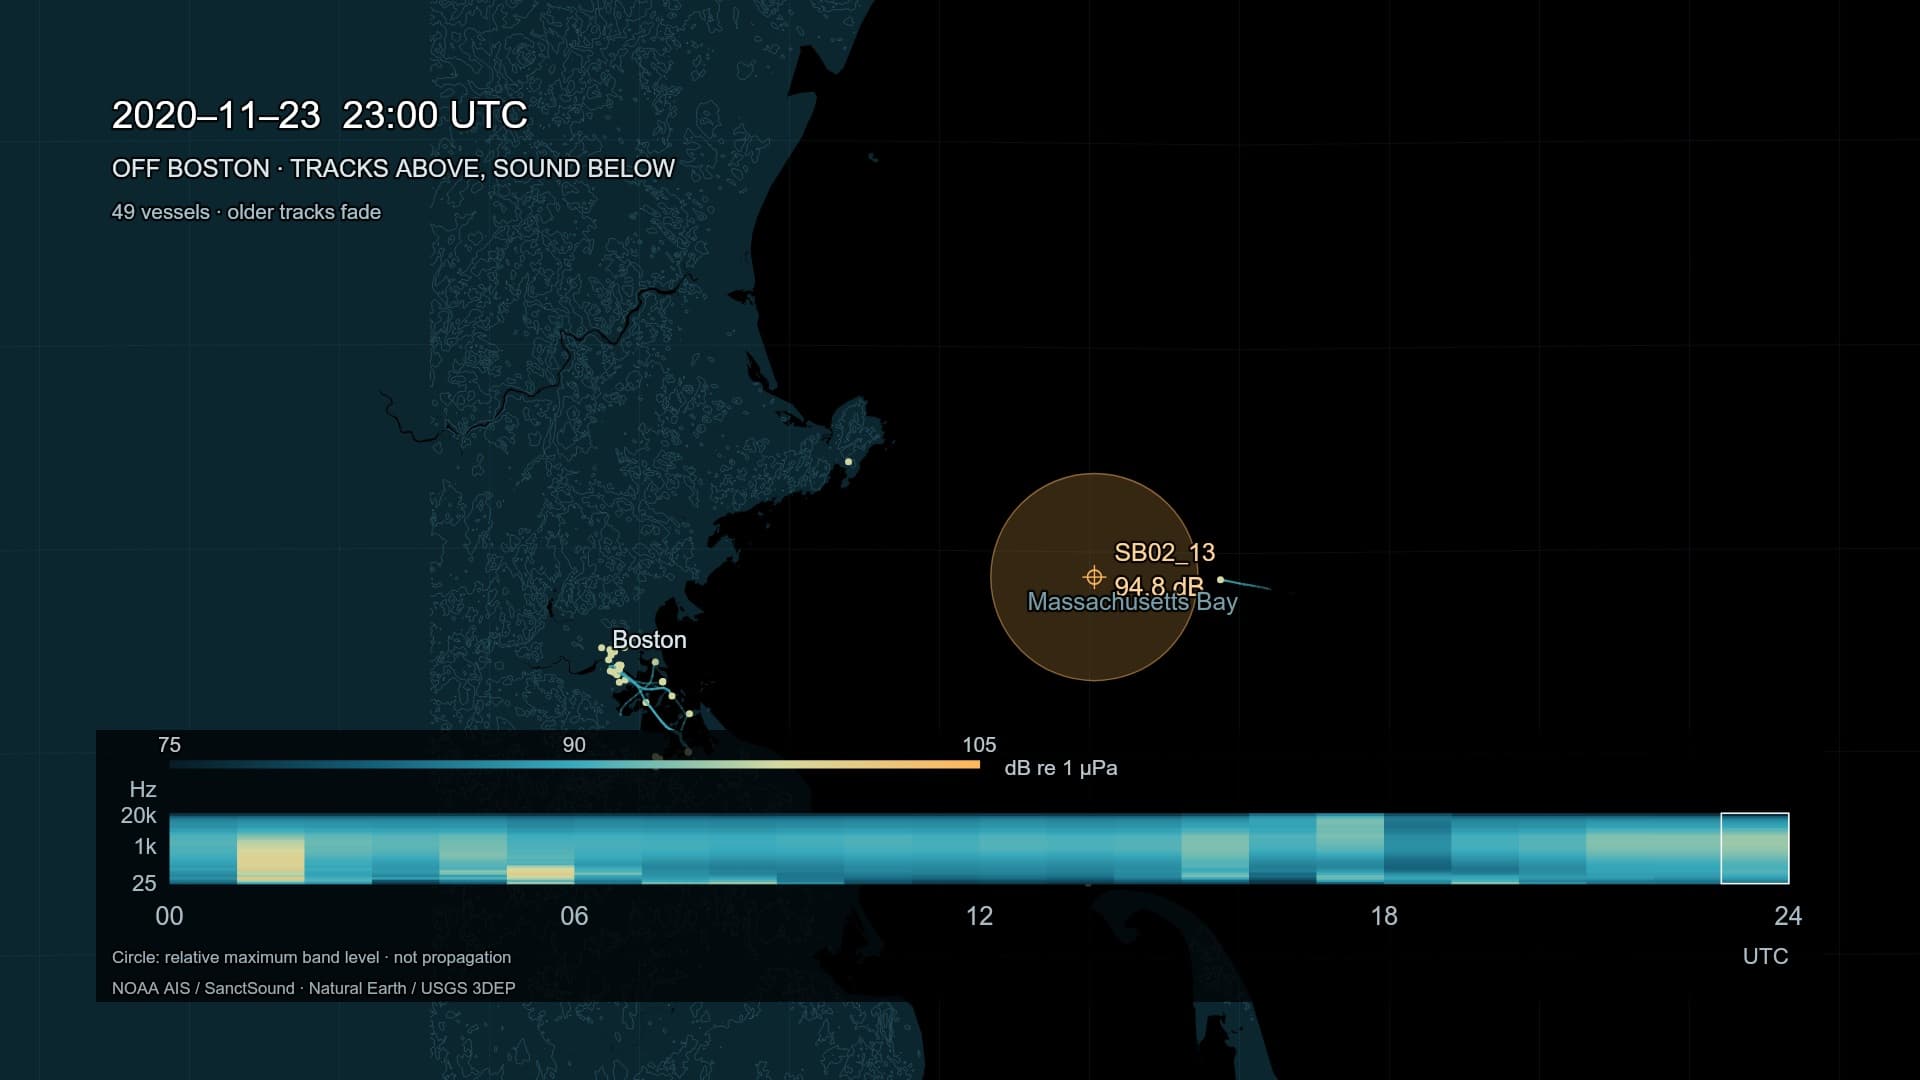
Vessel positions above the surface and a hydrophone below it share one clock: 23 November 2020, off Boston.
The sea surface does not reveal the sound beneath it. A ship approaches the harbour; another heads offshore. Their positions leave lines on a map while a hydrophone records the overlapping sounds arriving underwater. Reading one day off Boston through both records reveals a space used for movement and a space through which sound travels.
One clock, above and below the surface
The vessel record for 23 November 2020 contains 89 identifiers and 37,169 positions. Advancing the hour connects positions received within that interval, with older segments fading. Some paths cluster near the port; others stretch offshore. Before calling a whole area “busy,” we can look separately at when and where movement occurs.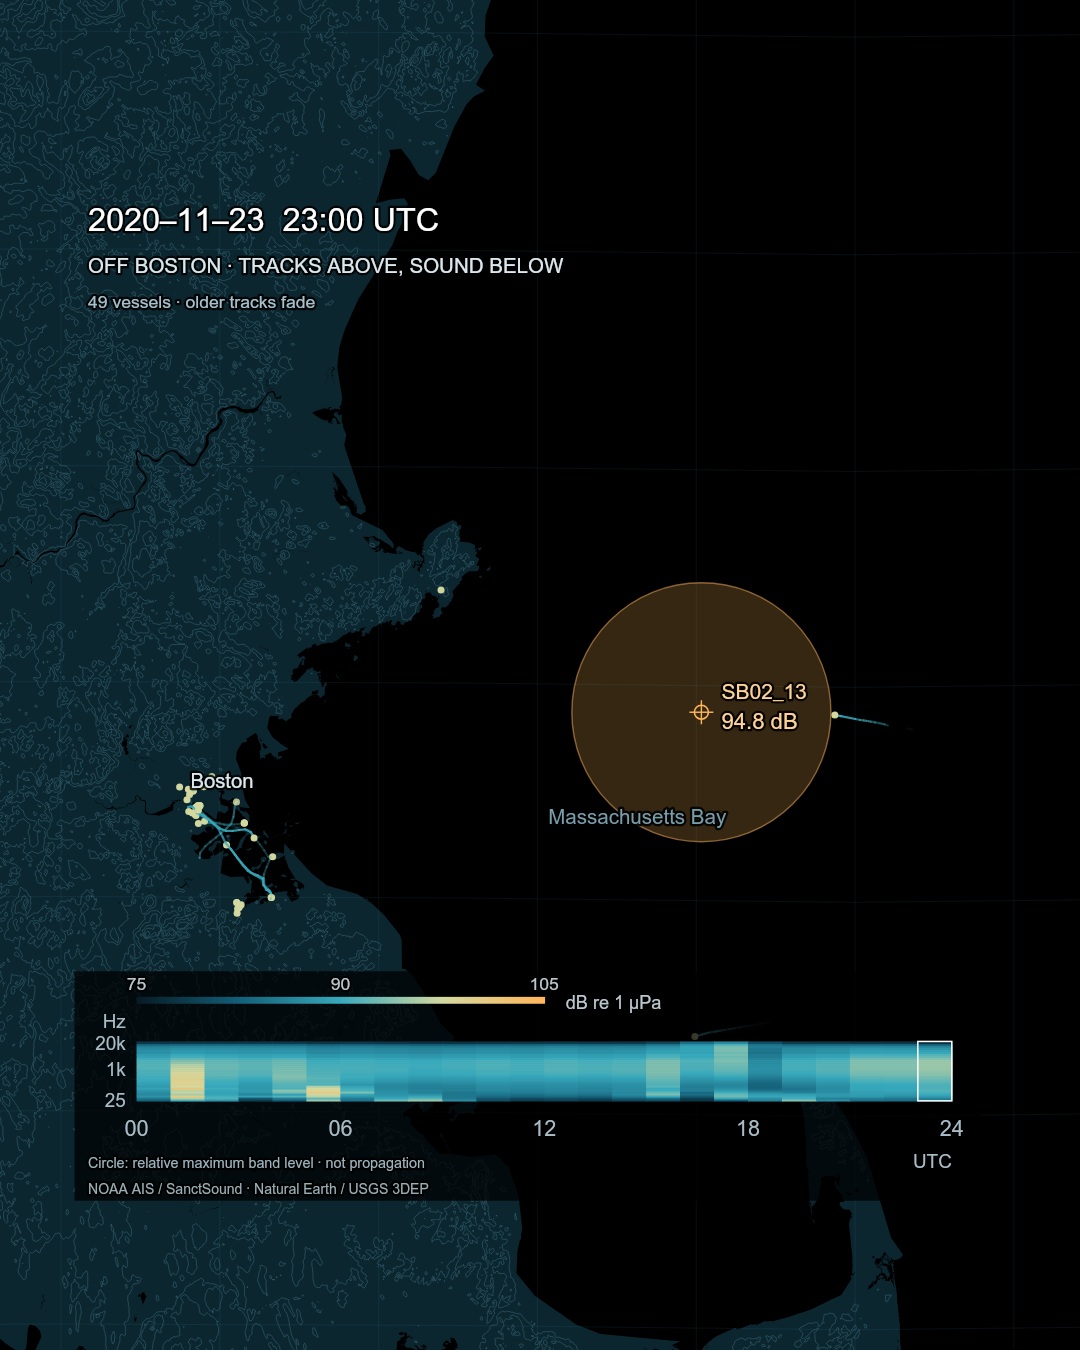
Same-day AIS tracks and twenty-four hours of sound in thirty bands at SB02_13. The circle represents the maximum band level in the selected hour.
The banded panel is the hydrophone’s record. Time runs across it; frequency runs from low to high. Which parts of the spectrum strengthen at which hours? Moving between the tracks and this panel adds another layer of time to the map.
The amber circle marks a listening point
The amber circle becomes larger and more opaque when the selected hour’s maximum band level is higher. On this day, that maximum was 101.6 dB at 01:00 and 89.6 dB at 18:00 UTC. The circle is a visual cue to a measurement at one location. The frequency panel lets us return to the question of which bands changed.Putting movement and sound on one clock makes further questions more precise. Which routes were active during a louder hour? Why might sound change when no nearby track is visible? The visualisation provides times and frequencies to investigate, rather than naming the source of a sound from its appearance.
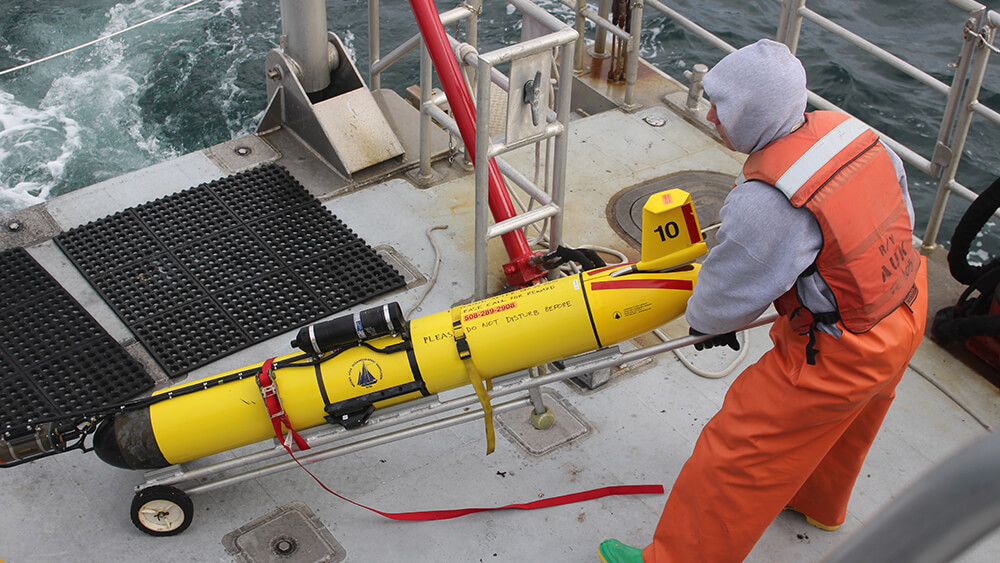
A glider used to investigate underwater sound. Photograph undated. Anne Smrcina / NOAA. 出典 / Source
Animals occupy an acoustic space too
At Stellwagen Bank, fixed recorders and mobile gliders have been used to investigate vessels, animals and environmental sound. NOAA’s research also considers shipping noise in relation to the environment through which animal signals can be heard. A ship that appears simply to pass by on the surface can change conditions for listening below it. [3]On a transport map, water can look like blank space between ports. For animals it is also habitat in which sound has a role. Understanding coexistence means asking not only where movements overlap but also what arrives acoustically, and when.
Changing routes, changing sound
In 2007 the Boston shipping lanes were moved towards an area with fewer whales, an intervention aimed at reducing collision risk. The change demonstrates that a route is not an inevitable line: observations can help reshape how the sea is used. [4]For underwater noise, the International Maritime Organization revised its guidelines in 2023 and adopted an action plan in 2024. Vessel design and operation offer practical questions to examine alongside measurements of sound. [5]
Every fading track represents activity by people using the sea. The changing bands below it describe conditions that visible tracks alone cannot capture. Reading both records invites us to see a passage for ships as a place where other lives also depend on listening.
Data and interpretation
Boston only, 23 November 2020 UTC. NOAA AIS: 89 identifiers and 37,169 positions. Tracks connect received positions within the selected hour; 195 gaps over ten minutes stay open. Fading represents record age. Non-AIS and unreceived vessels are outside this record.NOAA / U.S. Navy SanctSound SB02_13, 42.471128°N, 70.241957°W. Hourly median sound pressure levels in thirty third-octave bands from 25 to 20,000 Hz; dB re 1 µPa. These are neither PSD nor combined broadband levels. The visual master is silent. The distribution film adds composed music and texture, not recordings from the hydrophone.
Colours use a fixed 75–105 dB scale. Circle area and opacity scale each hour’s maximum band value against the daily minimum and maximum. The circle is not sound propagation distance. One hydrophone’s band summaries do not separate ships, whales and natural sources or establish impacts from coincidence with AIS.
Sea background is black. MassGIS coast geometry is extended with Natural Earth; land contours use USGS 3DEP. Background colours do not encode acoustics. The photograph is a separate research scene, not the date shown in the visualisation.
Sources
Author
SORAH Editorial
October 9, 2026