Open the Earth around the North Pole and Alaska, Canada’s islands, Greenland’s margins and Svalbard surround one ocean. Their glaciers have accumulated winter snow and released water through the warmer season. Looking at their mass changes asks a different question from simply tracing their white outlines: how much ice remains stored there?
A WMO report released on 17 September 2026 estimates global glacier losses of 408 ± 132 gigatonnes in the 2025 hydrological year. Every major glacier region recorded net loss for a fourth consecutive year. This film traces the earlier record, from 2000 to 2023, examining the years over which that longer change accumulated. [1]
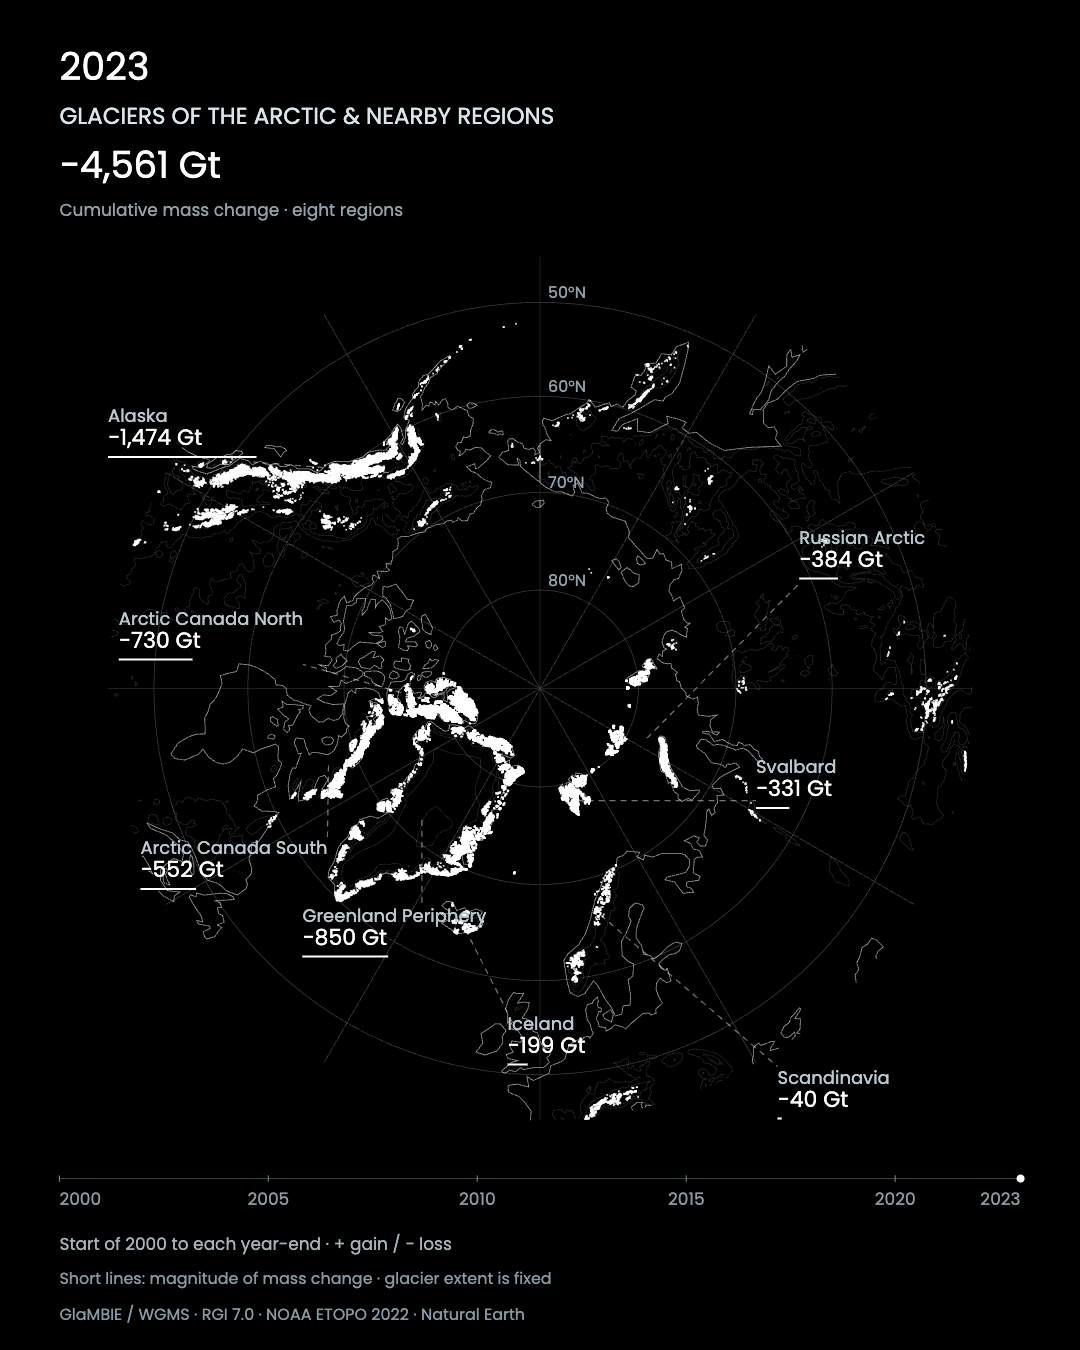
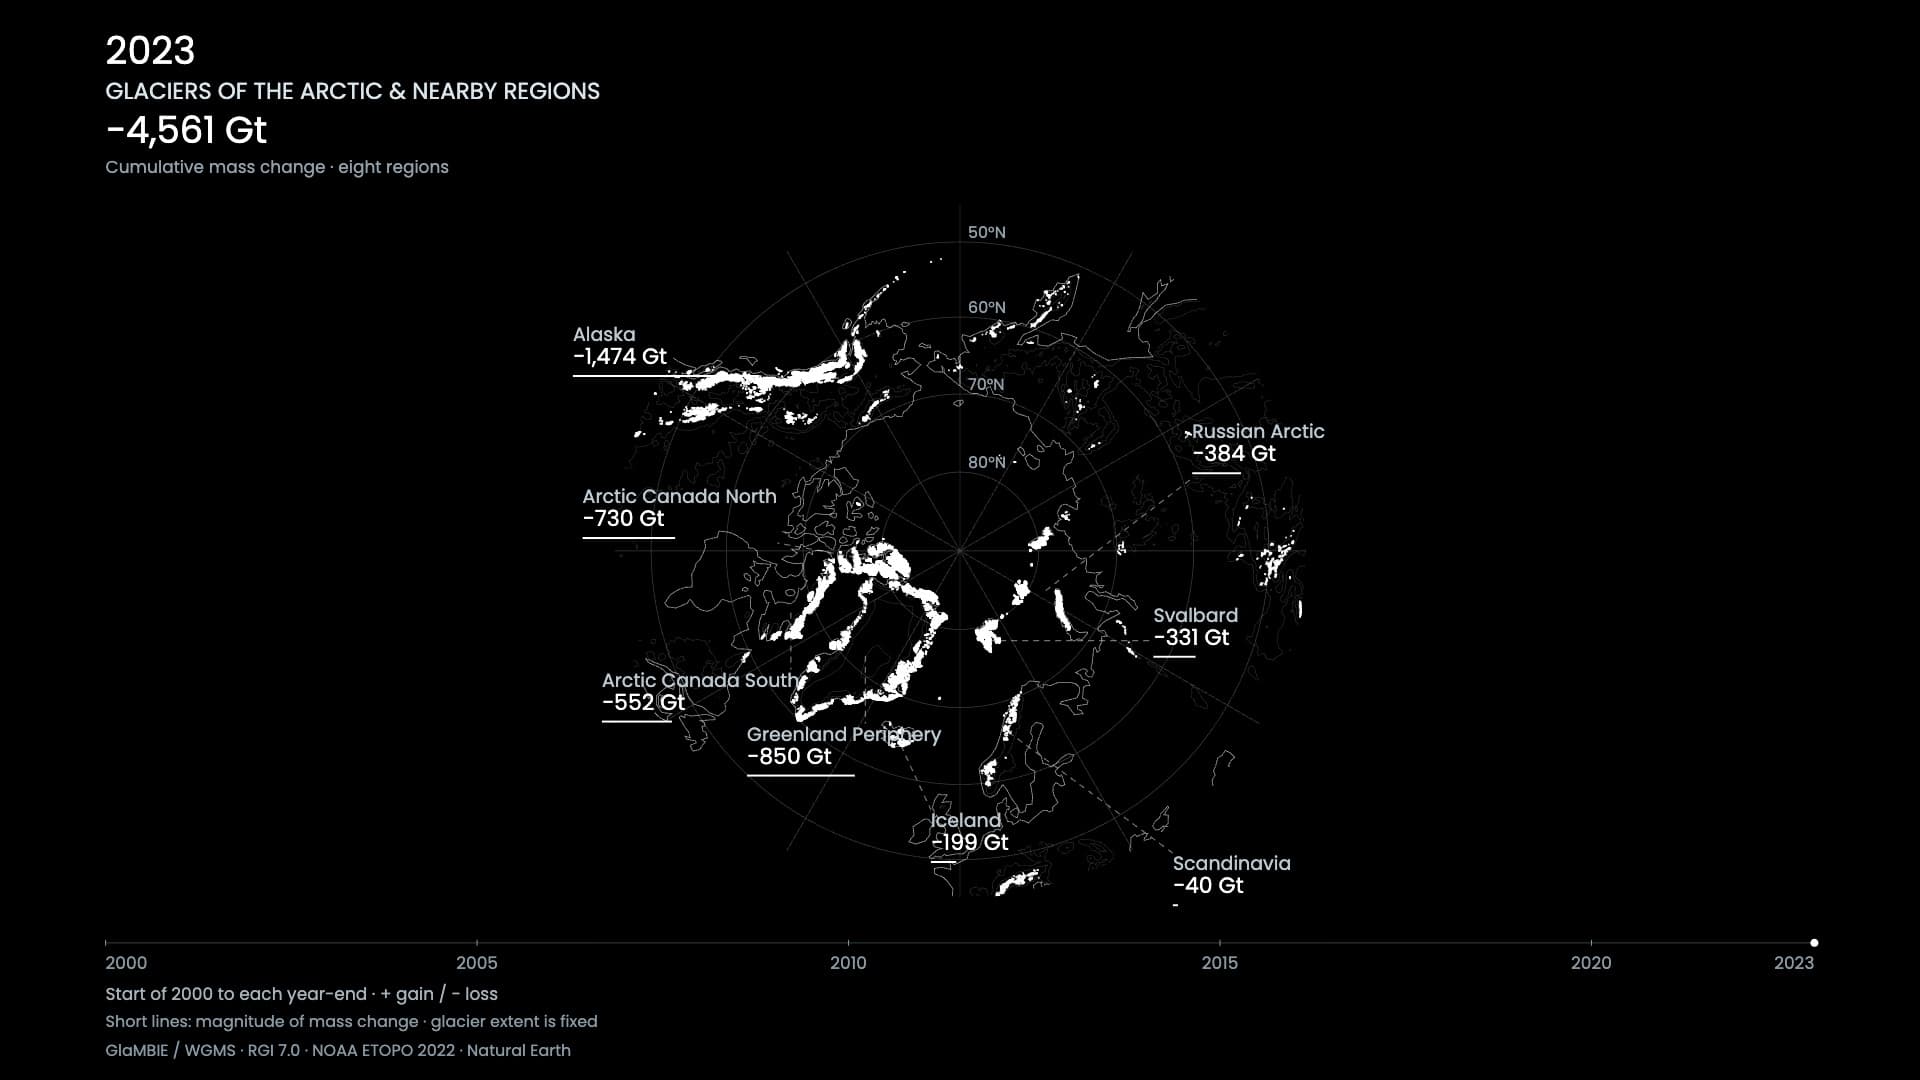
Cumulative mass change of eight regions, start of 2000 to end of 2023. 1 Gt = one billion tonnes. Fixed white glacier distribution.
Snow coming in, ice going out
A glacier gains snow and loses snow or ice through the year. Surface melting releases water; glaciers meeting the sea can also lose ice by calving. The balance between additions and losses determines mass change. A snowy winter does not guarantee a gain if subsequent losses are greater. [2]Because glaciers flow, the position of the terminus alone does not reveal the balance of the whole glacier. A broad white outline can remain while thinning removes mass. Retreat as scenery and loss as stored water overlap, but they are not the same measurement. Annual mass records reveal changes a single photograph may miss. [2]
One gigatonne, Gt, is one billion tonnes. The eight Arctic and nearby regions shown here together lost approximately 4,561 Gt between the start of 2000 and the end of 2023. They are Alaska, Arctic Canada North and South, Greenland Periphery, Iceland, Svalbard, Scandinavia and the Russian Arctic. The Greenland ice sheet itself is excluded. [3]
Annual fluctuations within a longer loss
The numbers do not move at the same speed in each region. Alaska gained about 46 Gt in 2000, yet its cumulative change over 2000–2023 was a loss of about 1,474 Gt. One year and a sequence of annual balances tell different stories. Fluctuations in snowfall and melt coexist with a long-term reduction in stored ice. [3]Losses over the same period were approximately 850 Gt in Greenland Periphery, 730 Gt in Arctic Canada North and 331 Gt in Svalbard. Large absolute losses also reflect the extensive glacier areas in some regions. These totals are not percentages of ice lost, but comparing them in the same unit places the scale of change around the northern ocean. [3]
A single before-and-after figure cannot show when losses accumulated. Annual records restore the intervening sequence. One year of gain does not establish that a longer decline has ended, just as an unusually large loss should not be extended unchanged into the next year. A timeline lets each result be read beside its neighbours.
Nor can a regional mass total be converted directly into the appearance of one glacier. Elevation, snowfall and contact with the sea differ among glaciers within the same region. Moving between the broad balance and the individual site keeps a number from becoming an overly simple description of a landscape. [2]
People on the ice, instruments in space
At South Cascade Glacier in Washington, observations began in 1958. Researchers measure snow and surface changes around stakes installed in the ice. This site lies outside the eight northern regions, but makes long-term monitoring tangible: return to the same ground and leave a record that can be compared with earlier years. [4]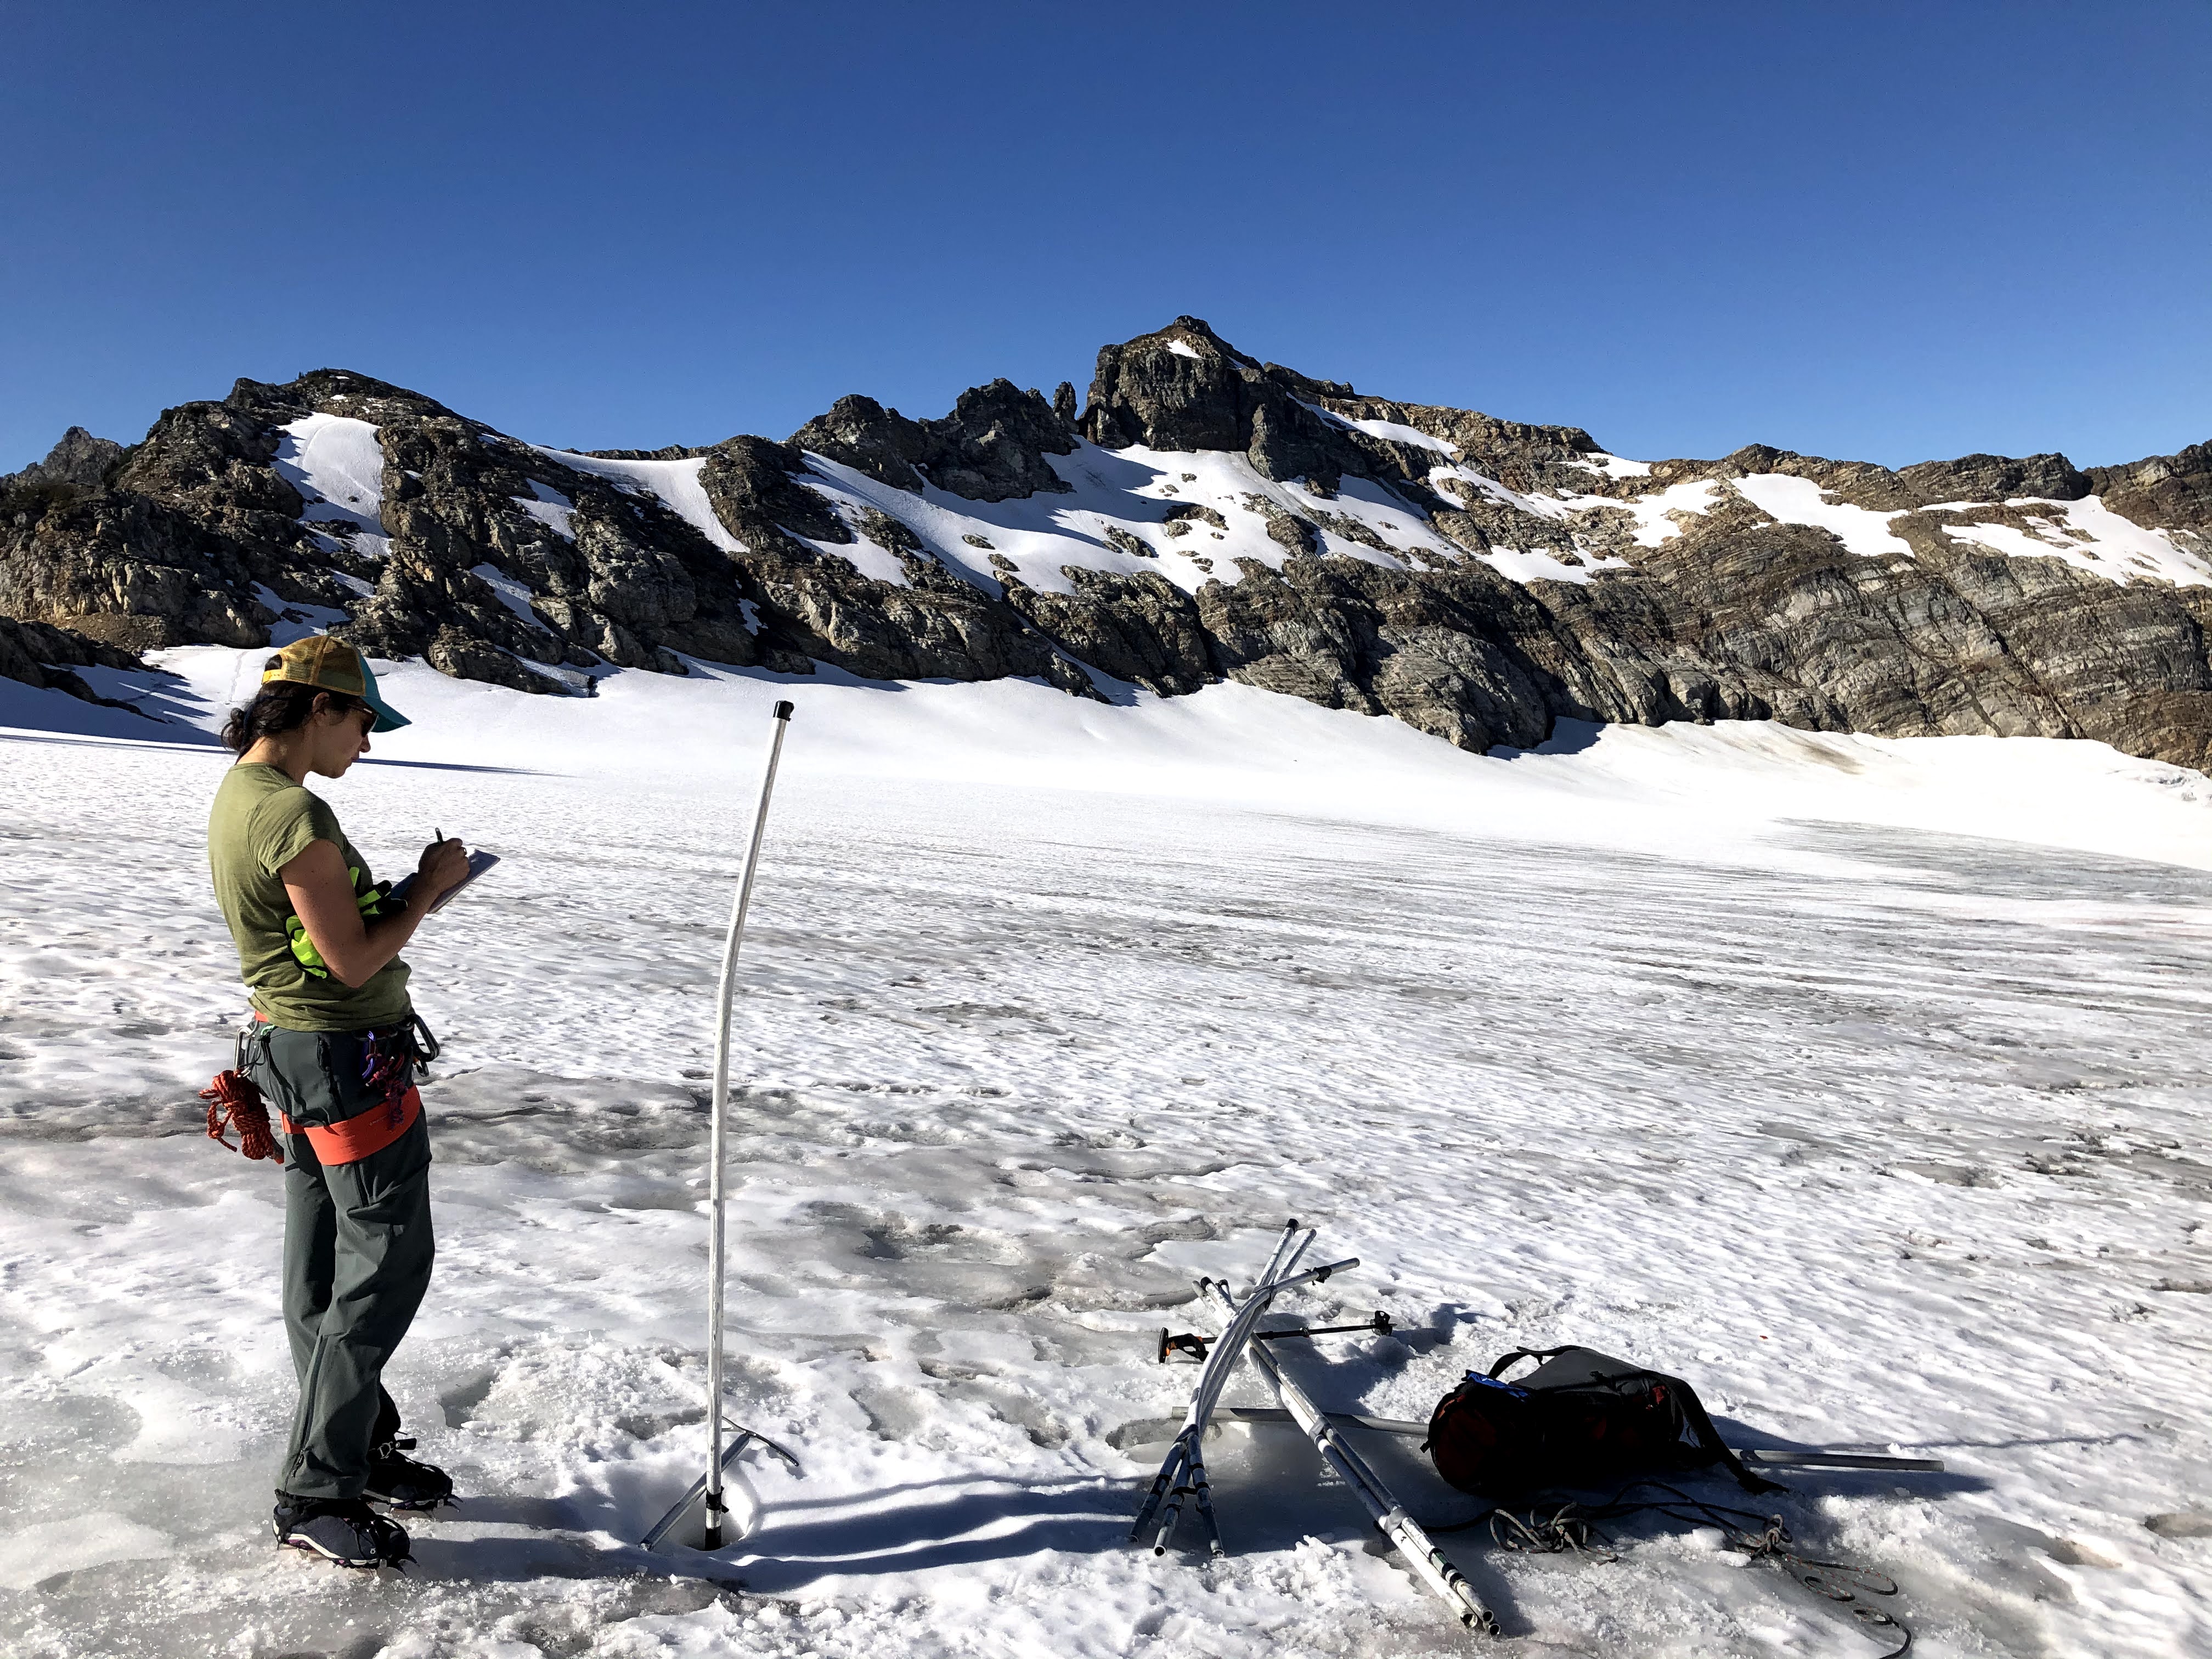
Recording observations at South Cascade Glacier, Washington, outside the eight northern regions. USGS, public domain. Published 6 October 2020; capture date unknown. Source
The Norwegian Polar Institute undertakes similar sustained work in Svalbard, measuring winter snow accumulation and summer loss to establish annual balances. Field observations on Austfonna also help check satellite measurements. The wide view from above and detailed work on the ice support each other’s interpretation. [5]
GlaMBIE combined field observations with optical, radar, laser and gravimetry satellite measurements. It brought together 233 regional estimates from 35 research teams to construct annual records for 2000–2023. No single instrument weighed the world’s glaciers. People made observations from different methods comparable. [6]
Meltwater changes the work of a fjord
In Svalbard’s Kongsfjorden, fresh meltwater emerging beneath a tidewater glacier rises and draws deeper seawater upward. The resulting flow can bring nutrients and zooplankton toward the surface, creating feeding opportunities for birds and other animals. A glacier participates in ocean circulation as well as storing frozen water. [7]Sediment carried by meltwater can also make the water turbid and limit light. If a glacier retreats from the sea onto land, the conditions for drawing up deeper water change. More melting cannot simply be described as uniformly beneficial or harmful to ecosystems. Researchers are investigating the consequences for coastal systems that also support fishing and tourism. [7]
Behind a mass-loss figure lie several connected scenes: birds gathering to feed, sediment-rich water and boats approaching a coast. Knowing how much ice was lost leads to questions about where water enters and which processes change. Move closer to the polar map and a planetary trend becomes a particular inlet.
In Alaska, changing ice reaches close to home
For communities near glaciers, how water is stored and released can become an immediate concern. On 5–6 August 2024, water held back by ice escaped into the Mendenhall Valley near Juneau, Alaska, causing a glacial lake outburst flood. The National Weather Service documented the event. A landscape changing over years can also release water over a much shorter interval. [8]A region’s annual glacier mass balance does not predict the date of an individual flood. Understanding local danger requires observations of water levels and the condition of the basin itself. Broad assessments and local monitoring work at different scales of space and time. Together, they connect changing ice to decisions about a place where people live.
From the northern ocean to distant shores
GlaMBIE estimates that the world’s glaciers lost about 6,542 Gt between 2000 and 2023, contributing approximately 18 millimetres to global mean sea-level rise. Unlike floating sea ice, ice stored on land adds water to the ocean when it is lost. Living far from the Arctic does not remove coastal communities from that movement of water. [6]In twenty seconds, one year becomes the next. White areas that first appeared to be fixed scenery become places continually receiving snow and releasing water. Measuring the remaining ice is more than counting a disappearing view. It helps us consider what people will need to understand as they continue living beside fjords, rivers and coasts.
Data and representation
Uses GlaMBIE for 19 regions across 24 years. Regional sums were checked against the global series. Values accumulate annual changes through the selected year.ETOPO 2022 contours and RGI 7.0 glacier distribution are fixed context. Regional names use reference locations; some regions contain widely separated glaciers.
The three Swiss glacier-outline comparisons remain available under View. They use two mapped epochs and do not represent global area change.
Fixed north-polar Lambert azimuthal equal-area map; discrete year-end cumulative values for 2000–2023, with a longer final-year hold in a 20-second film. The eight complete GlaMBIE regions are Alaska, Arctic Canada North/South, Greenland Periphery, Iceland, Svalbard, Scandinavia and Russian Arctic, not an aggregation clipped to the Arctic Circle. Total is their sum, excluding the Greenland ice sheet. RGI glacier distribution stays fixed. Short-line length is proportional to the absolute mass change; numbers carry its sign. No outline retreat is reconstructed.
The graticule uses 30-degree longitude and 10-degree latitude intervals as fixed geographic references.
Graticule strokes are 110% of the previous width, with small 50°N, 60°N, 70°N and 80°N labels.
Dashed leaders connect region labels to their reference locations. Thin solid lines show latitude and longitude; short solid lines below values show the magnitude of mass change.
Sources
- WMO · State of Global Water Resources 2025, 17 September 2026
- USGS · Fifty-Year Record of Glacier Change (2009)
- GlaMBIE / WGMS · Regional annual mass change, Dataset 1.0.0
- USGS · Measuring South Cascade Glacier
- Norwegian Polar Institute · Research & Environmental Management Programmes
- GlaMBIE · Results and community estimate, 2000–2023
- Norwegian Polar Institute · Melting glaciers: lifeline or threat for Arctic fjords and coasts? (14 March 2024)
- US National Weather Service · August 2024 Mendenhall River Flooding
Author
SORAH Editorial
October 8, 2026