Published on 09/October/2026 · Nature
Snow-poor winters — ski resorts and water resources
By SORAH Editorial
Across 40 years, 1982–2021, visit the day with the smallest estimated snow area in each March and follow the water held in snow across the Swiss Alps and their surroundings.
For someone riding a lift, snow is a surface to ski on. For people downstream, it is also water waiting to move. Zermatt, Verbier, Grindelwald, Davos and St. Moritz are familiar winter destinations. Placed on one map, their surrounding mountains begin to look like something else: a store of water shared across valleys and seasons.
In October 2026, Switzerland’s Institute for Snow and Avalanche Research, SLF, reported that November 2025 to April 2026 ranked among the ten least snowy winters in the observational record. Such reports give an individual season a place in history. Understanding the water held in mountains also calls for looking beyond that single winter. [4]
The water inside a white landscape
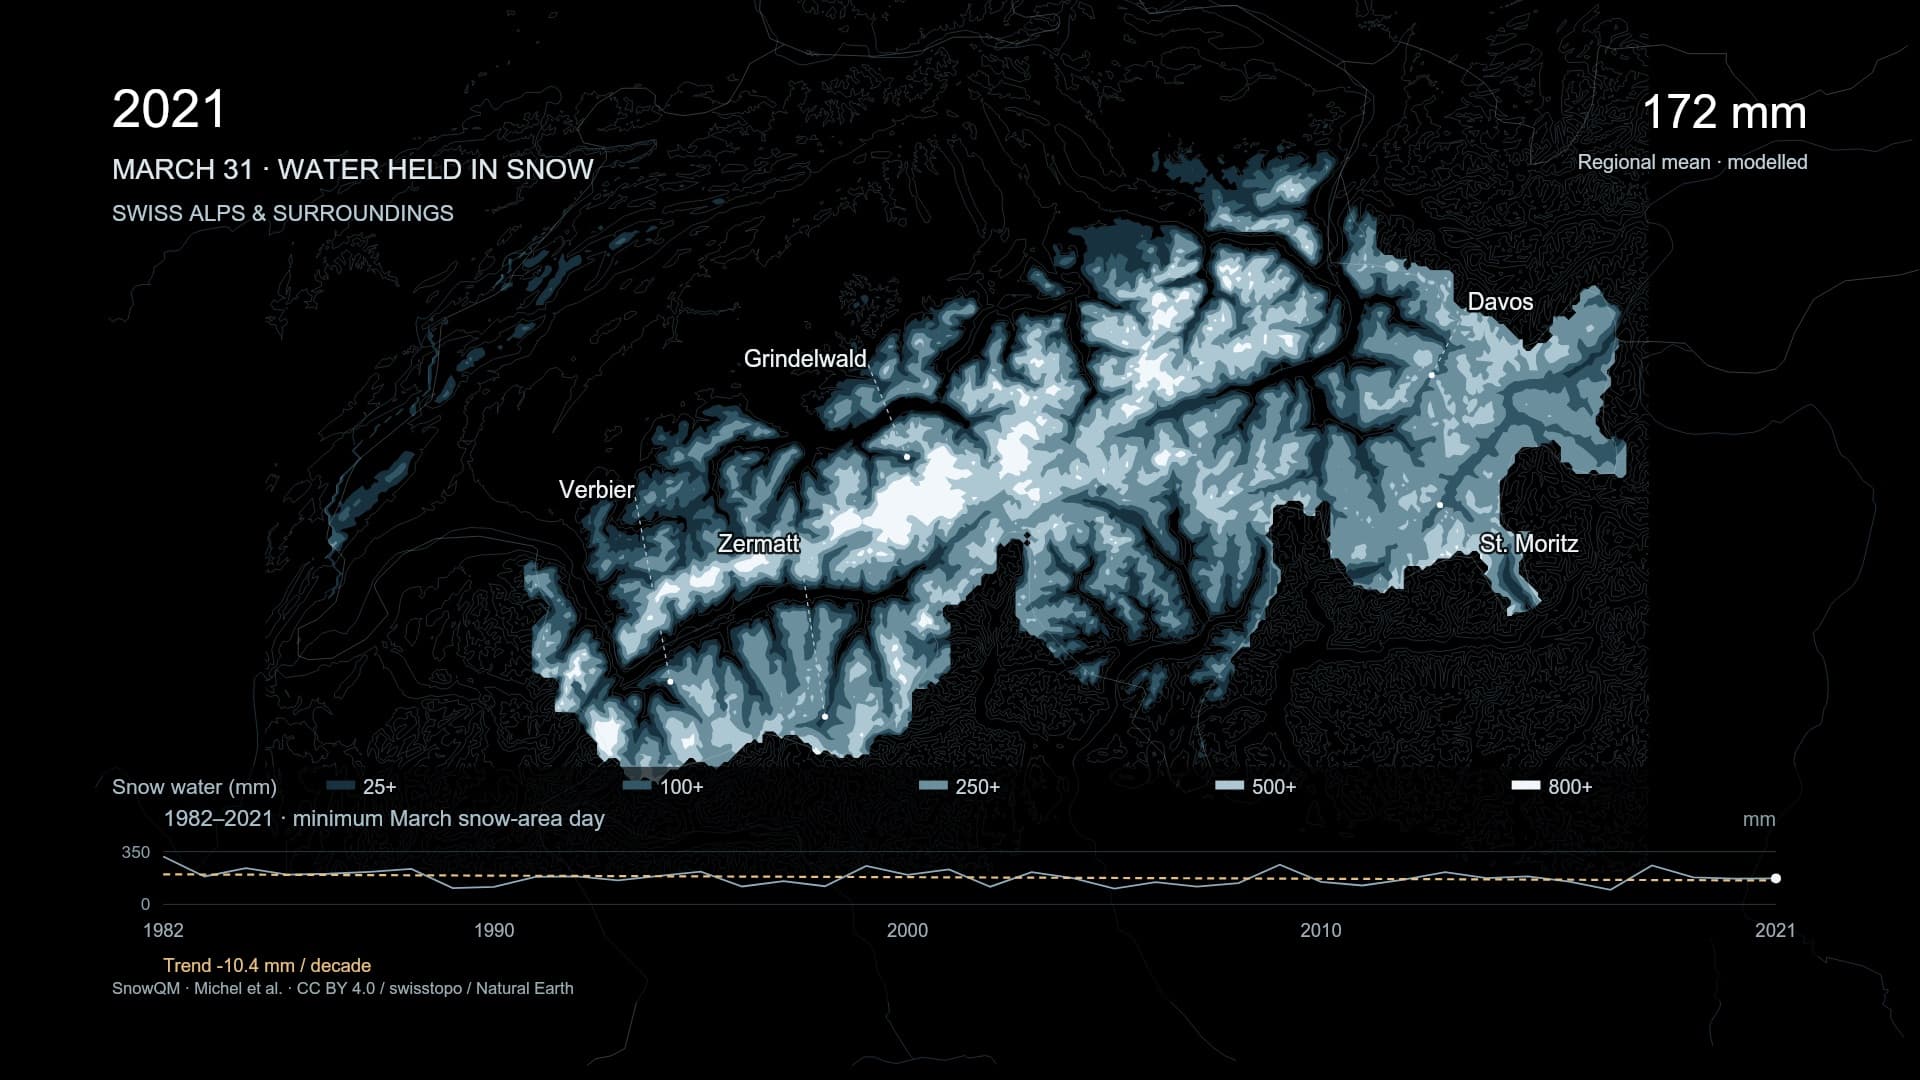
White area alone cannot tell us how much water remains. A shallow cover and a deep accumulation may both look white from a distance. This map shows snow water equivalent: the depth of water that would result if the snow melted. A value of 100 mm corresponds to 100 litres over one square metre. Brighter areas hold more water in snow.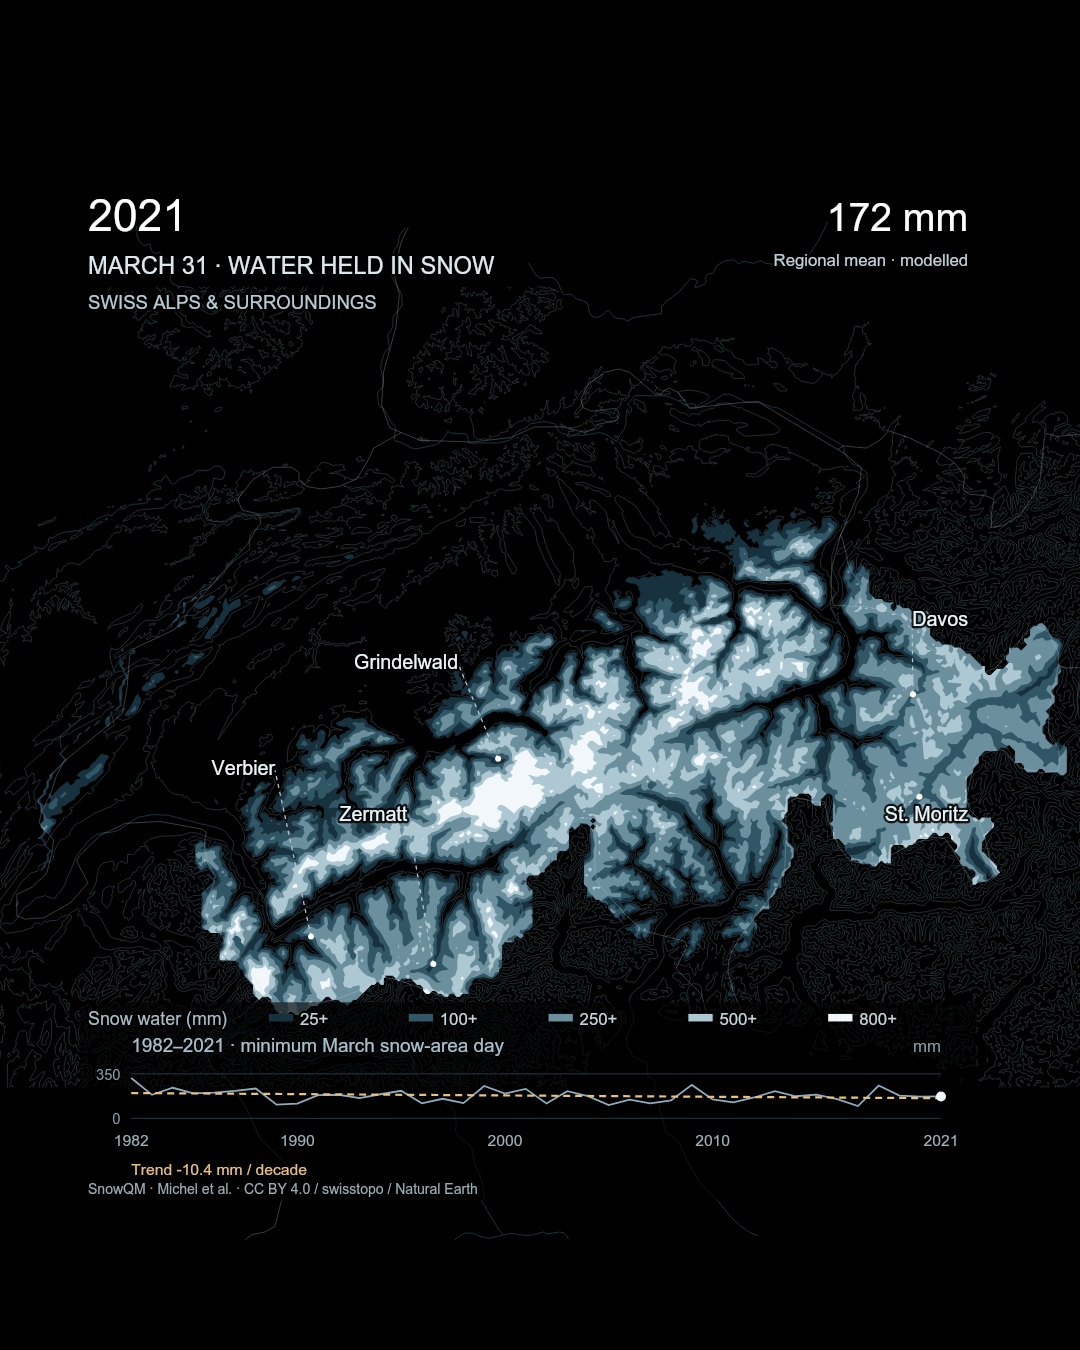
Forty years on one scale: selected-day snow water on the map and its regional mean on the chart.
For every March from 1982 to 2021, we selected the day with the smallest estimated snow area. In 1982 that was March 30; in 2021 it was March 31. Mean snow water over the fixed region was approximately 317 mm and 172 mm respectively. An intervening year was lower still: March 31, 2017 averaged 97 mm. The sequence does not move downward by the same amount each winter.
A winter’s fluctuations, a longer direction
The annual line rises and falls sharply. A straight line fitted through all forty selected-day values slopes downward by about 10.4 mm per decade. It includes snowy years as well as snow-poor ones, giving a different view from comparing only the first and last maps. A return of snow in one winter can coexist with a downward direction over decades.That distinction also changes how we place our own experience. A white mountain seen on a holiday is a real encounter with one slope in one season. It cannot, by itself, represent the water held throughout the range or the course of forty years. Advancing the map places a vivid individual memory within a longer record.
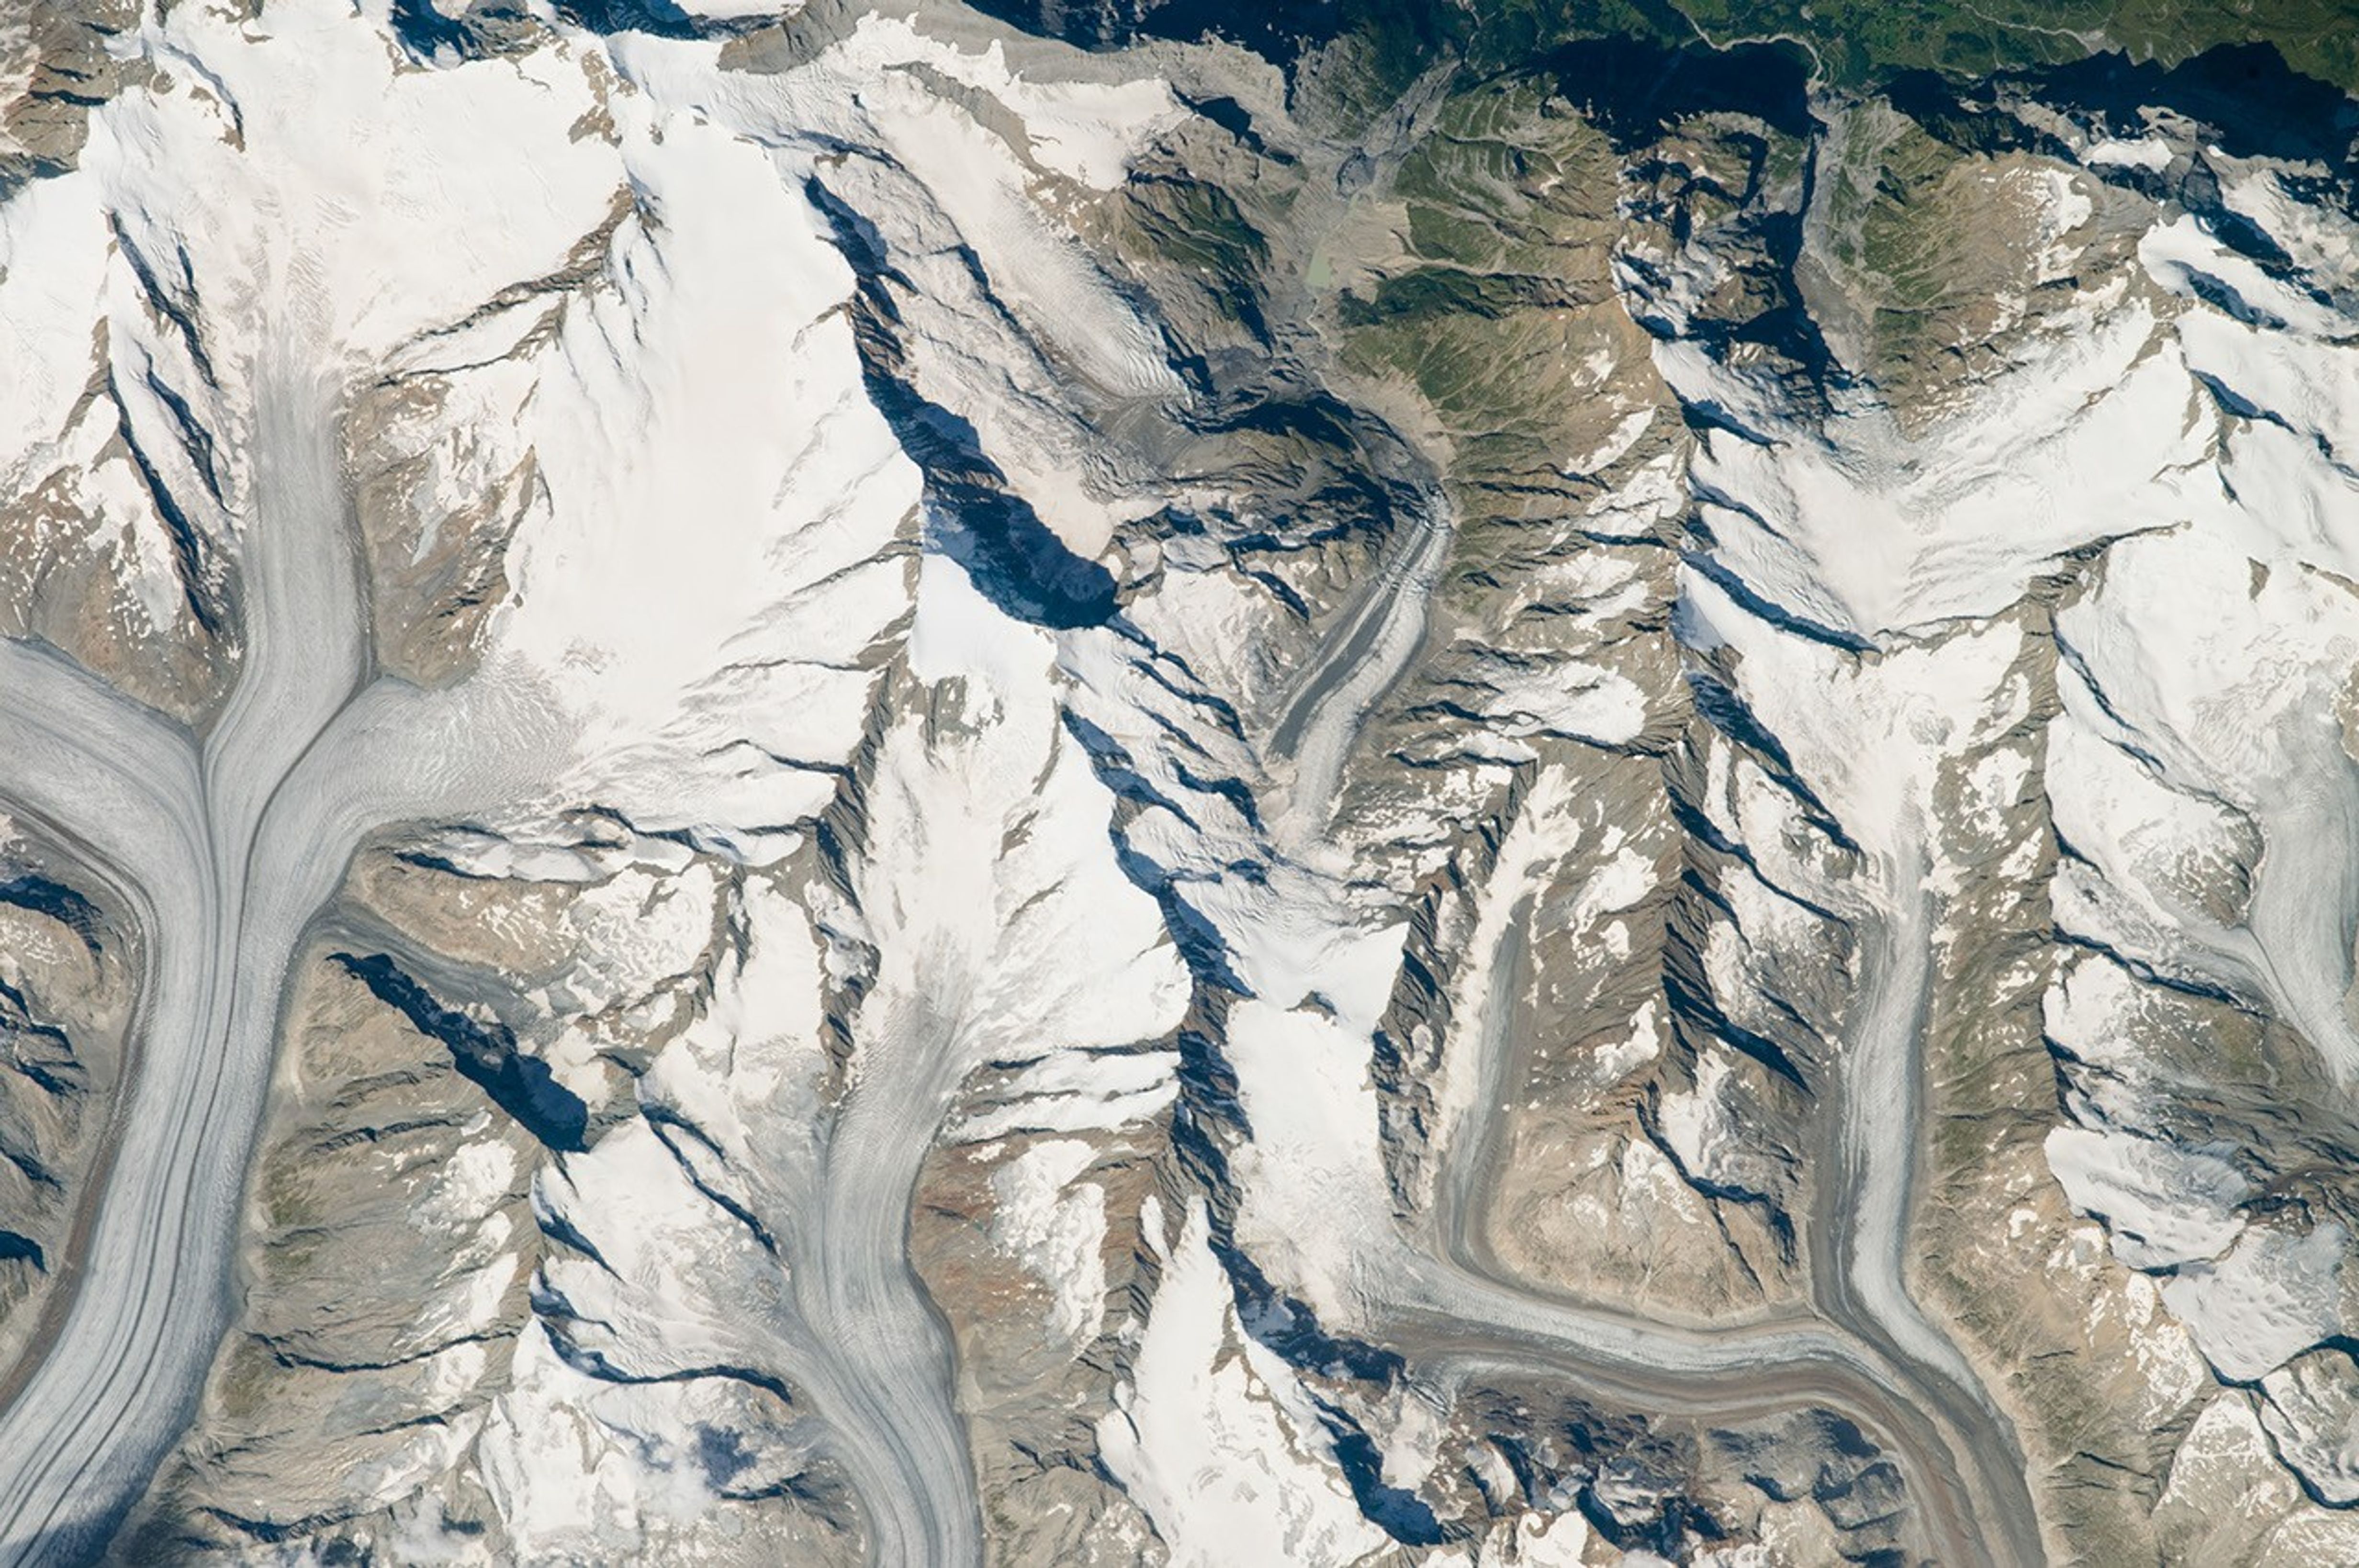
Photographed from the ISS on 3 September 2016. Landscape context, not a photograph of the March snow-water fields. NASA / JSC / Expedition 48, ISS048-E-72253. 出典 / Source
The ski season and the season downstream
Snow stores time as well as water. Precipitation that might otherwise run off sooner can remain in the mountains until melting releases it. SLF studies that seasonal store because its timing matters to rivers, lakes, hydropower and agriculture. A white slope is both a winter landscape and water awaiting another part of the year. [5]A ski area needs snow on particular runs at particular times. Communities downstream need usable water at times that may be different. Both depend on mountain snow while asking different questions of it. The presence of a white surface is only the beginning of understanding those shared needs.
Reading the store before it melts
SLF’s snow-hydrological forecasting translates daily assessments into information useful for water management. The practical question develops from “Was the winter snowy?” into “Where is water still stored, and when might it be released?” [6]Concern over snow-poor winters may begin with the experience of a ski season. A wider map brings the next season, and people farther downstream, into view. These forty years show past winters while inviting a question about what the mountains carry forward into spring.
Data and interpretation
Source: Michel et al. (2023), SnowQM publication-revision dataset, Zenodo 7886773, CC BY 4.0. Daily 1 km snow water equivalent. From its 1962–2021 coverage, all 31 March days for 1982–2021 were acquired and date-checked: 1,240 daily fields. This fixed release is distinct from the 2025 SPASS update.Unit reconciliation: the climatology header says millimeter, but the author code writes m, labels SWE (m), and packages data in mSWE. The paper’s 0.5 mm cutoff is implemented as 0.0005. Following these primary-source definitions, values are converted from metres to millimetres by ×1,000; the conflicting attribute is retained in the production record.
Selection: this long record has no fractional snow-cover variable. Estimated snow area is therefore defined as the number of cells with SWE ≥1 mm × 1 km². The minimum among March 1–31 is selected each year, with exact ties assigned to the earlier date. Displayed SWE is from that date, not the minimum-water date or a March mean. The threshold affects thin-snow classification.
A fixed mask of 42,354 cells (42,354 km²) is valid on all 1,240 days. Regional SWE includes snow-free zeros and excludes missing or out-of-domain cells. R05 used 250 m SCF-based area for 2016–2025. The resolutions and definitions differ; the series have not been spliced. All 40 years here use one model series.
Map bands begin at 25, 100, 250, 500 and 800 mm; smaller values are uncoloured. Display polygons are simplified; statistics use the original 1 km grid. Contours are 500 m apart. Names mark settlement centres, not snow measurements at individual resorts.
Trend lines are ordinary least-squares fits of all 40 annual selected-day values against year, with change per decade shown. They describe this series, including annual variability and changing selected dates; they are not causal attribution, whole-winter averages or forecasts. SWE is neither downstream water delivery nor ski-resort operations.
Sources
Author
SORAH Editorial
October 9, 2026