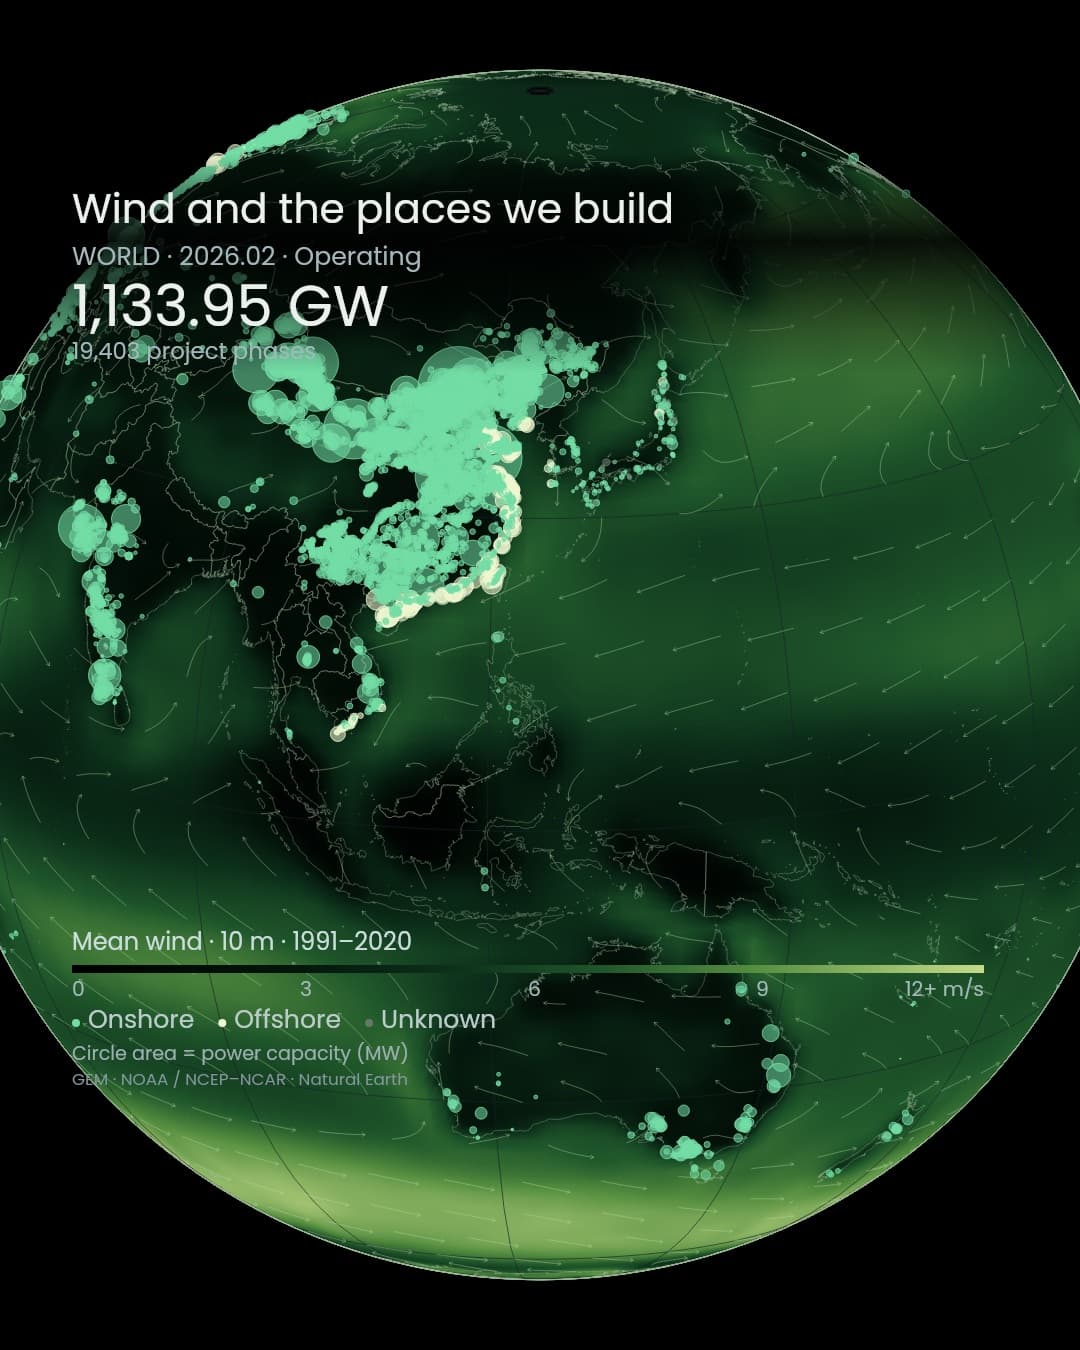
Onshore and offshore wind farms meet a global climatology of wind speed and direction.
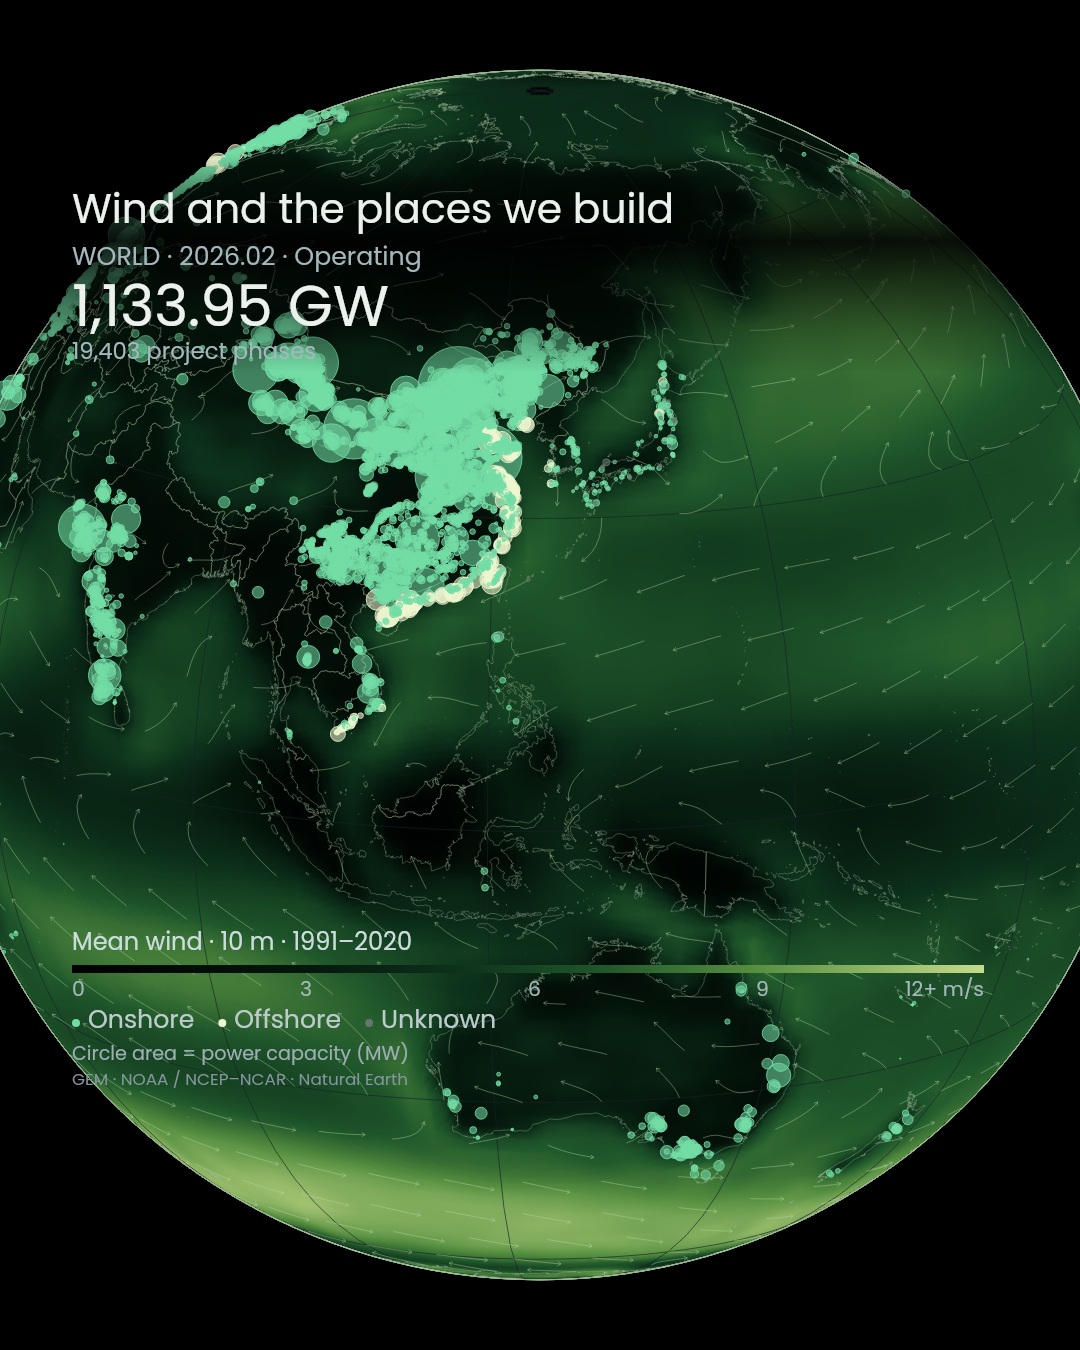
Wind crosses continents and open seas. Yet colouring the windiest places does not produce a map of wind farms. Their locations also reflect grids, ports, land and ocean uses, and relationships with the people living nearby.
In Global Energy Review 2026, published in April 2026, the IEA estimated that global wind capacity additions reached about 160 GW in 2025, nearly 40% above the previous year. Where is infrastructure on that scale being built, and how does it overlap with the wind? A global view lets us ask the question across land and sea together. IEA estimates for 2025
Air we cannot see, equipment we can
A turbine blade uses aerodynamic forces, like an aircraft wing, to produce rotation and drive a generator. Terrain, vegetation and water bodies modify the wind, so conditions can differ even between nearby places. US Department of EnergyThe green surface in this globe represents a 1991–2020 wind-speed climatology from the NCEP–NCAR reanalysis provided by NOAA. It describes wind 10 m above land and sea. Fine lines follow the mean direction. This is neither today's weather nor a replay of air moving on a particular day. NOAA PSL data
The circles represent project phases in the GEM public map downloaded as the February 2026 edition. Its 19,403 operating phases total 1,133.95 GW. These are not individual turbines: separate development phases can belong to one wind project. The wind surface and the facility circles measure different things.
Strong wind does not settle the question
Separating operating facilities from construction and planned projects distinguishes today's infrastructure from developers' intentions. GEM tracks large onshore and offshore projects, recording their status, capacity and location. A proposed circle is not a promise of future electricity output. GEM trackerEven where wind is available, electricity needs a route to its users. DOE's siting guidance describes local meteorological measurements, access to transmission and assessment of environmental and community effects. The green surface is an entry point to those questions, not a finding that a site is suitable for development. Wind siting and investigation
The IEA's Renewables 2025 report also examines permitting, grid-connection waits, finance and supply chains as factors shaping wind deployment. The geography of moving air meets the geography of delivering electricity. The same is true offshore: a wind farm at sea is not infrastructure that ends at the shoreline. Renewables 2025
At the foot of a turbine
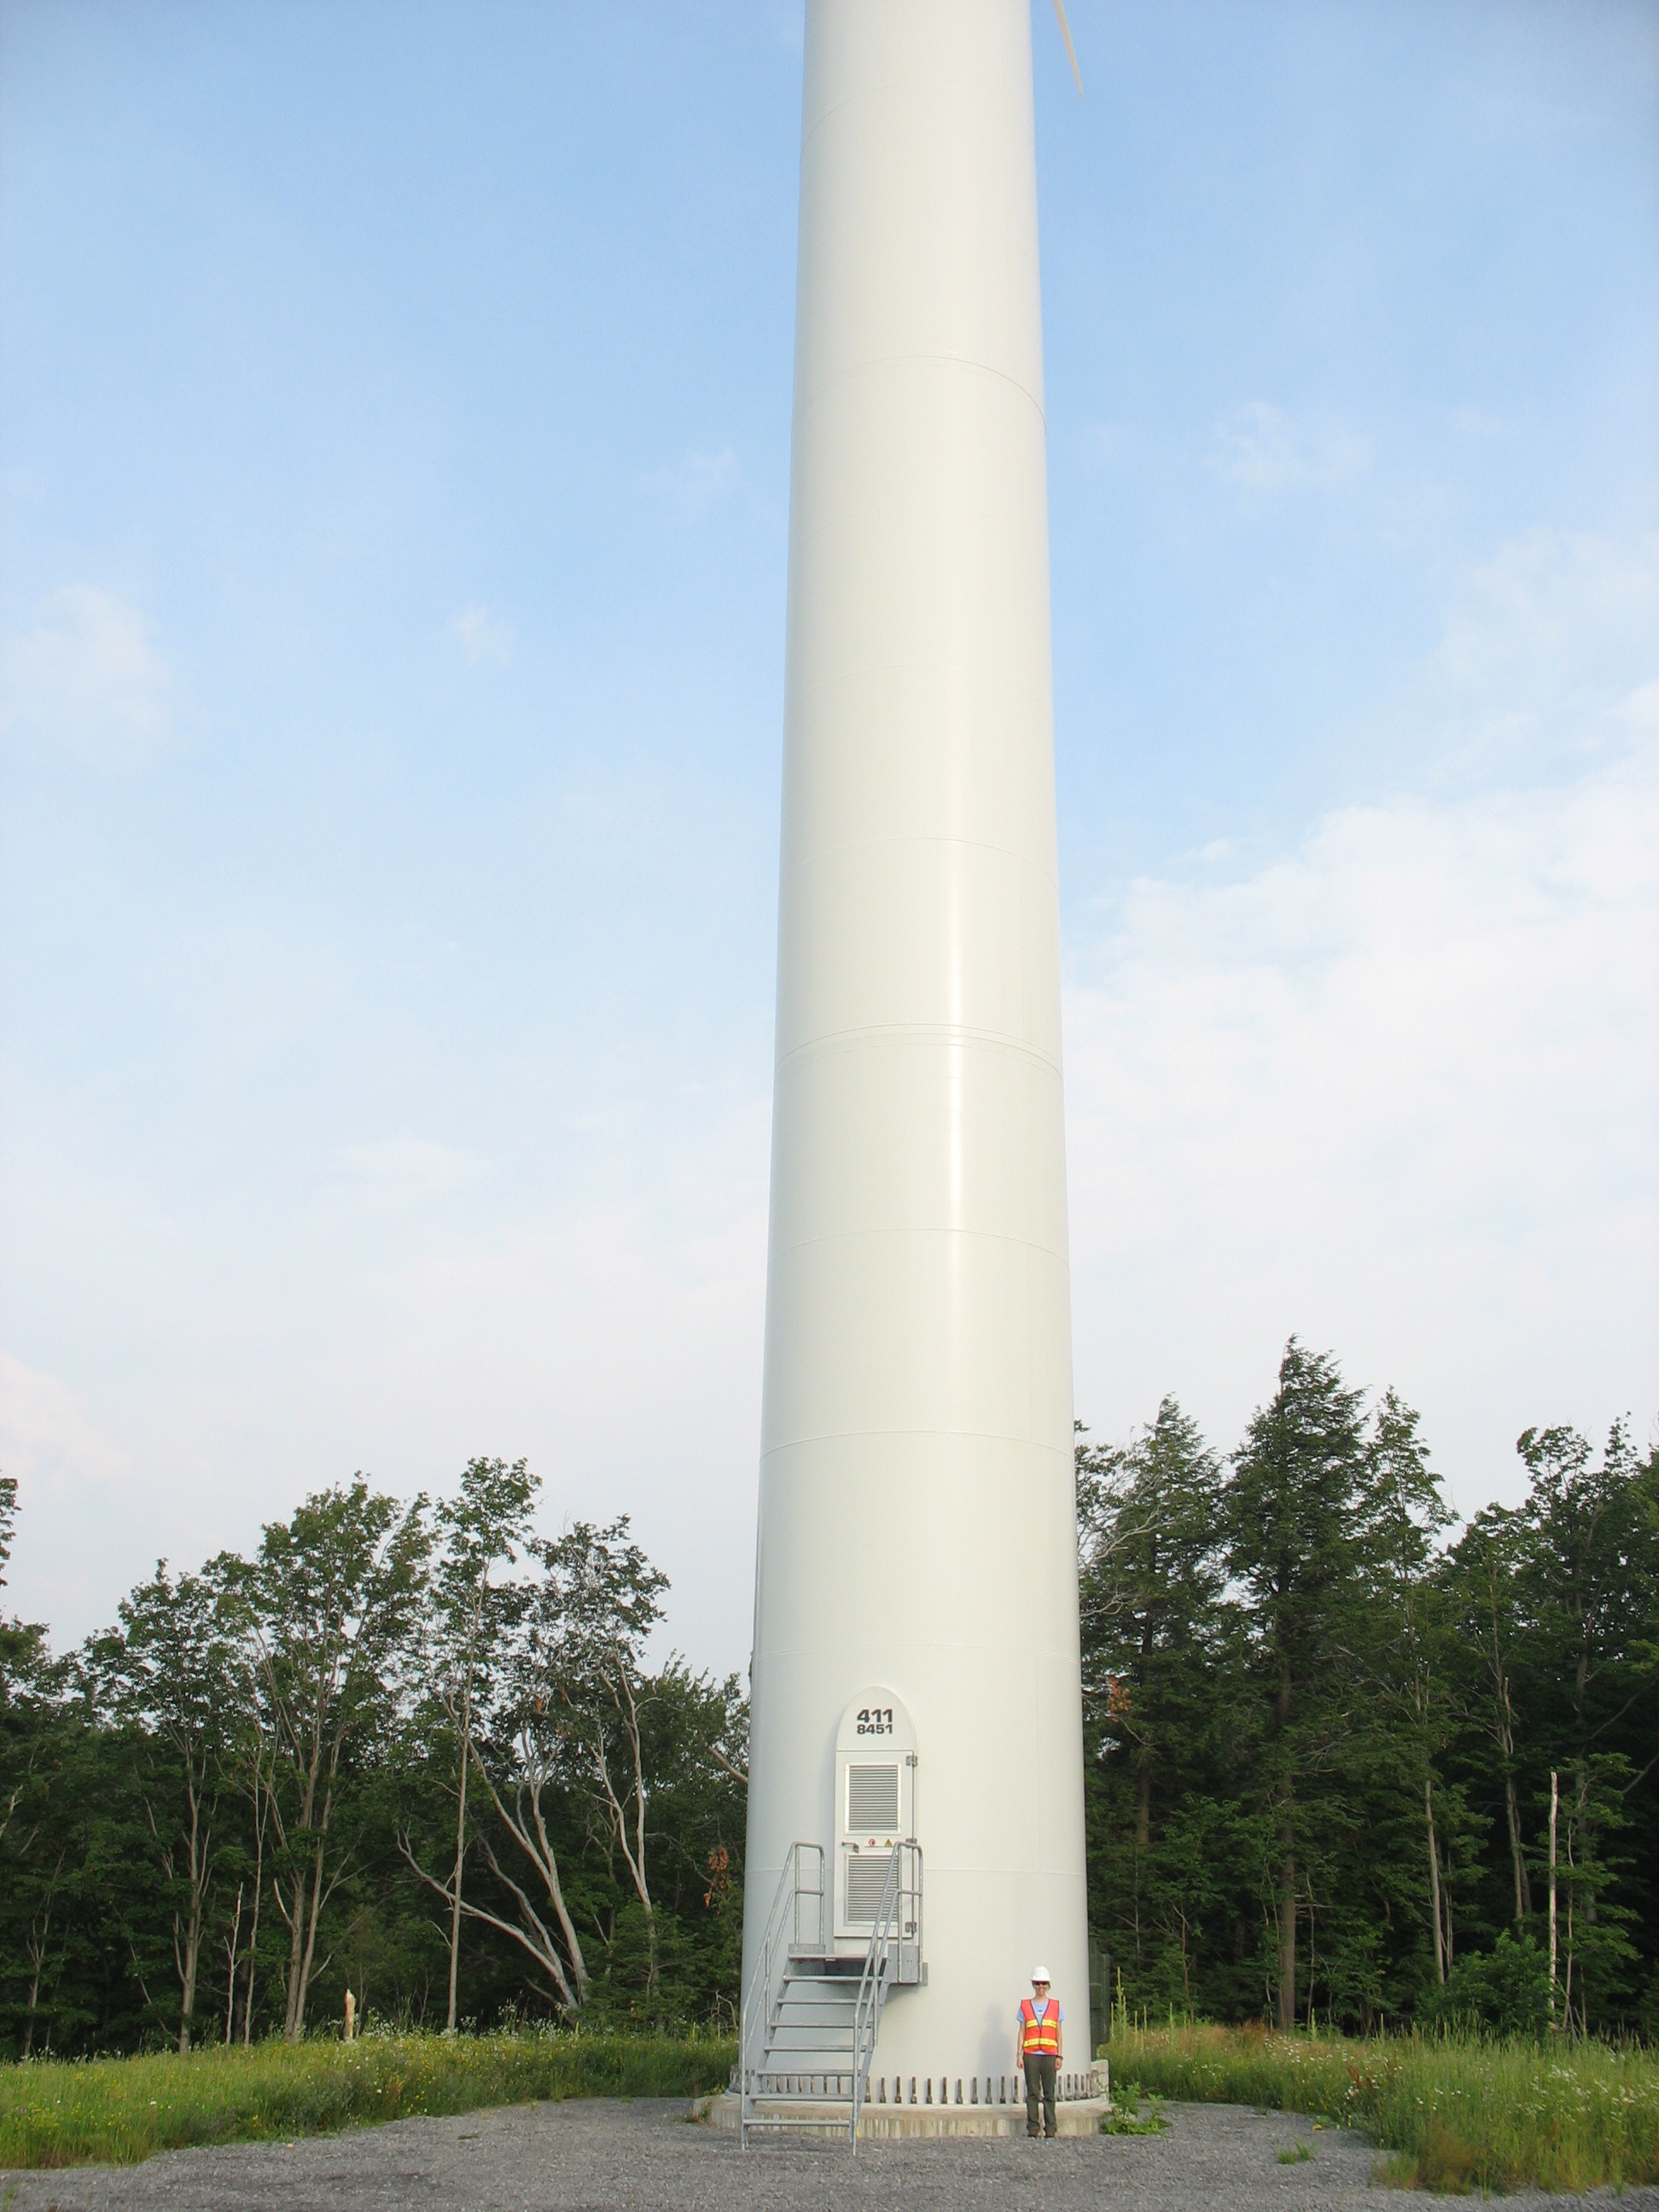
Field biologist Apple Snider beside a wind turbine in New York. Photograph date not supplied by the source. Paul Cryan / USGS, Public Domain. The photograph returns a small circle on the globe to the scale of equipment on the ground. Photo source
The space around a turbine includes birds and bats, habitats and the everyday uses of a place. DOE's siting resources combine wildlife investigation before construction with assessment after operation begins. Reading the movement of air and studying the living things that use that space become related tasks at the same site. DOE birds and bats resources
The Japan detail view switches to a Global Wind Atlas model at 100 m. Its height, period and resolution differ from the global 10 m layer, so their colours cannot be compared directly. A terrain-sensitive wind model offers a step from broad geographical patterns towards local conditions. Global Wind Atlas methods
A windy place does not always contain a wind farm. Looking for the distance between where wind passes and where electricity is produced opens another set of questions. Behind that distance lie surveys, infrastructure and local decisions: the work that gives the circles their place on the globe.
Data and representation
Facilities: downloaded GEM Global Wind Power Tracker map, fixed as the February 2026 edition, with 35,089 total records. Recalculation gives 19,403 operating phases and 1,133,953.6 MW. The main threshold is 10 MW; approximate coordinates are included. GEM's current overview lists 32,227 phases and 1,129 GW operating, which does not match the retrieved map. This work retains the downloaded edition without adjusting it to the overview. Circle area denotes MW, not turbine count or electricity output.Global wind: NOAA PSL / NCEP–NCAR Reanalysis 1, 10 m, 1991–2020. Monthly climatologies are weighted by month length to form annual means. Native grid: 192 × 94, 1.875° longitude and Gaussian latitude. Colour encodes climatological daily-vector wind speed; short streamlines use annual mean u/v. Polar missing data is not extended. Interpolation smooths presentation without adding measured detail. Line animation illustrates mean direction, not observed parcel trajectories or speeds.
Japan: Global Wind Atlas 4.0, 2008–2017, 100 m, approximately 250 m. The two layers are not directly comparable and do not establish project-specific output or siting suitability. GEM: CC BY 4.0. Global wind: NOAA PSL, Boulder, Colorado, USA. Japan wind: Global Wind Atlas / DTU and World Bank Group, CC BY 4.0. Geography: Natural Earth, Public Domain. Editorial verification: 10 October 2026.
Sources
Author
SORAH Editorial
October 10, 2026