Published on 10/October/2026 · Energy
Geothermal power: turning Earth’s heat into energy.
By SORAH Editorial
A world of power plants built to turn underground heat into electricity.
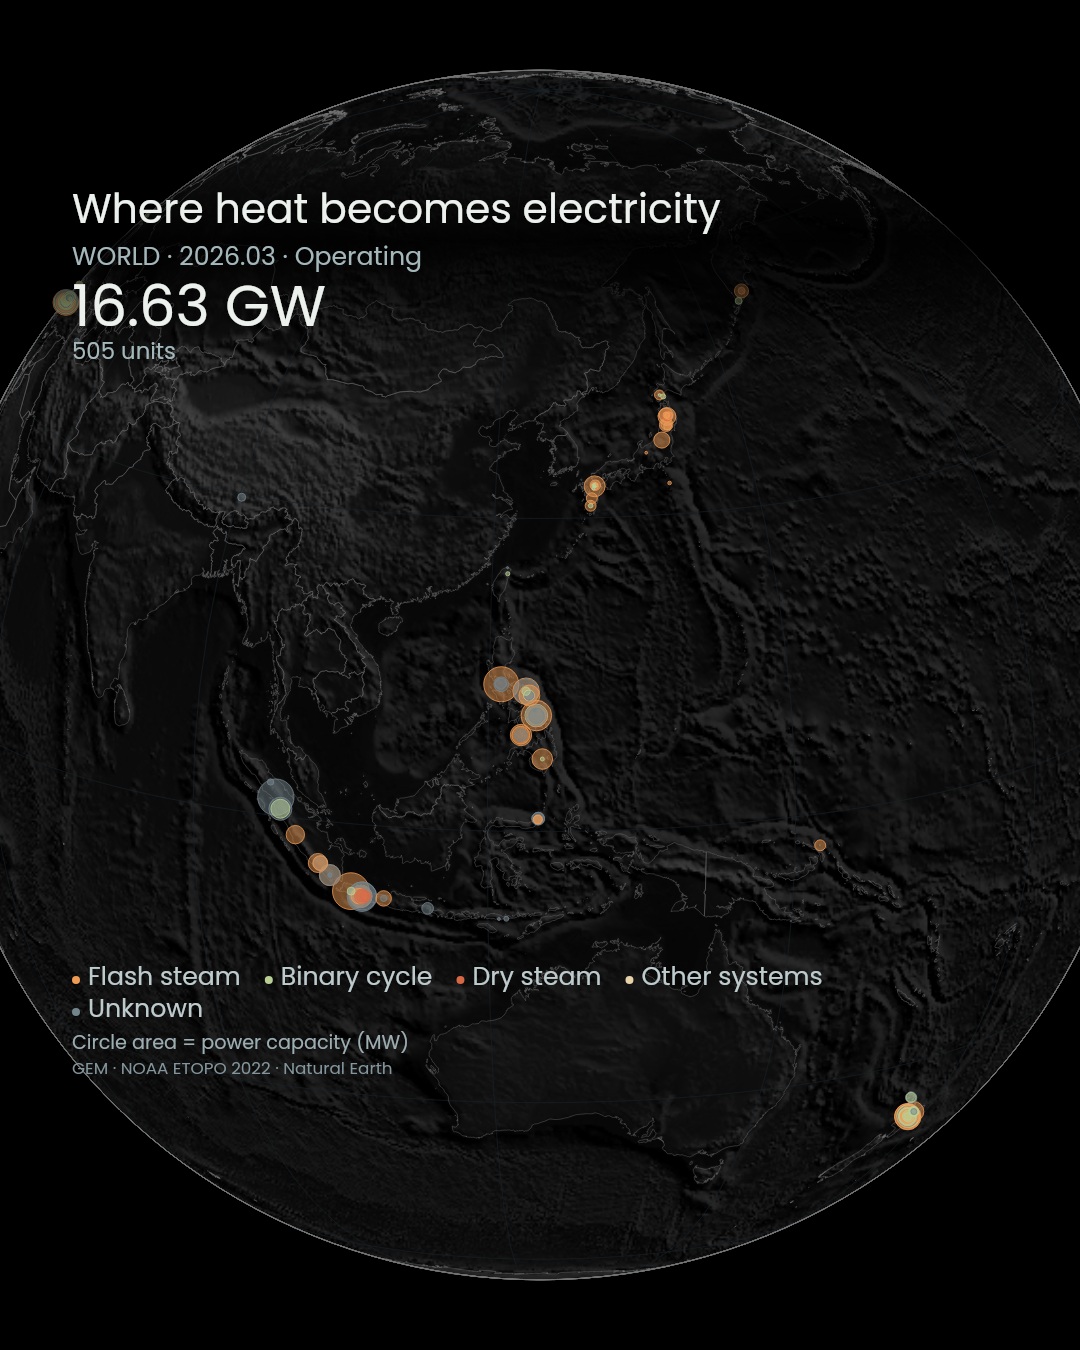
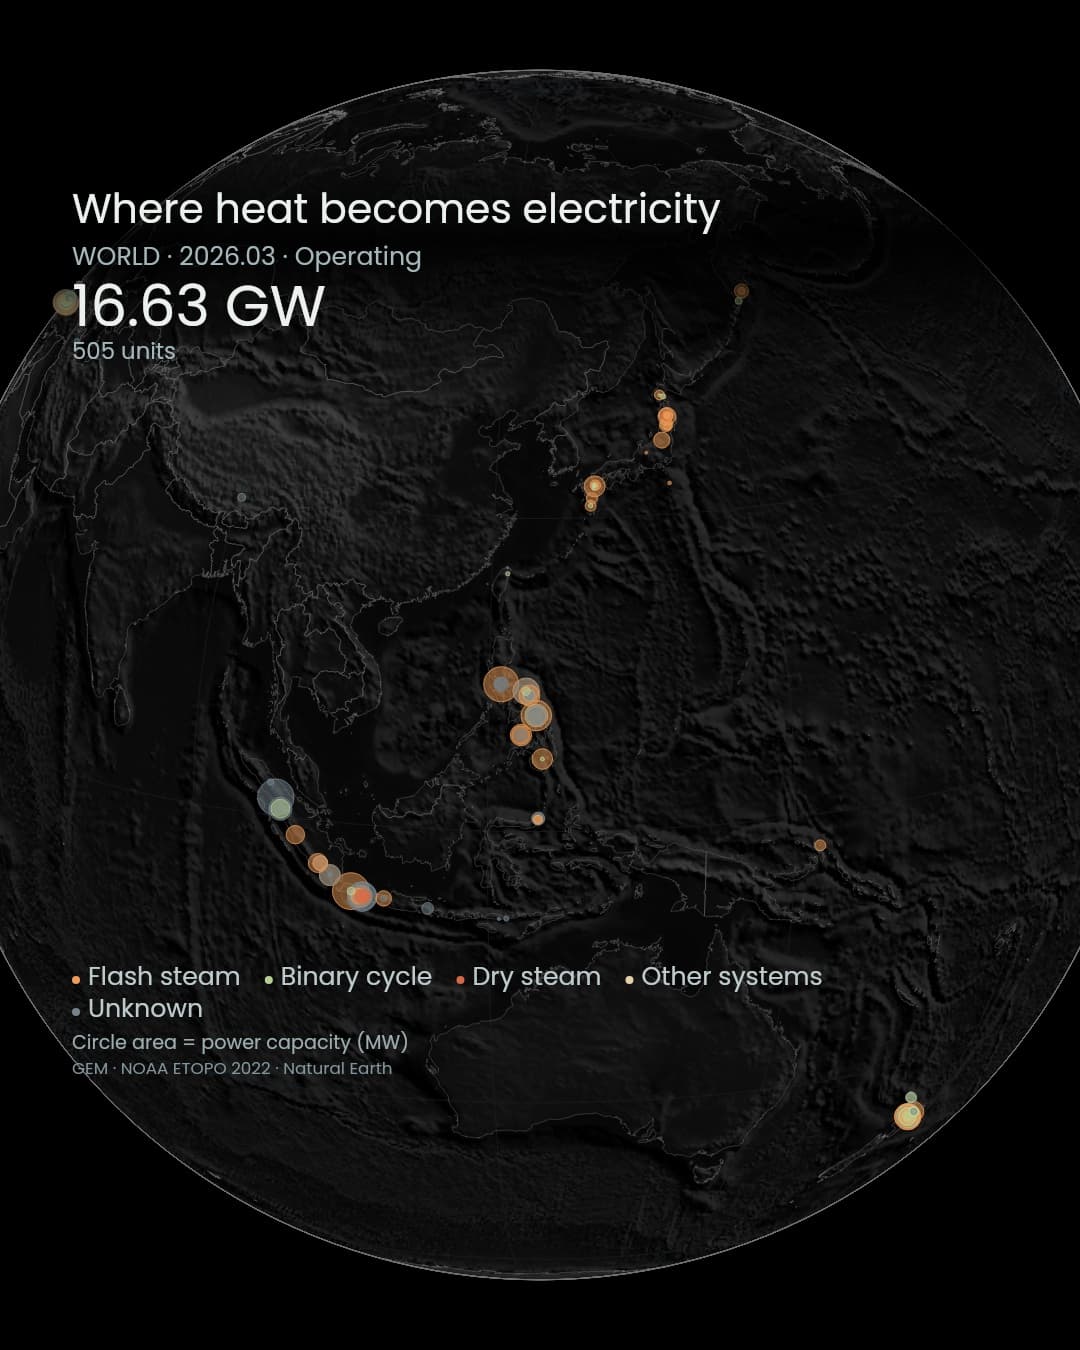
Iceland, Kenya, Indonesia. Placing their power plants on a globe reveals the places where people have learned to reach underground heat. That heat is beneath our feet, but bringing it to the surface and delivering electricity takes wells, pipes and years of investigation.
Investment is now gathering around the possibility of changing that geography. In an analysis published on 23 January 2026, the International Energy Agency reported that financing for next-generation geothermal reached about US$2.2 billion in 2025. Advances in drilling and supply agreements with customers needing dependable electricity helped drive the increase. Financing is a measure of investment activity, not proof that every proposed plant has been built. IEA analysis
Heat underground, infrastructure above
The March 2026 Global Energy Monitor map downloaded for this project records 505 operating geothermal units with a combined capacity of 16.63 GW. A unit is not necessarily a whole power station: several units can share one site. The circles encode their generating capacity, not the amount of heat in the ground or electricity produced over a year.Changing from operating units to construction and planned projects separates existing supply from prospective development. The resulting geography is also a record of investigation, finance, land use, grid connections and local decisions. It describes infrastructure that people have built or proposed, rather than a complete inventory of geothermal resources. GEM tracker and definitions
What makes a promising location?
Conventional geothermal development needs three things together: heat, water to carry it, and pathways through the rock. Volcanic regions such as Japan and Indonesia can offer strong prospects because underground magma heats surrounding rock. Water that infiltrates from the surface can collect as hot water or steam in fractures, forming a geothermal reservoir. JOGMEC: how geothermal power worksHot springs and steam vents offer clues, but usable resources can also lie beneath ground with no conspicuous surface signs. A hot spring alone does not establish that a site has enough heat or sustained flow for power generation. Surveys and exploratory wells test the depth, temperature and productivity of the reservoir. US Department of Energy: hydrothermal resources
Possibilities also extend beyond volcanic areas. Deep sedimentary formations can hold thermal resources, and their use for electricity is being investigated. Reaching deeper heat raises drilling challenges and costs. Grid access, financing, existing water uses and local relationships also influence whether a promising resource becomes a working project. DOE: geothermal electricity, IEA: the future of geothermal
Three ways to turn heat into electricity
Flash-steam plants release steam by reducing the pressure of hot water, then use that steam to drive a turbine. Single-flash plants separate steam once; double-flash plants extract further steam from the remaining hot water. JOGMEC: steam generationBinary-cycle plants transfer geothermal heat to a separate fluid with a lower boiling point than water. Its vapour drives the turbine. Separate geothermal and working-fluid circuits allow lower-temperature resources to be used than in flash systems; small installations drawing on hot-spring heat can use this approach. JOGMEC: binary generation
Dry-steam plants take steam-rich fluid from the reservoir and send it to the turbine. These naturally steam-dominated resources are relatively uncommon. The map groups equipment into these three technologies, plus other systems and unknown types. DOE: power-plant technologies
Different ways to access the underground heat
Resource development is a separate distinction from the power cycle. Conventional hydrothermal systems use naturally occurring hot water or steam and permeable rock. Enhanced geothermal systems (EGS) improve circulation through hot rock where natural flow is insufficient. Closed-loop systems circulate fluid inside sealed underground pipes, collecting heat from the surrounding rock rather than relying on flow through its fractures. DOE: next-generation geothermalThese approaches aim to extend development beyond naturally productive hydrothermal regions. How heat is collected underground and how it becomes electricity at the surface are two different classification axes. Heat from EGS, for example, is delivered to surface generating equipment suited to the conditions. Colours in this map identify power-plant technology; they do not map areas suitable for EGS or other future development.
Wells in Kenya, monitoring in California
Olkaria, Kenya, lies within Hell's Gate National Park, about 120 km from Nairobi. The operator KenGen describes drilling in the 1960s, followed by geological and geophysical surveys; the first generating unit began operating in 1981. Investigating fractures, drilling wells and separating and piping steam are the work compressed into a single circle on the globe. KenGen's development historyIn California's Long Valley Caldera, the Casa Diablo facility uses underground hot water. Returning that water to the ground does not automatically eliminate hydrological effects. The US Geological Survey measures flow and chemistry at Hot Creek and monitors changes nearby. Power production and the observation of an environment sharing the same thermal system continue side by side. USGS field account
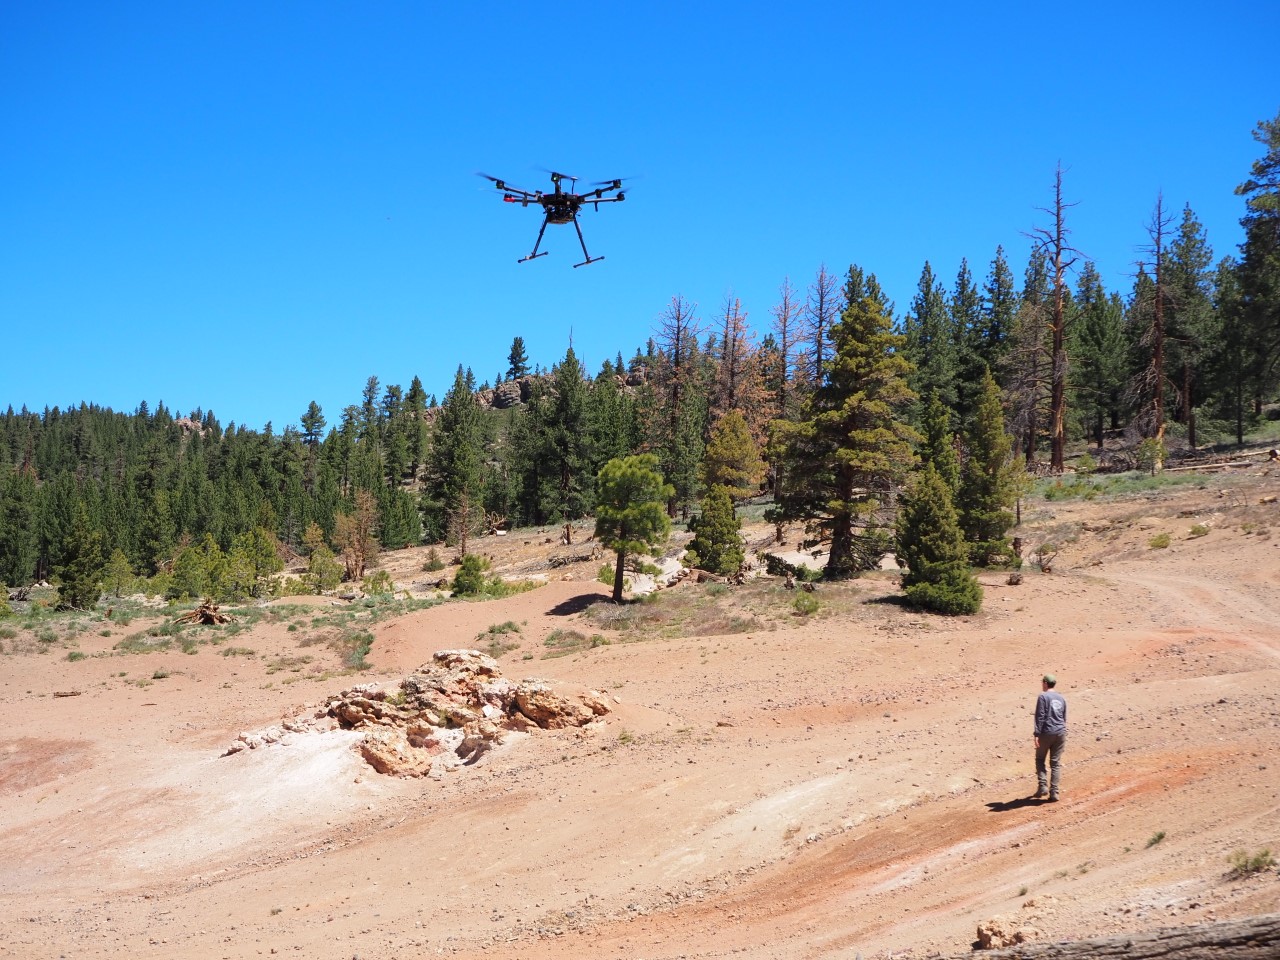
Gas monitoring near Mammoth Lakes, California, approximately November 2021. Jonathan Glen / USGS, Public Domain. This documents environmental fieldwork in a geothermal area, not a measurement of electricity generation. Photo source
Knowing the ground before expanding the map
Next-generation systems seek to reach deeper heat and rock through which fluids do not naturally circulate easily. The IEA's 2024 geothermal report identifies experience from oil and gas drilling and subsurface assessment as useful, while highlighting upfront risk, permitting and environmental and social conditions. The Future of Geothermal EnergyEvery additional circle has investigated rock beneath it and electricity users beyond it. A geothermal location is not established only by drilling a successful well. Its place on the map also rests on the continuing work of operating equipment and observing the surrounding water and land.
Data and representation
Facilities: GEM Global Geothermal Power Tracker, downloaded March 2026 map edition. The 834 retrieved records form the denominator; recalculation gives 505 operating units and 16,626.76 MW. GEM's overview lists 835 units. The one-record difference remains unresolved and is disclosed. The main threshold is 1 MW. Retired, mothballed, cancelled and shelved records are excluded from the view. Co-located units with the same technology and status are grouped. Prospective projects are not guaranteed additions.Circle area is proportional to MW; colour indicates technology. Names are omitted within the graphic and available by selecting circles in the explorer. The fixed terrain background uses NOAA ETOPO 2022 elevations and bathymetry; it does not represent subsurface temperature or heat reserves. Global and Japan views use the same facility data. GEM data: CC BY 4.0. Terrain: NOAA NCEI. Geography: Natural Earth, Public Domain. Editorial verification: 10 October 2026.
Sources
- IEA analysis
- GEM tracker and definitions
- JOGMEC: how geothermal power works
- US Department of Energy: hydrothermal resources
- DOE: power-plant technologies
- The Future of Geothermal Energy
- JOGMEC: steam generation
- JOGMEC: binary generation
- DOE: next-generation geothermal
- KenGen's development history
- USGS field account
- Photo source
Author
SORAH Editorial
October 10, 2026