Published on 21/October/2026 · Space
Asteroids repeatedly pass near Earth — measuring an approach against the Moon
By SORAH Editorial
Small bodies repeatedly cross inside the Moon’s distance. The passage of 2026 TN77 connects that scale and motion with the observations that reveal an orbit.
Close approaches are recurring events
Small bodies travel through the space around Earth. In a 2014 estimate, NASA/JPL described several dozen asteroids about 6–12 metres across passing closer than the Moon each year. Even within this defined size and distance range, approaches recur. We live on a planet moving through the Solar System alongside smaller bodies.NASA/JPL — Close-pass frequency estimate (14 February 2014)
Each encounter has its own body size, separation and speed. Following one object through time reveals a sequence: it approaches, reaches its closest point and recedes. Asteroid 2026 TN77, which passed Earth on 12 October 2026, provides a concrete example.
JPL Horizons — ephemeris system · ESA NEOCC — computer access
TN77 passed at about one-seventh of the Moon’s distance
ESA lists TN77’s closest geocentric distance as about 55,400 km. Against a mean lunar distance of 384,399 km, that is approximately 0.144 times the distance to the Moon, or about one-seventh. Measured from Earth’s centre, the separation corresponds to roughly 4.3 Earth diameters; Earth’s mean diameter is 12,742 km.ESA NEOCC — computer access · NASA — Moon / Earth mean radius · ESA — TN77 estimated diameter
TN77 itself is estimated to be 10–21 metres across. In a scene that draws Earth and the Moon at one common scale, its body is smaller than a pixel. A very small object crosses the space beside a much larger planet. Seeing both the difference in size and the wide interval inside the Moon’s distance gives the word “near” a physical meaning.
Earth and asteroids share a long Solar System history
Asteroids preserve rocky material left from the formation of the Solar System about 4.6 billion years ago. Earth, about 4.54 billion years old, formed within that same system. Looking at small bodies moving near our planet connects the present scene with material from the era when planets formed.NASA — Asteroid facts · USGS — Geologic time and Earth’s age
Part of that history is preserved on the Moon. A 2019 study of large lunar craters reported a formation rate two to three times higher during approximately the last 290 million years than during the preceding 700 million years. Dating the impact record reveals long-term changes in the encounters between small bodies and planetary surfaces. The Moon is both a distance reference and a place where the Solar System’s past remains visible.
NASA — Lunar craters and impact history (17 January 2019)
Recording a passage within humanity’s timespan
Our species, Homo sapiens, appeared about 300,000 years ago. Within this comparatively brief part of Earth’s history, we developed instruments that measure the positions of faint small bodies. Motion that long predates our species can now be assigned names, times and coordinates.Smithsonian — Homo sapiens · NASA/JPL — Studying and tracking asteroids
Observers measure positions in images of the sky and send them to the Minor Planet Center. Combining positions with their observation times allows an orbit to be calculated and indicates where to search next. Looking again at the predicted location extends the record. Through that repeated work, a point of light visible for a short interval becomes an object that can be tracked.
NASA/JPL — Studying and tracking asteroids
Observations reveal a path and help look ahead
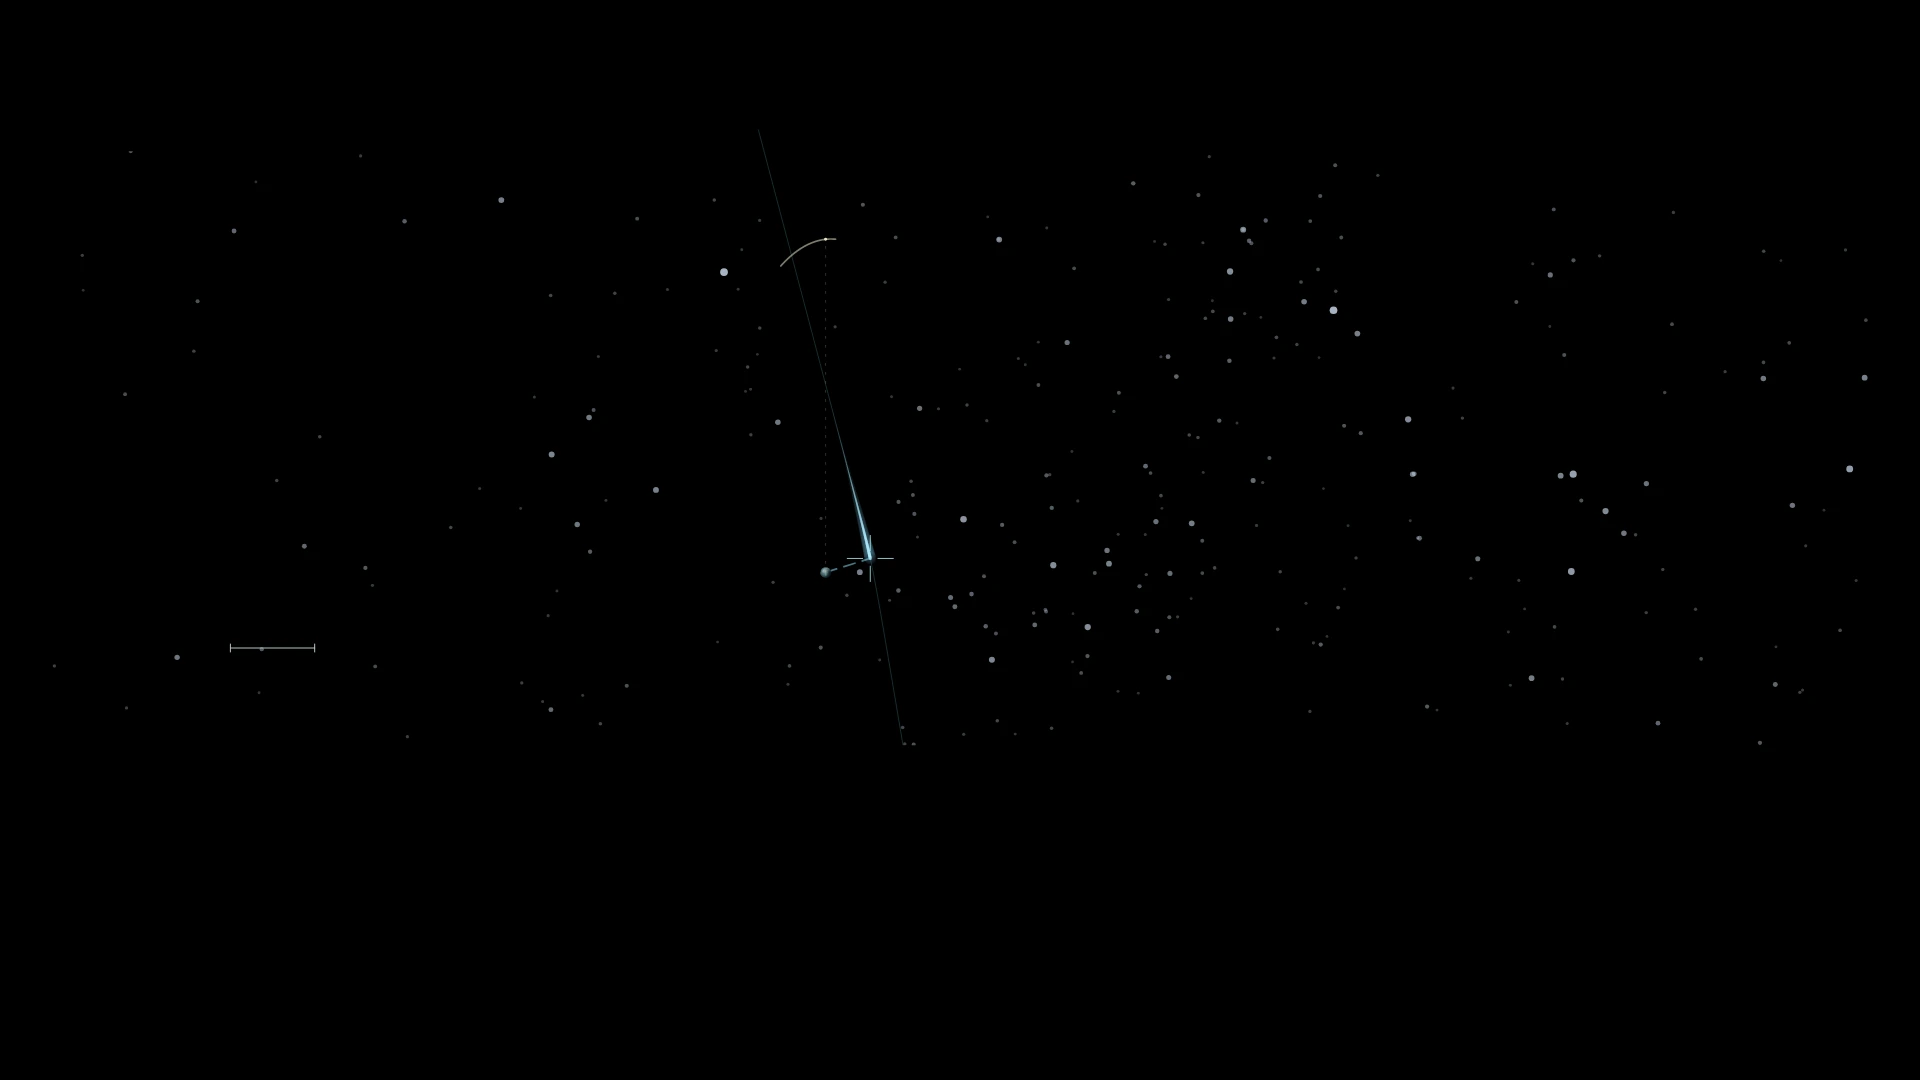
The TN77 scene uses positions calculated with JPL Horizons for Earth, the Moon and the asteroid. Watching before and after closest approach shows the gap narrowing and then opening. Time turns a single separation into the visible shape of a passage through Earth’s surroundings.JPL Horizons — ephemeris system
The accumulated observations also support predictions of future positions. NASA’s Sentry evaluates possible future impacts while accounting for uncertainty in an orbit. Discovery, measurement, calculation and follow-up form a connected process. Together they make recurring approaches something we can locate and investigate.
NASA CNEOS — Sentry introduction · NASA/JPL — Studying and tracking asteroids
A small body’s path within the Earth–Moon space
The Blue Marble photograph taken by Apollo 17 on 7 December 1972 brings oceans, continents and clouds together on one globe. Widen that view and the Moon lies roughly 384,000 km away, within a space also crossed by much smaller bodies. TN77 passed at about one-seventh of that lunar distance.NASA — The Blue Marble · NASA — Moon / Earth mean radius · ESA NEOCC — computer access
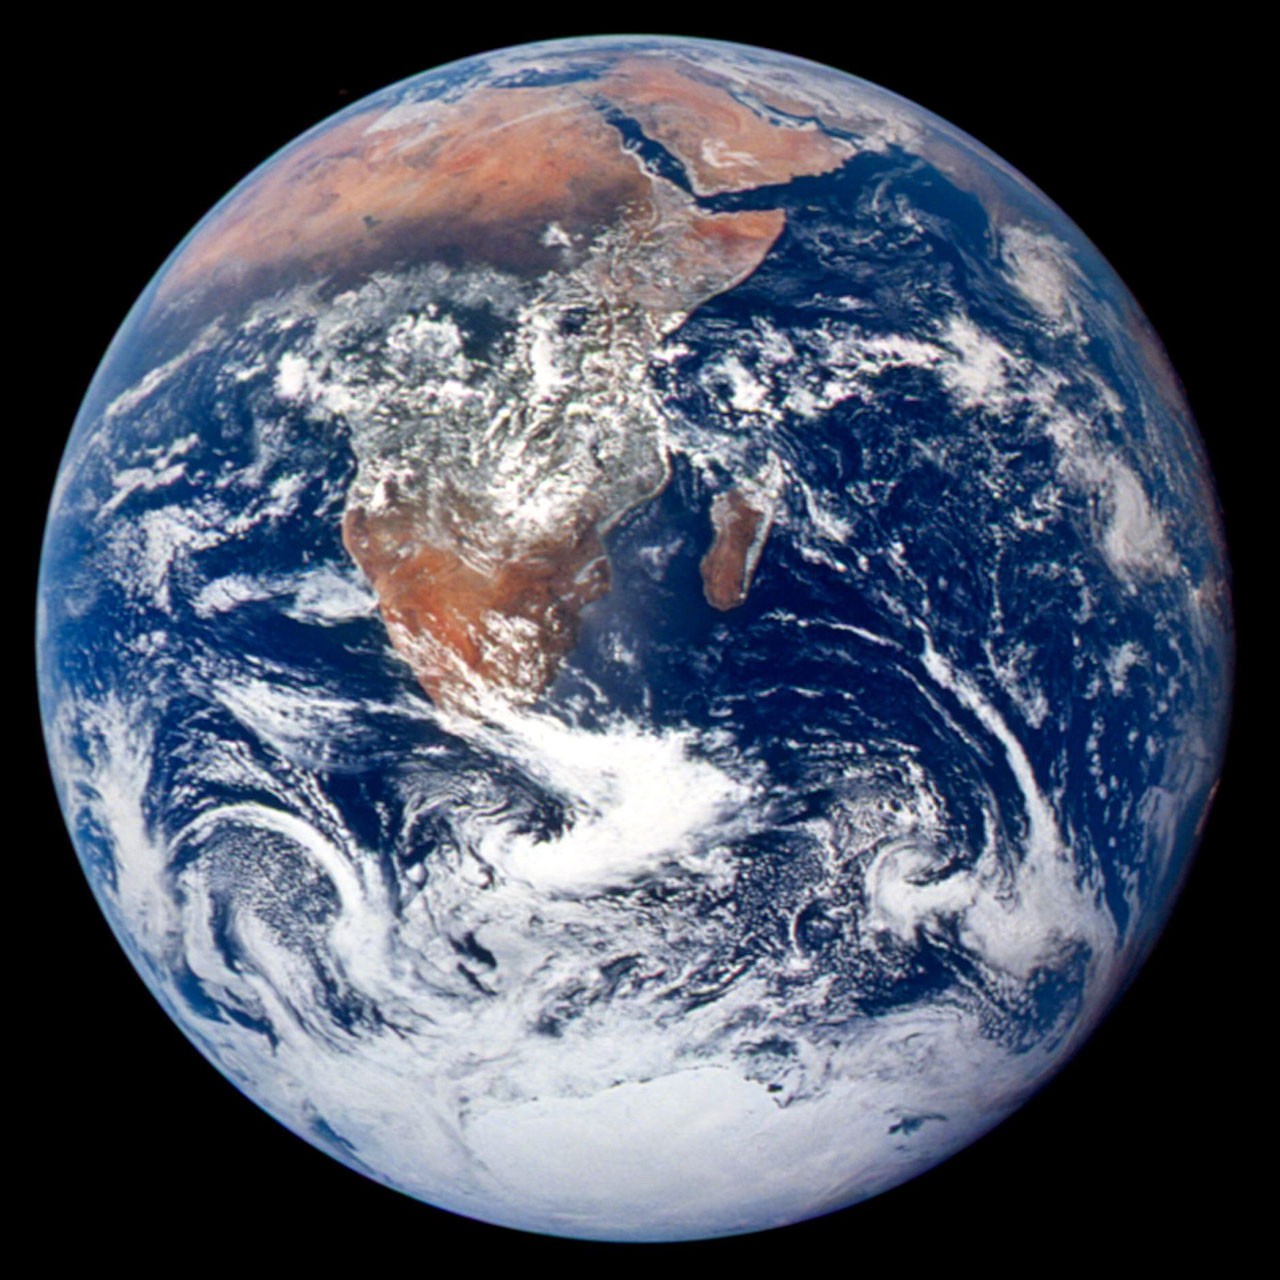
The Blue Marble, photographed from Apollo 17 on 7 December 1972. Supplied image used unchanged. NASA / Apollo 17 · NASA media usage guidelines · Source
Asteroids repeatedly pass near Earth. Using the Moon as a reference makes their separation tangible; following time makes their movement legible. One recorded encounter shows both the space our planet shares with small bodies and the work of observation that brings their motion into view.
Data and representation
The several-dozen-per-year figure is NASA/JPL’s 2014 frequency estimate for 6–12 m bodies passing closer than the Moon, rather than a 2026 observed tally. The sources reviewed do not establish cumulative flyby counts since Earth formed or Homo sapiens appeared; no deep-time totals have been extrapolated from that rate. The approximately 300,000-year human timespan refers specifically to Homo sapiens. Lunar crater research records impacts, a distinct quantity from close approaches. 289 JPL Horizons geometric positions at ten-minute intervals, 11 October 00:00–13 October 00:00 UTC 2026, Earth-centred J2000 ecliptic coordinates. Orbit-model calculations from observations. The nearest sample is 12 October 15:20 UTC, about 55,500 km geocentric; sample timing and orbital solution may differ from ESA’s approximately 55,400 km. The film compresses 13:20–17:20 UTC on 12 October into 20 seconds. Fixed orthographic framing, common body-size and distance scale, and a 100,000 km scale bar. Projection foreshortens depth; the actual geocentric distance is also given numerically. Earth uses abstract Natural Earth outlines. Shading and catalogue stars do not reconstruct the observed sky. The dashed connector measures separation; the crosshair locates the body without indicating its diameter. Positions are linearly interpolated between samples; the preceding six hours form a visual trail, not ejecta. Not a live location or impact-risk forecast. Article checked 21 October 2026.- JPL Horizons — ephemeris system
- JPL Horizons API specification
- ESA NEOCC — computer access
- NASA — Moon / Earth mean radius
- ESA — TN77 estimated diameter
- d3-celestial — XHIP stars (BSD-3-Clause)
- NASA — The Blue Marble
- NASA/JPL — Studying and tracking asteroids
- NASA CNEOS — Sentry introduction
- USGS — Geologic time and Earth’s age
- Smithsonian — Homo sapiens
- NASA/JPL — Close-pass frequency estimate (14 February 2014)
- NASA — Lunar craters and impact history (17 January 2019)
- NASA — Asteroid facts
JPL Horizons geometric positions; ESA catalogue values cited for comparison. Natural Earth: public domain. Star catalogue: d3-celestial / Olaf Frohn, BSD-3-Clause; XHIP. Derived visualization by SORAH.
Author
SORAH Editorial
October 21, 2026