Published on 21/October/2026 · Society
Lives across borders — a map of global connections
By SORAH Editorial
Not a journey in progress, but a record of where people live.
A relationship at each end of a line
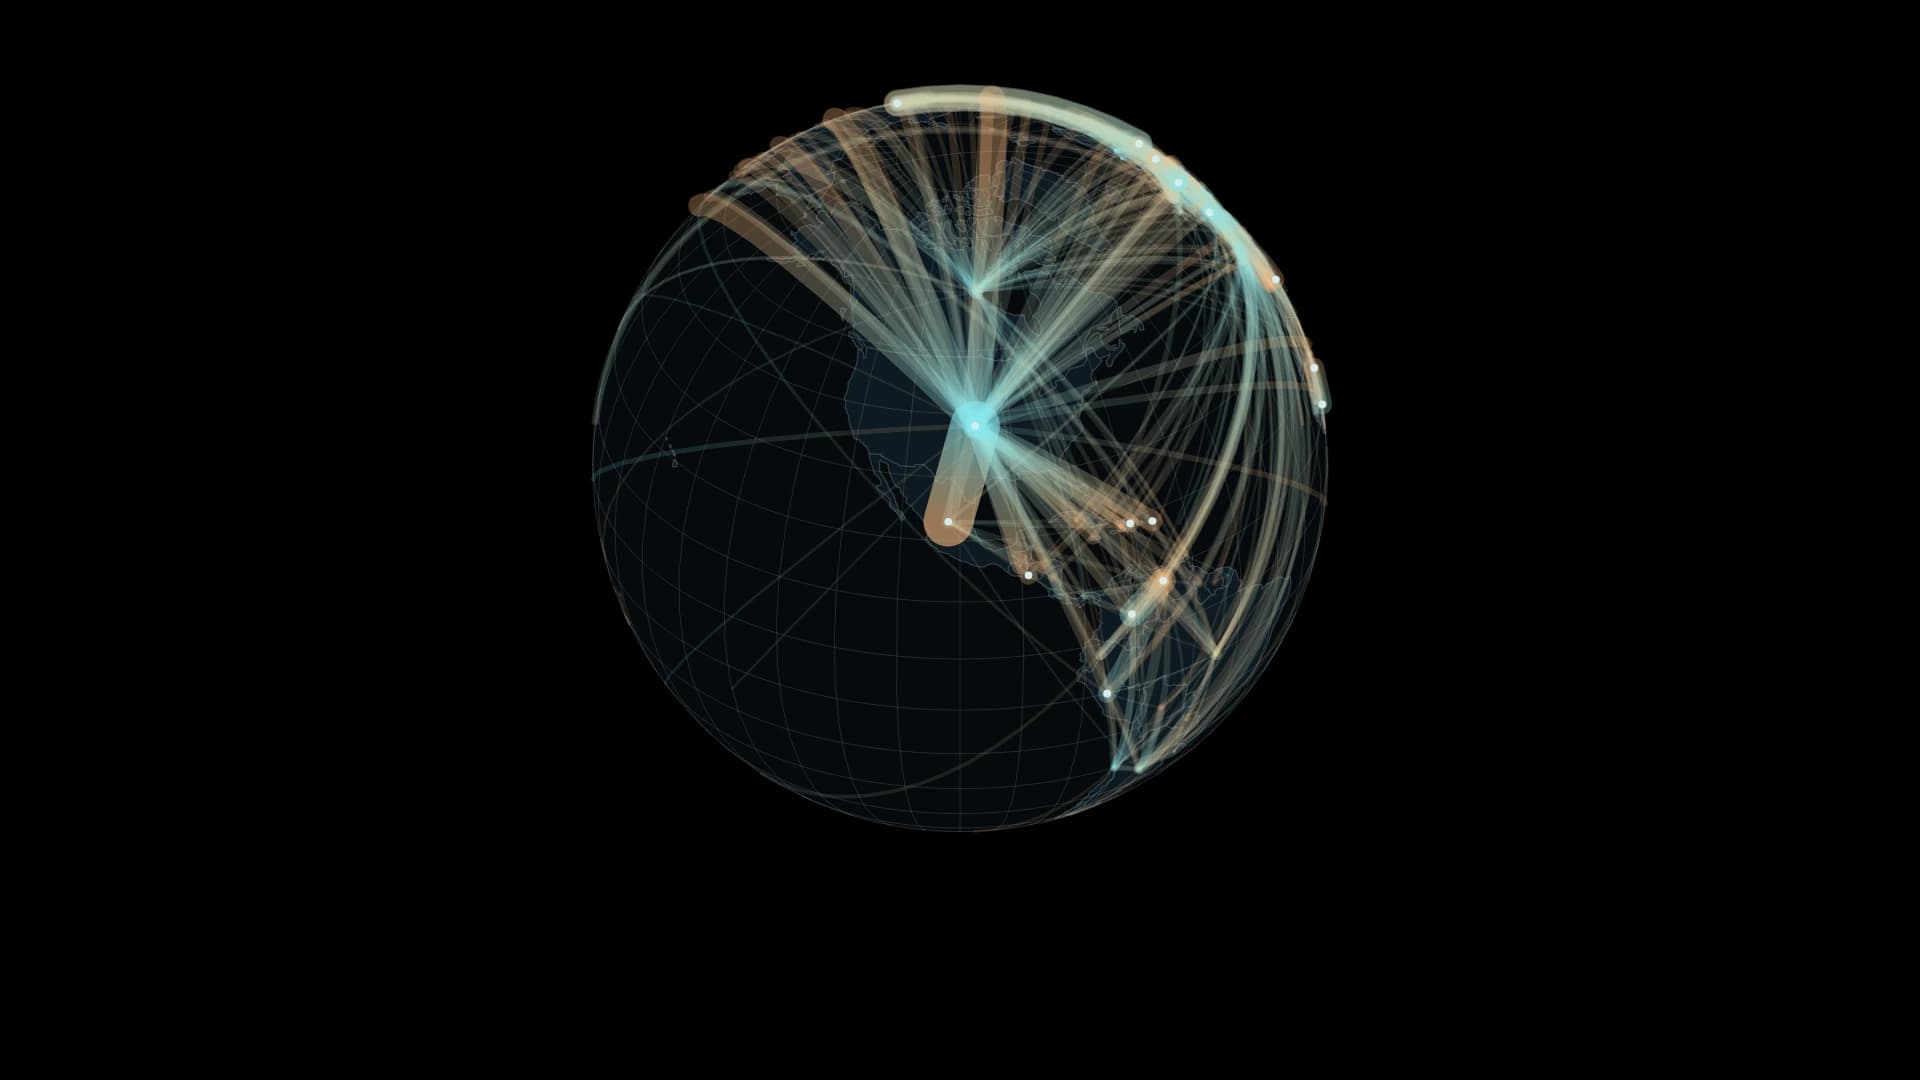
The UN estimates 304.0 million international migrants in 2024. These arcs connect origin and residence. They are not observed travel routes. Choose a country or area to explore incoming and outgoing relationships across eight reference years from 1990 to 2024.The initial view retains the largest pairs until they represent 95% of the recorded pair total. The all-pairs view includes every positive reported pair for the selected year. Width uses a square-root population scale with a minimum visible width, fixed across years and country selections; amber marks origin and cyan marks residence.
What the network does not contain
In 2024, 9,042 pairs have positive values. The extracted bilateral sum is 282.0 million, or 92.7% of the global total. Unlisted combinations are not assumed to be zero. The series largely measures foreign-born populations, with citizenship-based data and estimates where indicated. Differences between reference years are not annual migration flows.A growing stock is not a count of arrivals
The global estimate rose from about 153.9 million in 1990 to 304.0 million in 2024. The difference is approximately 150.1 million. It is not the number of people who crossed a border over those thirty-four years. A stock includes people already living abroad; return migration, onward migration, deaths and statistical revisions can also affect the difference between dates.Each connection contains people with different reasons for moving and different lengths of residence. A thicker line indicates a larger recorded population in that relationship. It says little by itself about how those people experienced the move or the place where they now live.
A place of arrival becomes a place of memory
Ellis Island in New York offers a specific historical setting. According to the National Park Service, approximately twelve million passengers entering through New York underwent legal and medical inspection there between 1892 and 1954. After restoration, the main building reopened as an immigration museum in 1990.A photograph of the buildings gives arrival a physical setting: a place for procedures before the longer process of settling elsewhere. The modern world map records reference-year residence, rather than those individual arrival scenes. Holding both in view distinguishes an event of migration from a life that continues after it.
Read both ends of the connection
From an origin, a link points towards people living abroad. From a destination, it forms part of the population living in that place. One country can participate in both kinds of relationship. The map invites a change of viewpoint without classifying places permanently as either senders or receivers.It cannot measure remittances, family contact or the quality of a person’s life. Population provides one setting for those relationships; other records and lived experience are needed to understand what happens within them.
Leave room for what is not mapped
The mapped bilateral total in 2024 is about 282.0 million, compared with the global estimate of 304.0 million. Assigning that gap to invented origins would make the picture denser while adding relationships the source does not identify.Preserving unknowns matters as much as keeping small positive relationships visible. The lines are useful precisely when we remember what they measure, and return our attention to the places and people at their ends.

Buildings on Ellis Island, New York. Exact date unknown; the source dates the content to 1980–1999. Unmodified. NPS staff / National Park Service · Public domain · Source
Data / Method
UN DESA International Migrant Stock 2024, Table 1, both sexes. Country/area codes below 900; same-code pairs excluded. Great-circle relationships use representative locations. Data types: B birthplace, C citizenship, R refugee-related addition, I imputed. At 1080px width, line width is max(0.7, 26.25×sqrt(population/10 million)) px for positive values; zero is not drawn. Legend uses the same scale. Label candidates are the top 12 countries/areas by the sum of incident origin and residence stocks, using all positive pairs matching the current year/country/direction before the 95% display filter. This ranking is not a deduplicated global population total. Back-facing or colliding labels are omitted. The film fixes the dataset at its latest recorded year, 2024, and rotates once in 20 seconds from North America. Worldwide pairs are retained. Moving highlights on the 240 largest displayed relationships run from origin to residence. They illustrate direction, not measured journeys, timing or speed; population and line widths remain fixed. The interactive view retains all eight recorded years.- UN DESA — International Migrant Stock 2024
- UN DESA — destination and origin workbook
- Country coordinates — mledoze/countries
- NPS — Ellis Island buildings and history
- United Nations — Migration
UN DESA International Migrant Stock 2024 · CC BY 3.0 IGO. Derived bilateral extraction and visualization by SORAH; no UN endorsement implied. Geographic node mapping from mledoze/countries is adapted under ODbL 1.0; UN statistics retain their separate license. Natural Earth: public domain.
Author
SORAH Editorial
October 21, 2026