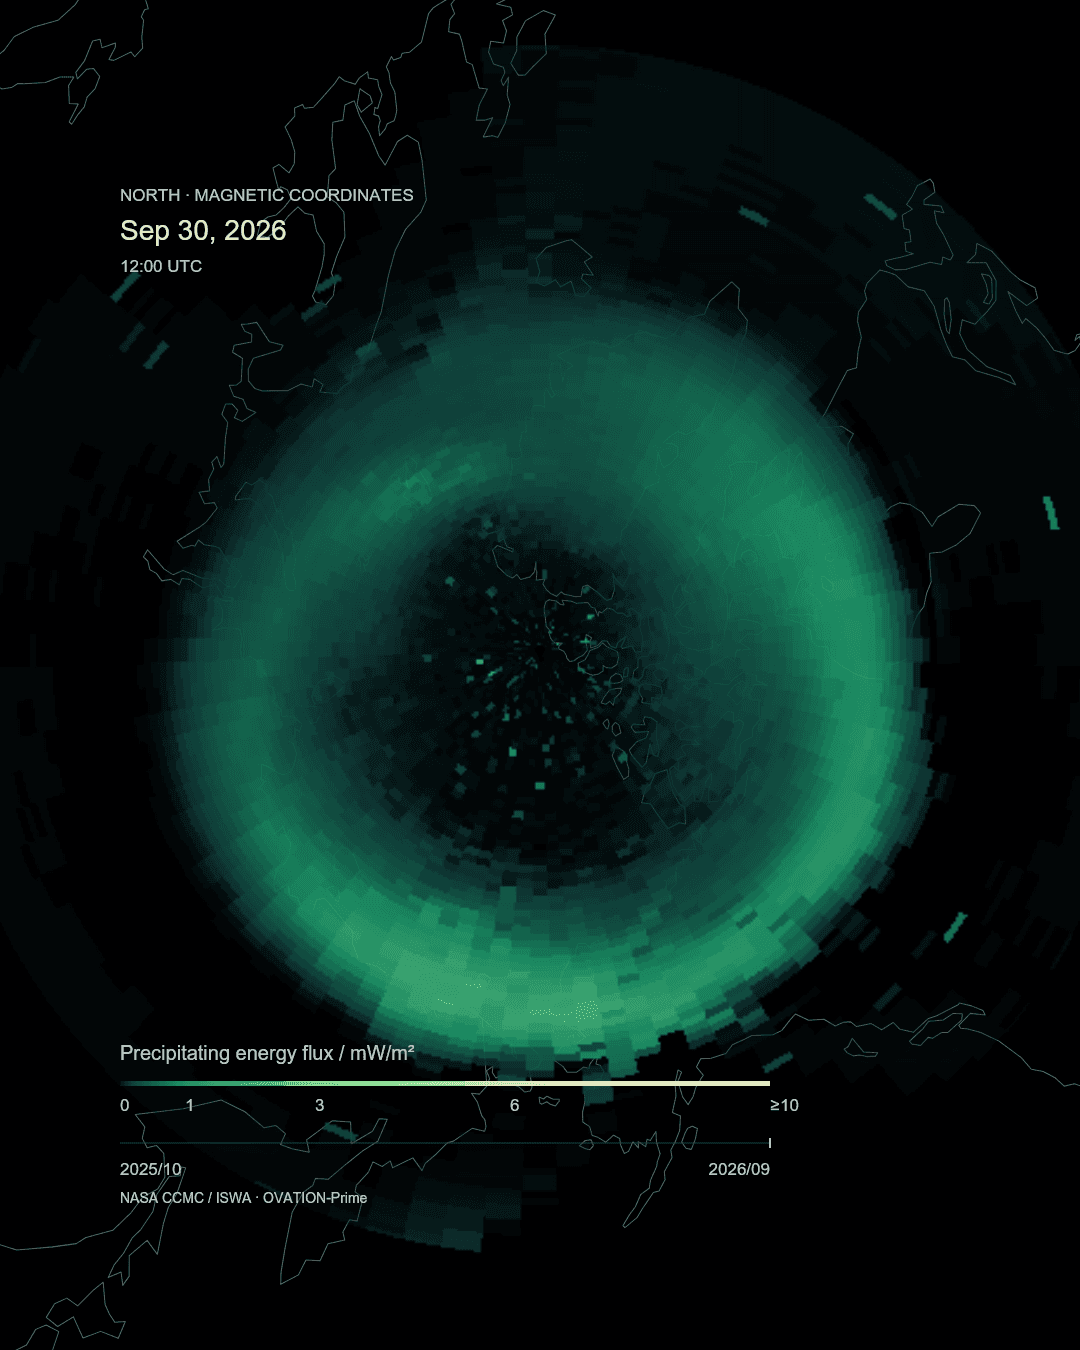
From October 2025 to September 2026, fixed-time model snapshots and geomagnetic observations trace a year of change above the northern sky.
One year around the auroral oval
Waiting for the northern lights means watching one patch of sky. A year of polar views reveals another scale: a band whose strength and shape change from day to day. From October 2025 through September 2026, this sequence compares the same instant each day, 12:00 UTC, to follow energy arriving in the upper atmosphere.The main view uses archived OVATION Prime output from NASA’s Community Coordinated Modeling Center. The model estimates the energy carried by electrons and ions into high-latitude regions under changing solar-wind conditions. A fixed scale lets quieter and more active days remain comparable throughout the year. NASA CCMC — OVATION Prime model

Aurora above Denali, Alaska. Capture date not supplied. NPS / Kent Miller · Source · Public domain — NPS Unmodified image.
How particle energy becomes light
Particles guided by Earth’s magnetic field transfer energy to the upper atmosphere. Oxygen and nitrogen then release light. The magnetic field helps concentrate this activity into a band around each magnetic pole. NOAA SWPC — AuroraThe model draws on particle measurements from the polar-orbiting DMSP satellites. CCMC describes a statistical foundation built from 11 years of observations, organised by magnetic latitude, magnetic local time and solar-wind conditions. A night watched from the ground and measurements collected from orbit capture different scales of the same phenomenon. NASA CCMC — OVATION Prime model
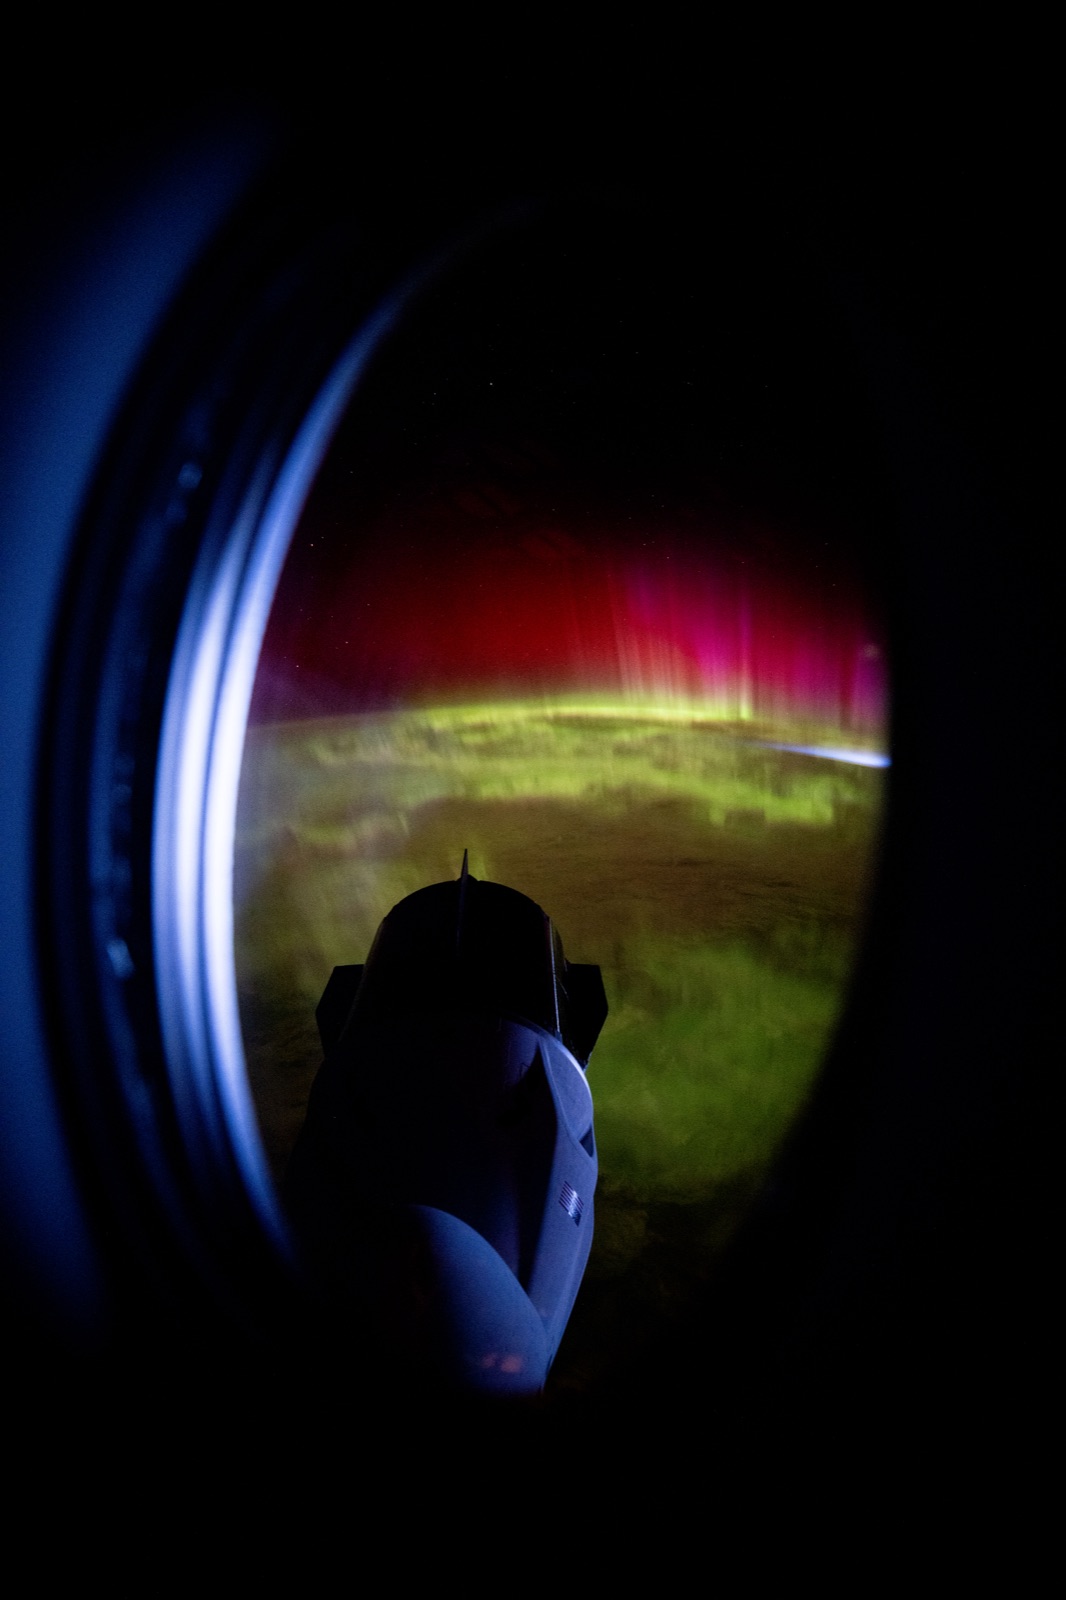
Aurora and a Dragon spacecraft seen from the International Space Station above the Indian Ocean, October 7, 2024. NASA / Matthew Dominick · Source · NASA Images and Media Usage Guidelines — editorial use Proportional resize and JPEG compression only.
Stronger activity in November 2025 and January 2026
A separate chart follows GFZ’s Kp index over the same year. Across 2,920 three-hour intervals, the highest retrieved value was 8.667. It occurred in the intervals beginning at 00:00 and 03:00 UTC on 12 November 2025, and at 21:00 UTC on 19 January 2026.Of the 365 days, 56 included at least one interval with Kp of 5 or higher. Periods of stronger activity recurred between quieter stretches. The main view describes the modelled location and amount of particle energy; Kp adds measurements of magnetic disturbance at the ground. Together they offer two distinct perspectives on a changing year. GFZ — Kp data
From observatories to everyday infrastructure
Julius Bartels developed Kp in 1949. Today it uses records from 13 observatories, including Niemegk in Germany, Ottawa in Canada and Sitka in Alaska. Measurements made in different places are brought into a common index of planetary geomagnetic activity. GFZ — About KpChanges in the space environment also matter to electricity networks, spacecraft and navigation. NOAA’s space-weather scales describe possible effects at successive levels of geomagnetic storms. Following the light in the sky brings us closer to the observations used by people watching over infrastructure on Earth and in orbit. NOAA SWPC — Space Weather Scales
Returning to the next night
For someone in Alaska, Canada or northern Europe, seeing the aurora also depends on darkness and clouds. After exploring a year of modelled activity, attention returns to a current forecast and the local sky. The annual pattern supplies context; the experience still happens in one place, on one night. NOAA SWPC — AuroraData and representation
Main view: NASA GSFC CCMC / ISWA OVATION Prime “e+i, all” archive. Of 365 dates from 1 October 2025 through 30 September 2026, 340 have an output exactly at 12:00 UTC. The film sequences the 340 available dates and omits the other 25. Date labels retain each output’s actual date. Each frame is a fixed-time model output, not a daily mean. Files identify output UTC but do not specify input solar-wind observation times or propagation lead.The grid contains 7,680 points: magnetic latitude 50–89.5° at 0.5° spacing, and magnetic local time (MLT) 0–23.75 h at 0.25 h spacing. MLT 12 is at the top, 0 at the bottom, 6 on the right and 18 on the left. The base map uses Natural Earth 1:110m land. Geographic coastlines are converted with AACGM-v2 2.7.1 at 0 km altitude to magnetic coordinates and then to MLT for each date at 12:00 UTC. Unfilled coastlines extend across the frame and share the projection and scale of the enlarged central flux layer. The energy-flux data retain their original coverage north of 50° magnetic latitude. Borders and place names are omitted; the base map provides geographic context.
Values are total precipitating electron-plus-ion energy flux across auroral types. The original erg/(cm² s) is numerically equivalent to the displayed mW/m². A common 0–10 scale is used throughout, with its upper endpoint labelled “≥10 mW/m²”. There are 287 cells above 10 among 2,611,200 valid cells, about 0.011%. Raw values are retained up to 14.47. The particles encode this model quantity; optical brightness and visible-aurora probability are separate quantities.
The film lasts 20 seconds. Short cross-fades connect the available dates. These are editorial transitions, with no reconstructed subdaily data.
Kp: GFZ Helmholtz Centre for Geosciences, CC BY 4.0. The same year has 2,920 three-hour values, no missing intervals, all marked def (definitive) in the retrieved response. Times mark interval starts in UTC. Maxima and the 56-day / 123-interval count for Kp≥5 were calculated from the saved response. Kp supplies a separate chart and is not used to generate the model grid.
The supplementary NOAA forecast targets 14 October 2026 at 13:53 UTC, using observations timestamped 12:58 UTC. It is an independent product with different coordinates and value definitions from the annual energy-flux series.
Acknowledgements: simulation output was provided through the public services of NASA GSFC CCMC. OVATION Prime was developed by Patrick Newell and colleagues at Johns Hopkins APL. CCMC describes near-real-time ISWA output as prototyping quality for research. For Kp, see Matzka et al. (2021), doi:10.1029/2020SW002641.
Sources
- NASA CCMC — OVATION Prime model
- NASA CCMC — ISWA numerical archive
- GFZ — Kp data
- GFZ — About Kp
- NOAA SWPC — Aurora
- NOAA SWPC — Space Weather Scales
- NASA CCMC — ISWA and publication policy
- NOAA SWPC — Aurora, 30-minute forecast
- Natural Earth — 1:110m land (public domain)
- AACGM-v2 — magnetic coordinate conversion
Author
SORAH Editorial
October 15, 2026