Published on 12/October/2026 · Environment
Where is the water we depend on under pressure?
By SORAH Editorial
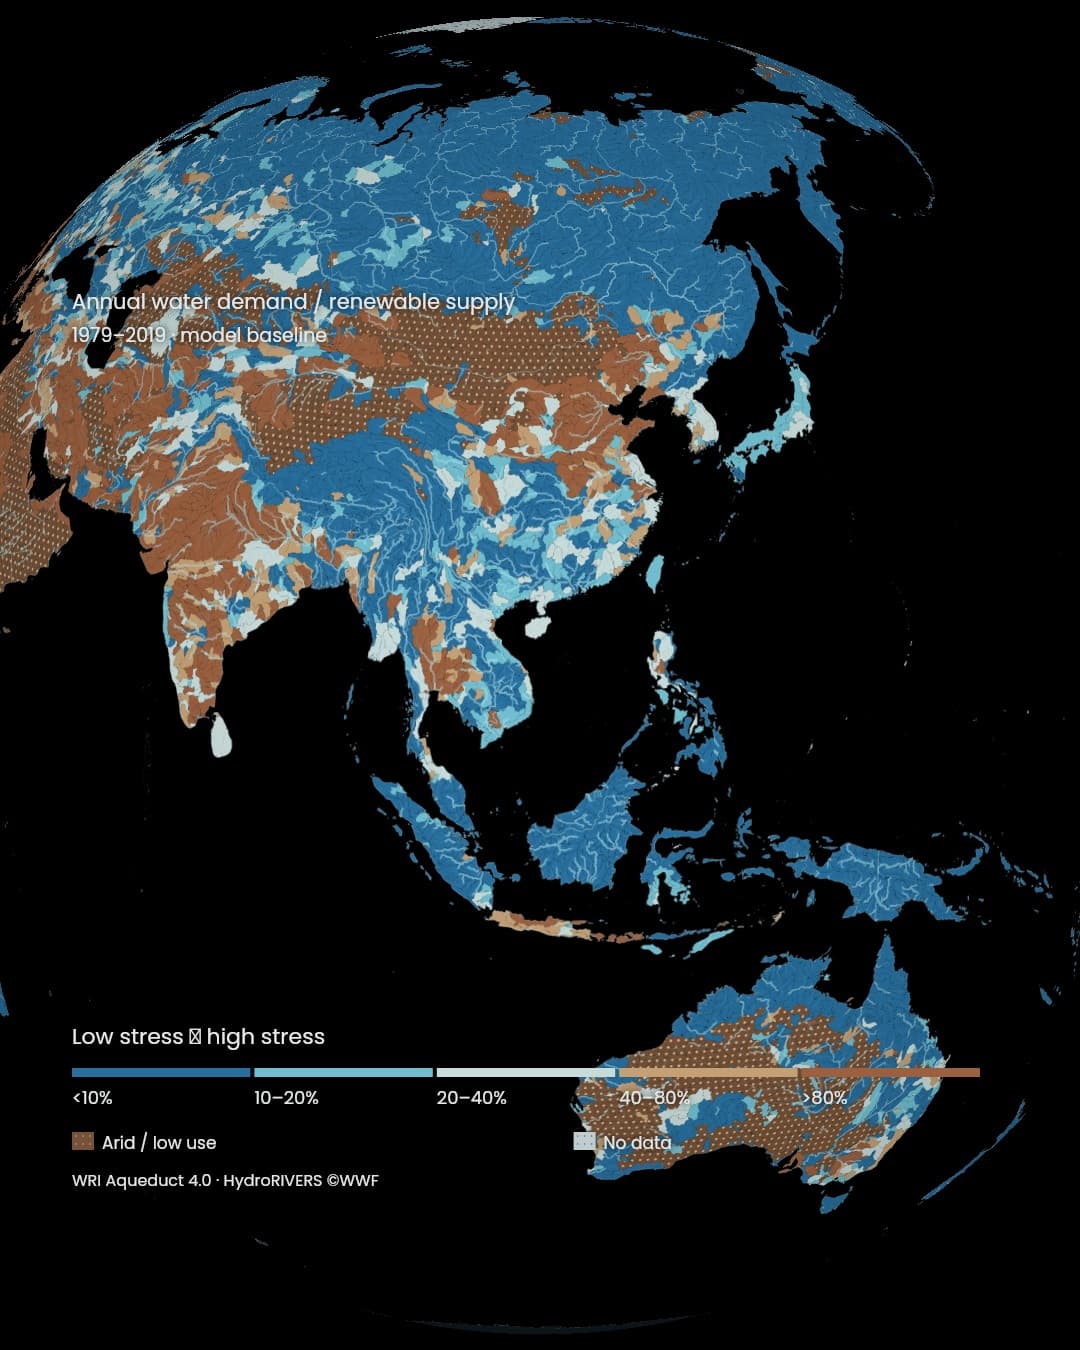
How closely does water demand approach renewable supply? Explore 16,395 basins worldwide, then zoom into mainstems and tributaries.
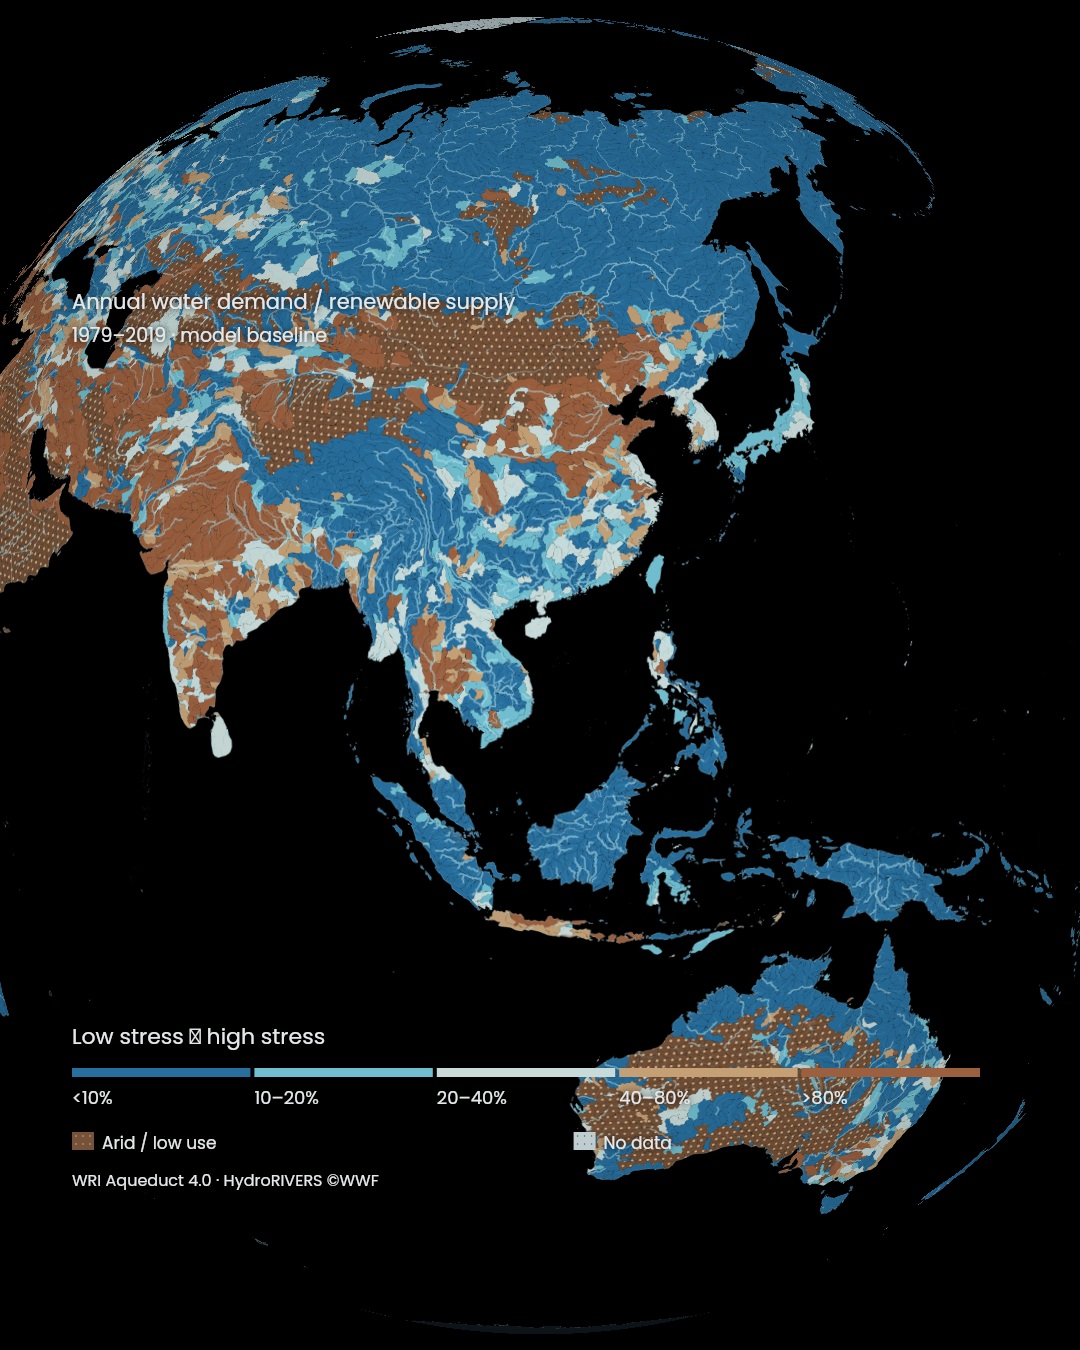
How closely does water demand approach renewable supply? Explore 16,395 basins worldwide, then zoom into mainstems and tributaries.
Follow water beyond the border
Behind a tap are hills and plains that collect rain, water stored underground, and farms and factories drawing on the same resource. A drainage-basin view connects the places where people live with the landscapes that supply their water.Supply is only one side of the relationship
The main map shows baseline water stress across 16,395 basins. It compares demand from domestic, agricultural, industrial and other uses with available renewable surface and groundwater supply. It concerns pressure relative to supply, rather than the absolute amount of water alone. Aqueduct 4.0 methodsWhere supply is unchanged, greater demand leaves less room between what is available and what people seek to use. In dry regions, looking at water use alongside supply helps distinguish the pressures created by demand from the conditions created by aridity.
The differences hidden within a country
Mainstems and tributaries reveal a geography that rarely matches political boundaries. Upstream and downstream areas, and valleys separated by hills, can belong to different water systems within one country. Understanding a place’s water means looking beyond the place itself.Aqueduct uses HydroBASINS to provide a consistent global framework. Subdividing larger basins makes it possible to examine variation below the national average. WRI technical FAQ
The colours identify places for closer examination. Local observations, urban supply systems and irrigation practices can then reveal where water is needed within a basin, and when demand is greatest.
Water reaches people through work
Water demand extends beyond a glass at the table. Irrigation equipment and manufacturing also require water. Reading the map with farms and settlements in mind makes the shared resource more tangible: different activities depend on the same basin.The accompanying photograph records irrigation in Utah, United States, in 2007. It connects the geography of rivers and groundwater with the equipment and work that deliver water to crops.
An annual indicator also smooths out seasonal differences. Demand may peak when rain is scarce. A particular drought or a damaged supply system introduces further conditions to investigate separately.
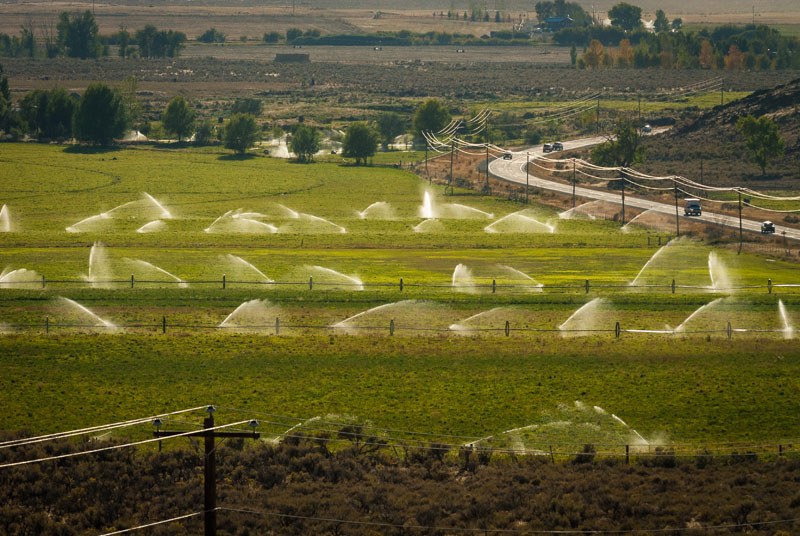
Crop irrigation in Utah, United States. Photographed on 21 September 2007.
Resource pressure and drinking-water access
Safe, reliable water at home depends on distance to a source, infrastructure and water quality. Considering basin resources alongside household services brings the natural supply and the systems that deliver it into the same picture.The separate WHO/UNICEF JMP access views show people using at least basic services: an improved source within a 30-minute round trip including collection and queuing. Safely managed services additionally require water on premises, available when needed and free from contamination. WHO/UNICEF JMP definitions
Keeping these questions separate makes the map more useful. Following a river toward everyday life means considering both natural supply and the systems through which people obtain water.
Data and representation
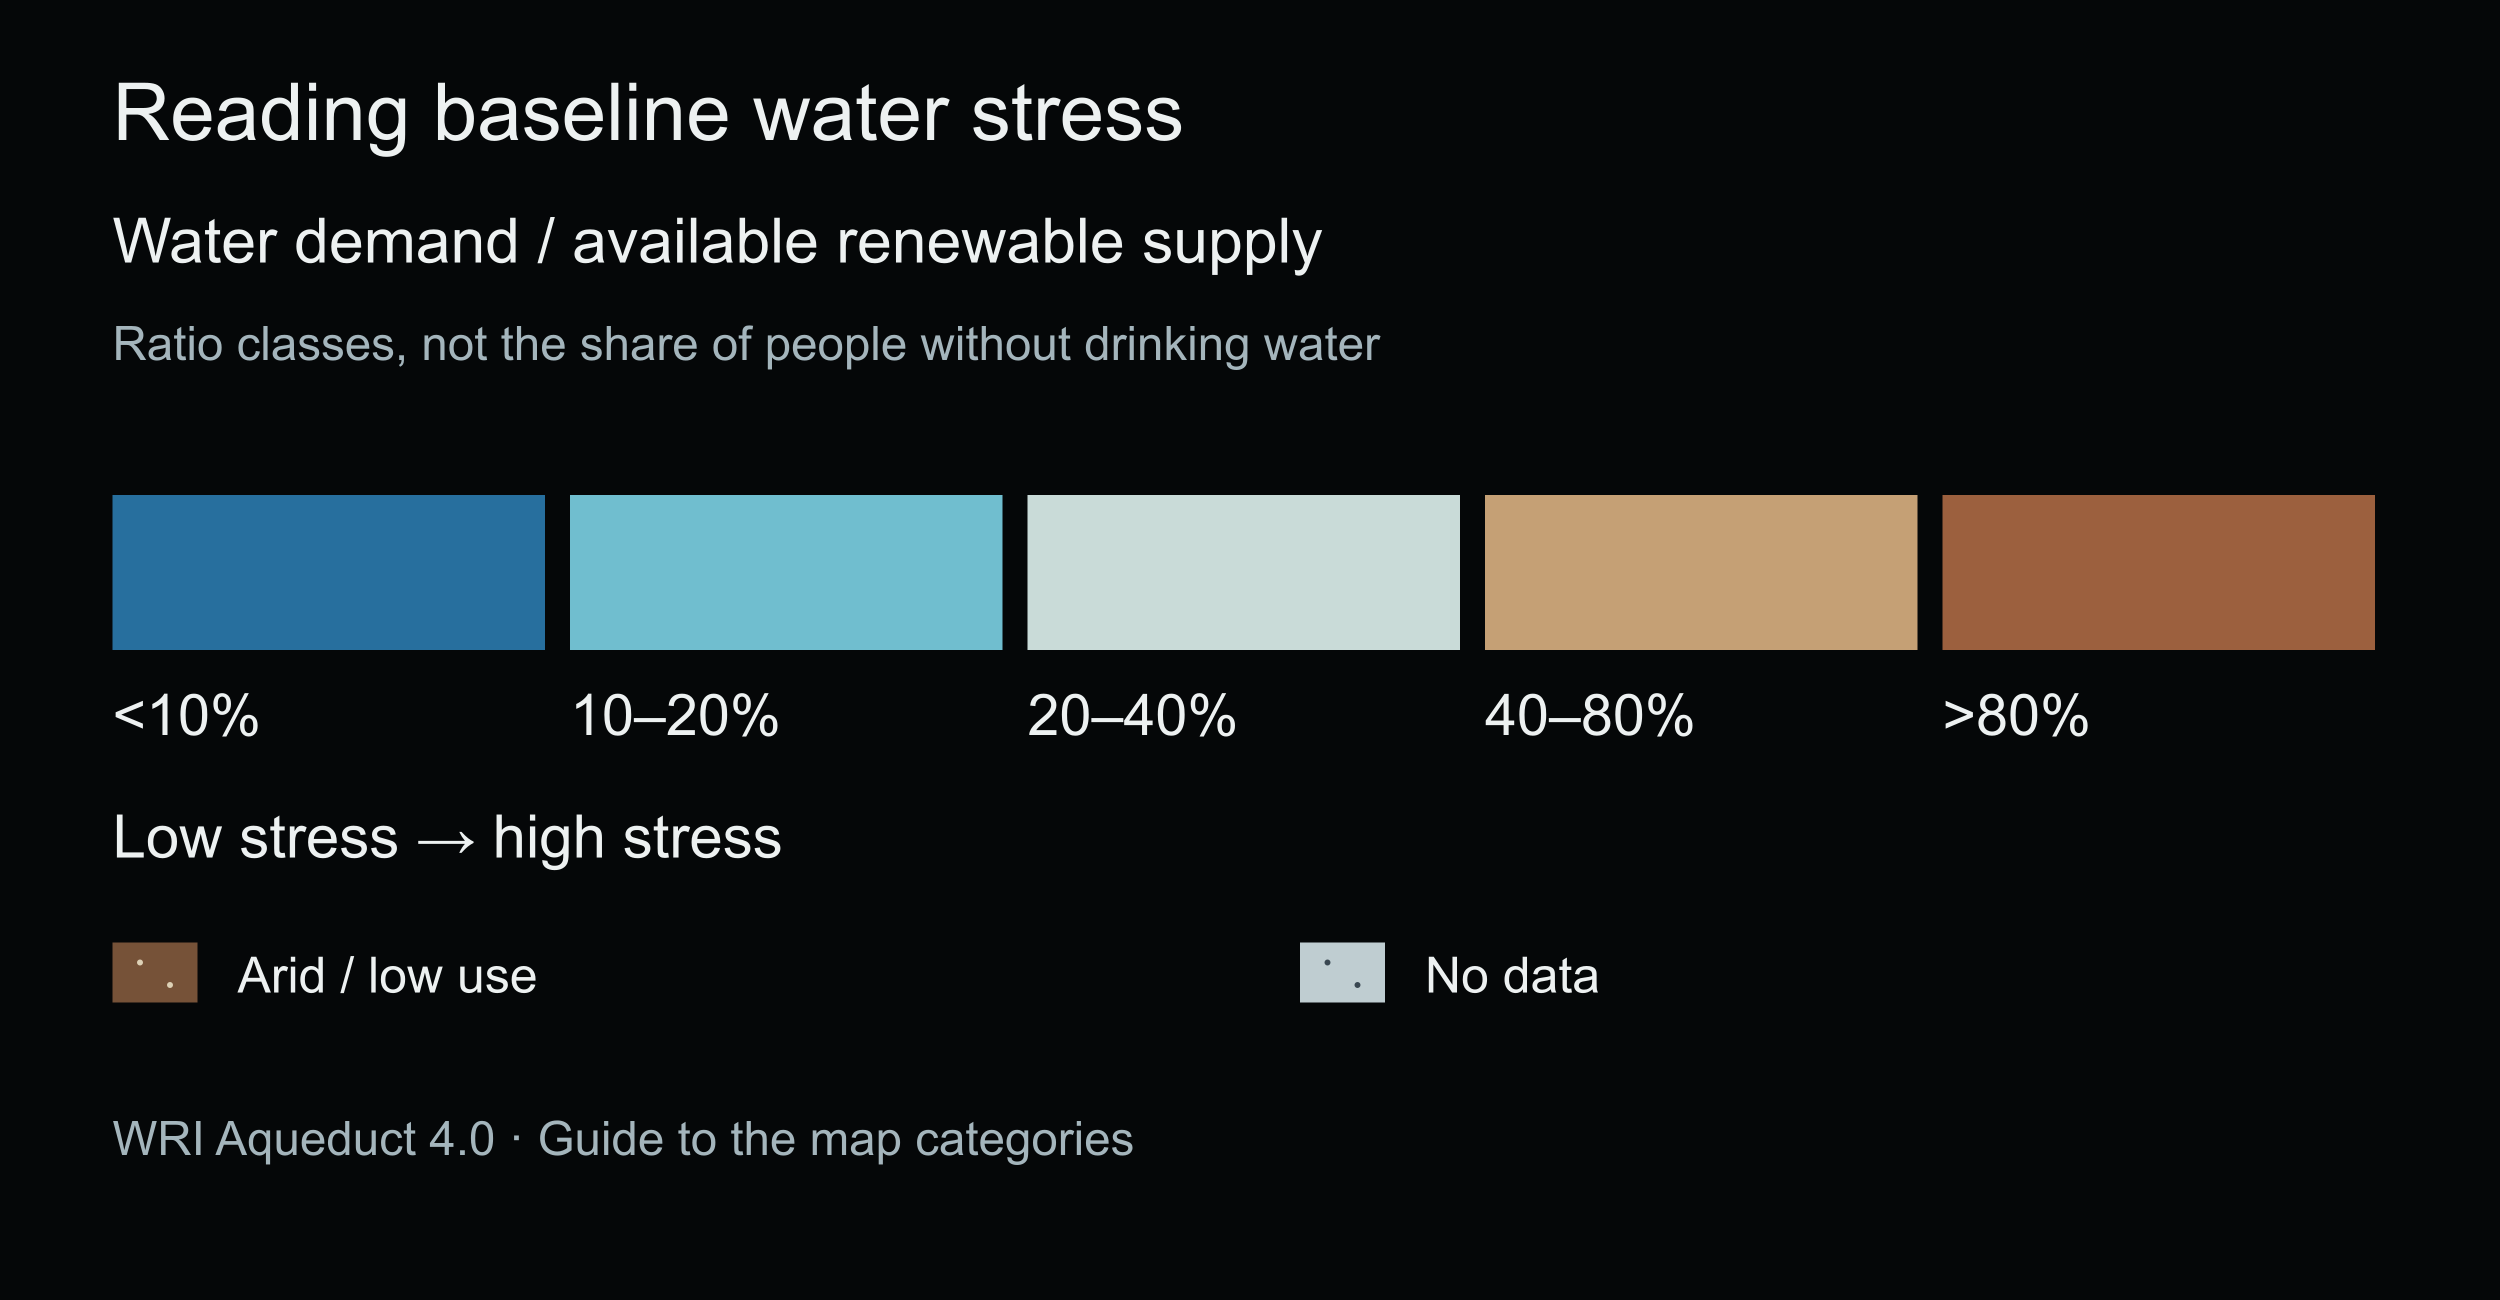
Main map: WRI Aqueduct 4.0 baseline water stress across 16,395 basins. Released in 2023, based on model series for 1979–2019. The indicator divides annual water demand by available renewable surface and groundwater supply; both numerator and denominator are water volumes.Five blue-to-brown classes: below 10%, 10–20%, 20–40%, 40–80%, above 80%. Light dots on brown mark arid / low use; dark dots on light grey mark no data. Dots are category patterns anchored in geographic coordinates and projected onto the globe. WRI CC BY 4.0; HydroBASINS/WWF.
Rivers: HydroRIVERS v1.0 / ©WWF. Global views use Strahler order 5+, regional views 3+. Lines encode simplified geographic positions. River and basin geometries are simplified separately, with small local differences at boundaries.
Alternative views A–C: WHO/UNICEF JMP, August 2025, wat_basal (at least basic drinking-water services). Percentage of people using an improved source within a 30-minute round trip including collection and queuing. This category includes safely managed services. Water quality and continuity of supply are additional conditions used to assess service levels.
JMP 2024 estimates cover 216 / 219 areas overall, 171 rural areas and 181 urban areas. Total estimates for Argentina, Nicaragua and the Falkland Islands remain missing and grey. Values are estimates based on surveys and other evidence.
Natural Earth supplies the basemap; small areas outside the geometry join remain available in selections and values. UNICEF’s indicator policy specifies CC BY 3.0 IGO. Exact workbook-specific reuse terms remain a pre-distribution check.
Crop irrigation in Utah, United States. Photographed on 21 September 2007. Danny Hart / USEPA · Public domain — US federal EPA work · Source. Proportional resizing and JPEG compression only.
Sources
Author
SORAH Editorial
October 12, 2026