Citizen observations from 2011–2022 revealed a change in star visibility equivalent to average annual sky brightening of 9.6%. Light created in a city can spread into the sky far beyond it.
Citizen observations from 2011–2022 revealed a change in star visibility equivalent to average annual sky brightening of 9.6%. Light created in a city can spread into the sky far beyond it.
The study analysed naked-eye reports contributed to Globe at Night. Its result does not mean every place on Earth brightened at that rate. Observations of familiar skies revealed changes that satellite images alone cannot fully describe. [4]
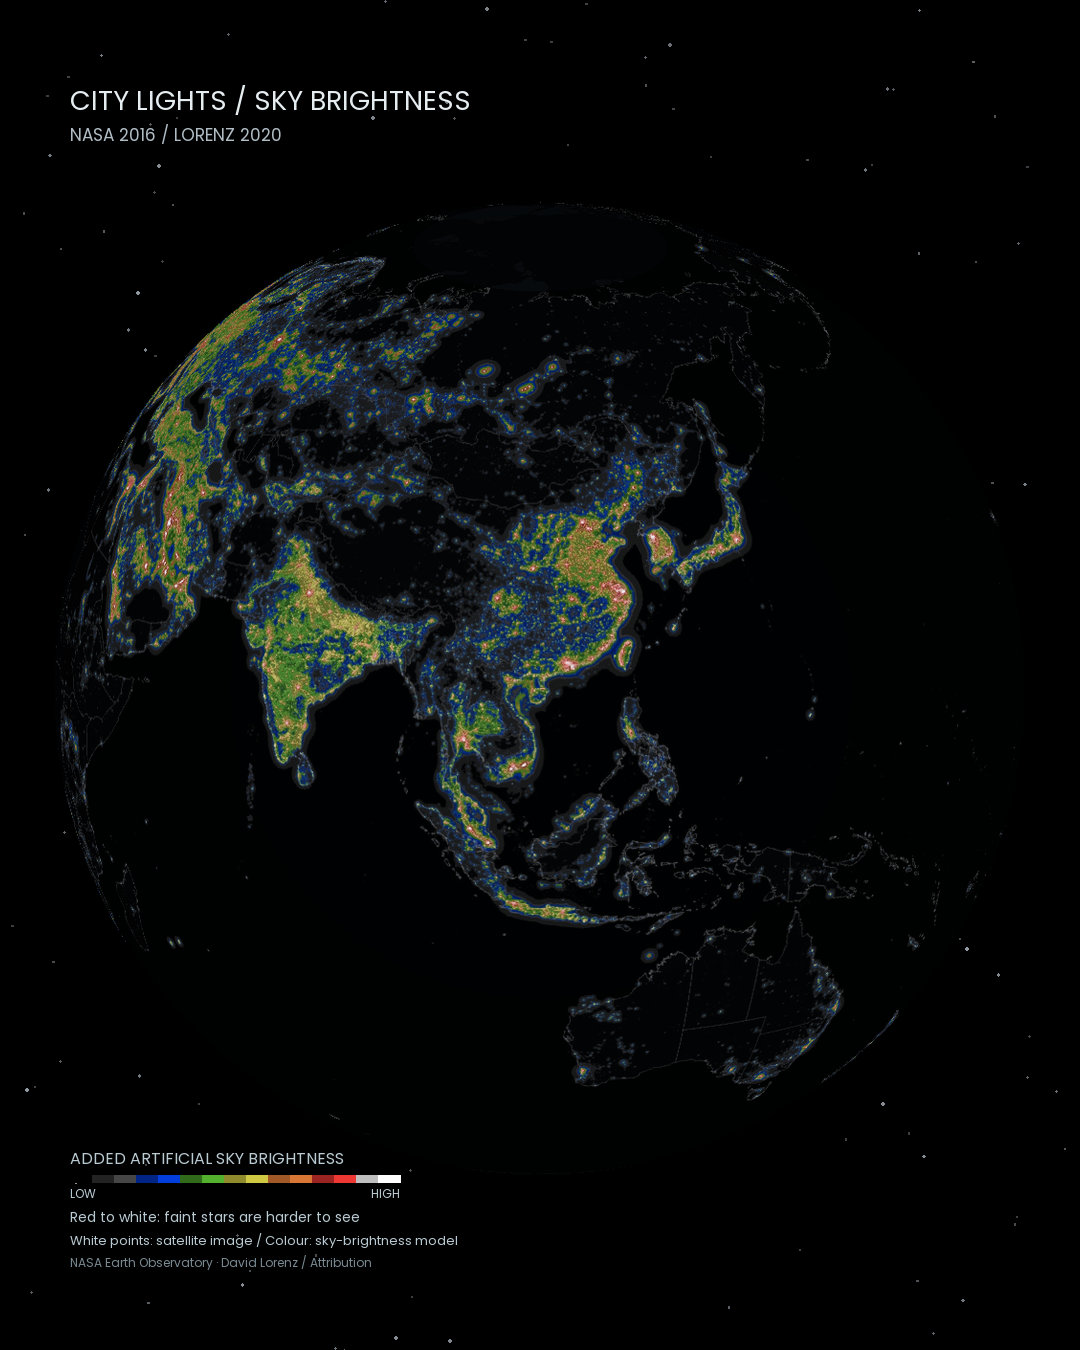
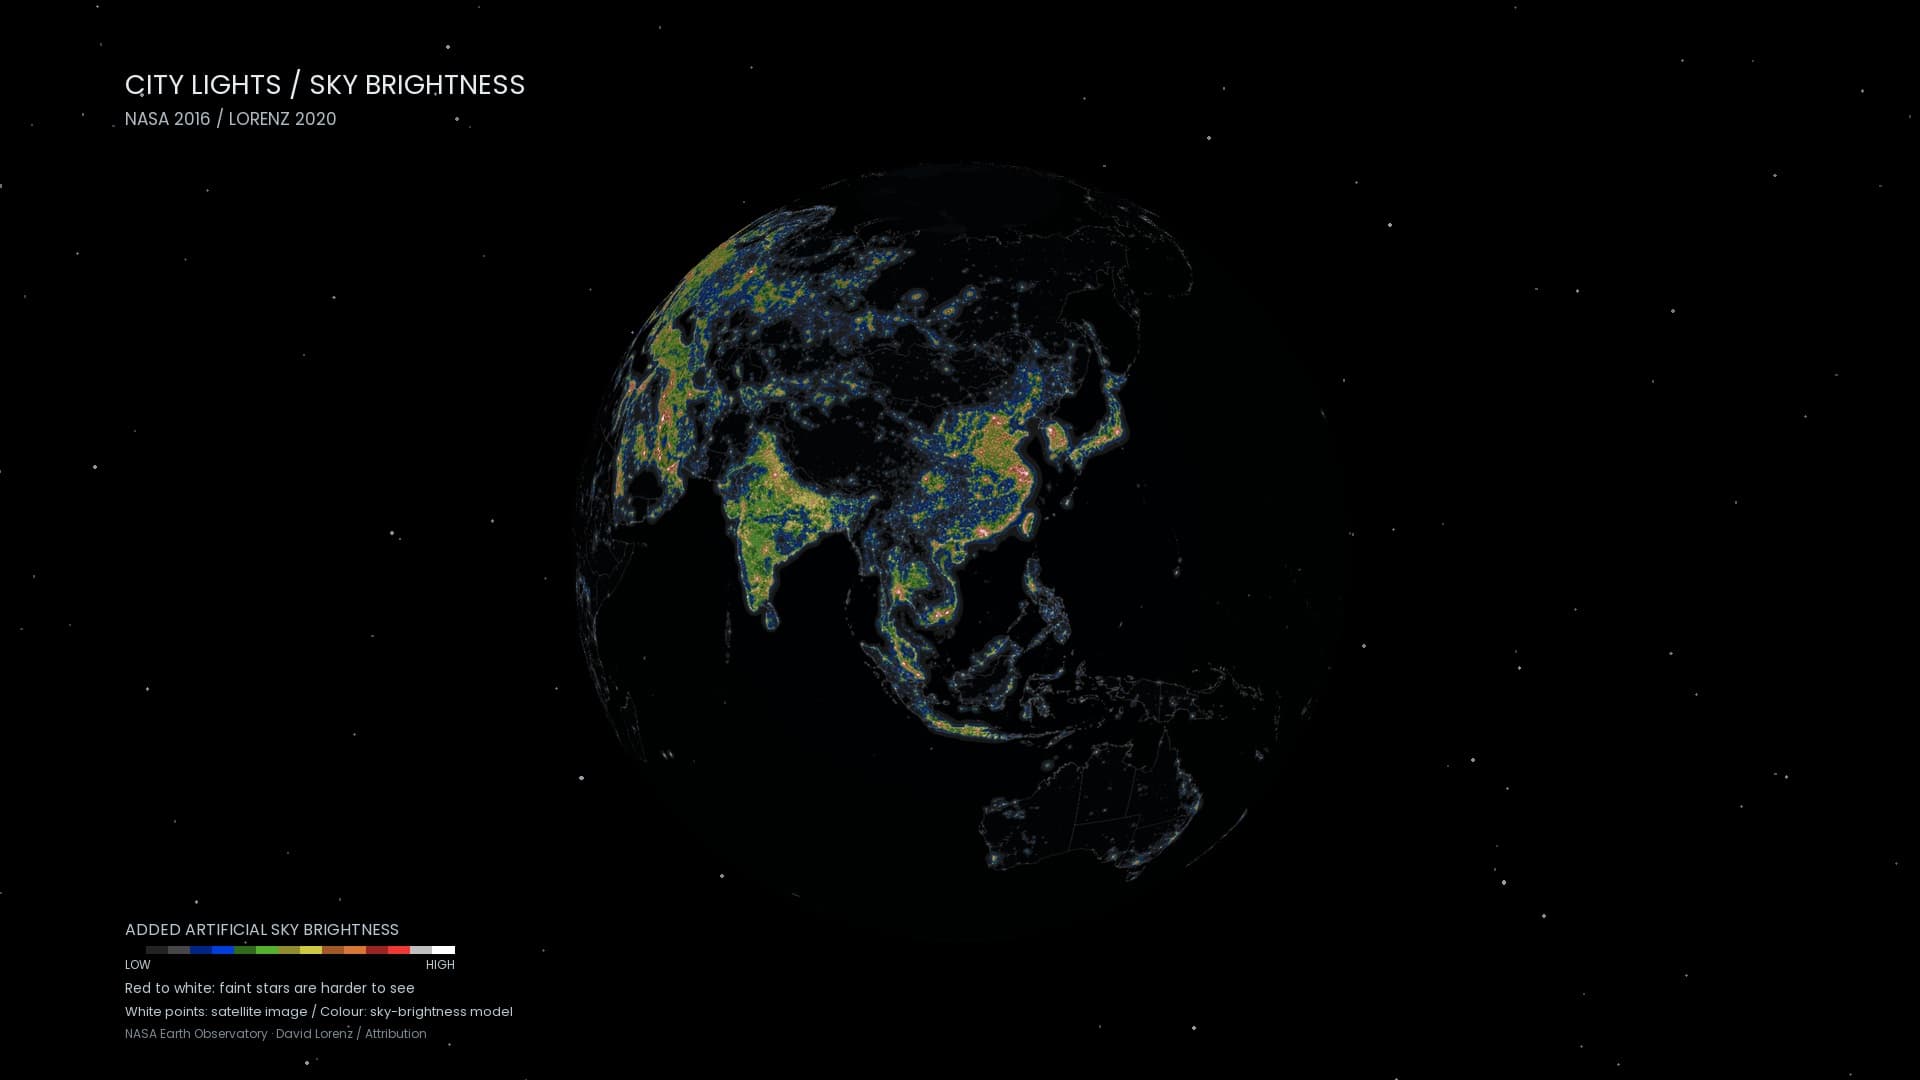
White: NASA 2016 night-light imagery. Colour: David Lorenz’s 2020 model of artificial zenith brightness. Different years and quantities; not a time trend. Colour shows added artificial sky brightness. Black to blue indicates lower impact; toward red and white, faint stars become harder to see.
Where light begins, and where it reaches
NASA’s 2016 night-light image traces settlements and coastlines through light reaching space. [1] From the ground, the view is different: molecules and particles scatter upward light through the atmosphere, adding brightness to skies beyond the city.David Lorenz’s model estimates artificial brightness at the zenith, directly overhead. Even far from a bright building, the sky can glow and faint stars become harder to distinguish. Light pollution does not end at a city boundary. [2]
A different sky within a generation
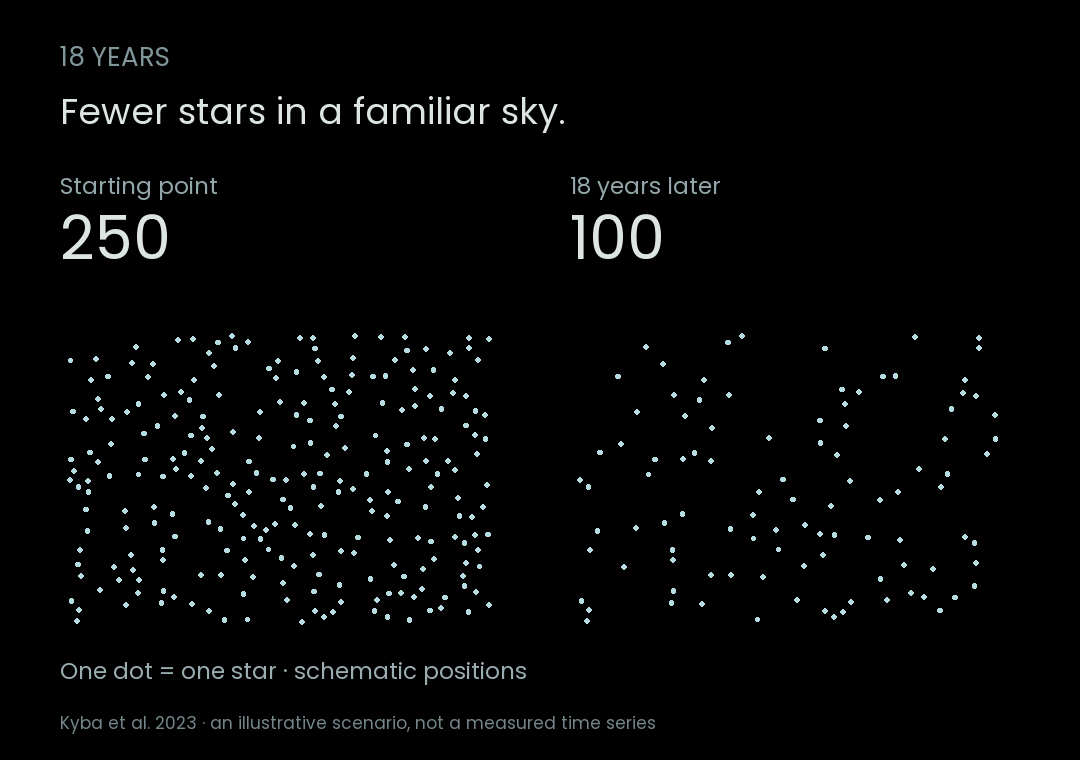
The authors’ illustration: a place with 250 visible stars could have about 100 after 18 years if sky brightening equivalent to 9.6% annually continues. One dot represents one star; positions are schematic, not constellations, an observed time series or a prediction for every location.
Against a brighter background, the faintest stars disappear from view first. A familiar childhood sky can become harder to recognise from the same place. The outcome depends on where lights point, when they operate and their colour, as well as how bright they are.
Useful light, in the right place
Lighting supports journeys home and work after dark. DarkSky and the Illuminating Engineering Society recommend five principles: useful, targeted, low-level, controlled and warm-coloured lighting. Directing a light toward a path and switching it off when unnecessary can reduce what escapes into the sky. [5]A safely lit street and stars overhead can belong to the same neighbourhood. Choosing how to use light is part of designing a place that retains both.
Data and interpretation
The colour classes express modelled artificial brightness at zenith relative to natural sky brightness: blue 0.11–0.33×, green 0.33–1×, yellow 1–3×, orange 3–9×, red 9–27×, pale grey to white 27× or more; black to dark grey is below 0.11×. Bright stars may still be visible in red areas; visibility also depends on the Moon, weather and observing conditions. White city-light points come from the separate NASA satellite image. David Lorenz: colour definitions
The background star field is an illustrative metaphor for stars becoming harder to see. It follows the globe’s camera rotation; it does not represent observed star positions, brightness or counts.
NASA Black Marble 2016 is an 8-bit display image, not a numeric radiance dataset. The upper layer uses a licensed image of David Lorenz’s 2020 model map: the original 31 October 2021 Wikimedia Commons upload. It is approximately registered to independent geographic coastlines within 65°S–75°N, correcting the source image’s east–west displacement, with the embedded-key footprint omitted. This is a cartographic-image transformation; the underlying numeric model is not included. No brightness values, star counts or Bortle classes are reconstructed from pixels. Opacity controls the visual overlay. Black is not classified as absence of light pollution. Neither current conditions nor a 2016–2020 trend is represented.
NASA Earth Observatory / David Lorenz. Attribution-only permission permits commercial use, derivatives and redistribution of the model-map image; Wikimedia VRT 2021120610011763. Source, processing and rights record.
Sources
Author
SORAH Editorial
October 6, 2026