Published on 12/October/2026 · Environment
The global agricultural trade behind our food.
By SORAH Editorial
Where do grain, fruit and animal feed come from—and where do they go? Follow exports and imports across 198 countries and areas through traded mass and direction.
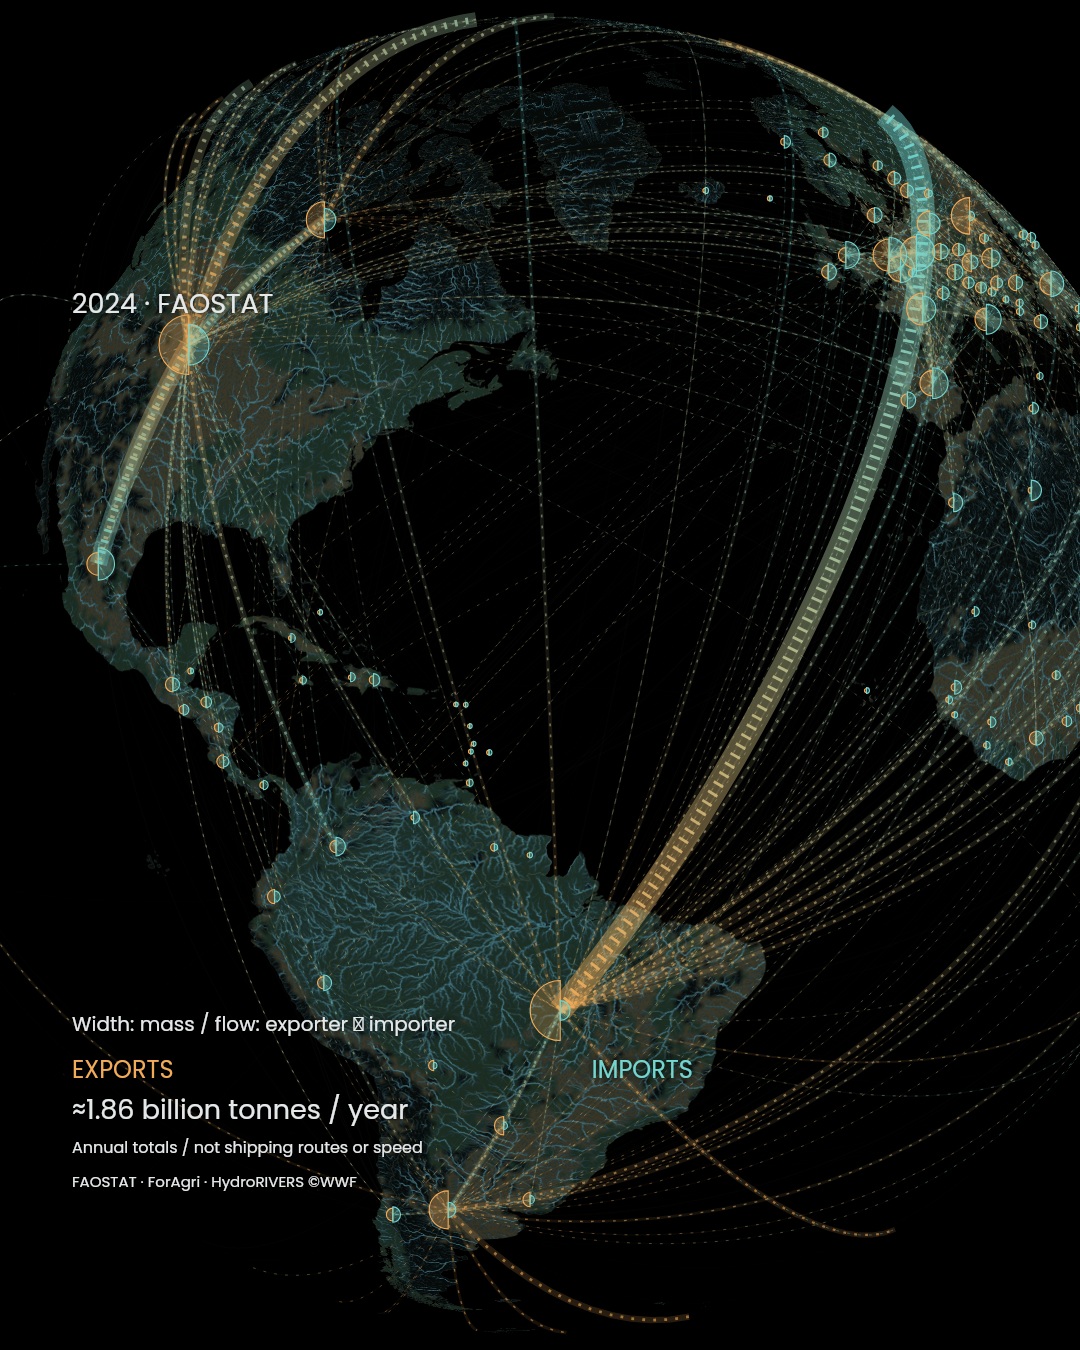
Where do grain, fruit and animal feed come from—and where do they go? Follow exports and imports across 198 countries and areas through traded mass and direction.
How many countries are in a meal?
Wheat for bread, cooking oil, feed for livestock: ingredients can cross borders before they resemble the food on a table. Tracing a finished product back toward the places supplying its ingredients reveals another geography of everyday meals.We use FAOSTAT’s detailed trade matrix for 2024, linking reporting countries, partners, commodities and quantities. The aggregation retains 518 commodities measured in tonnes, spanning food, animal feed and non-food agricultural goods. FAO Detailed trade matrix
198 countries and areas, 18,520 directions
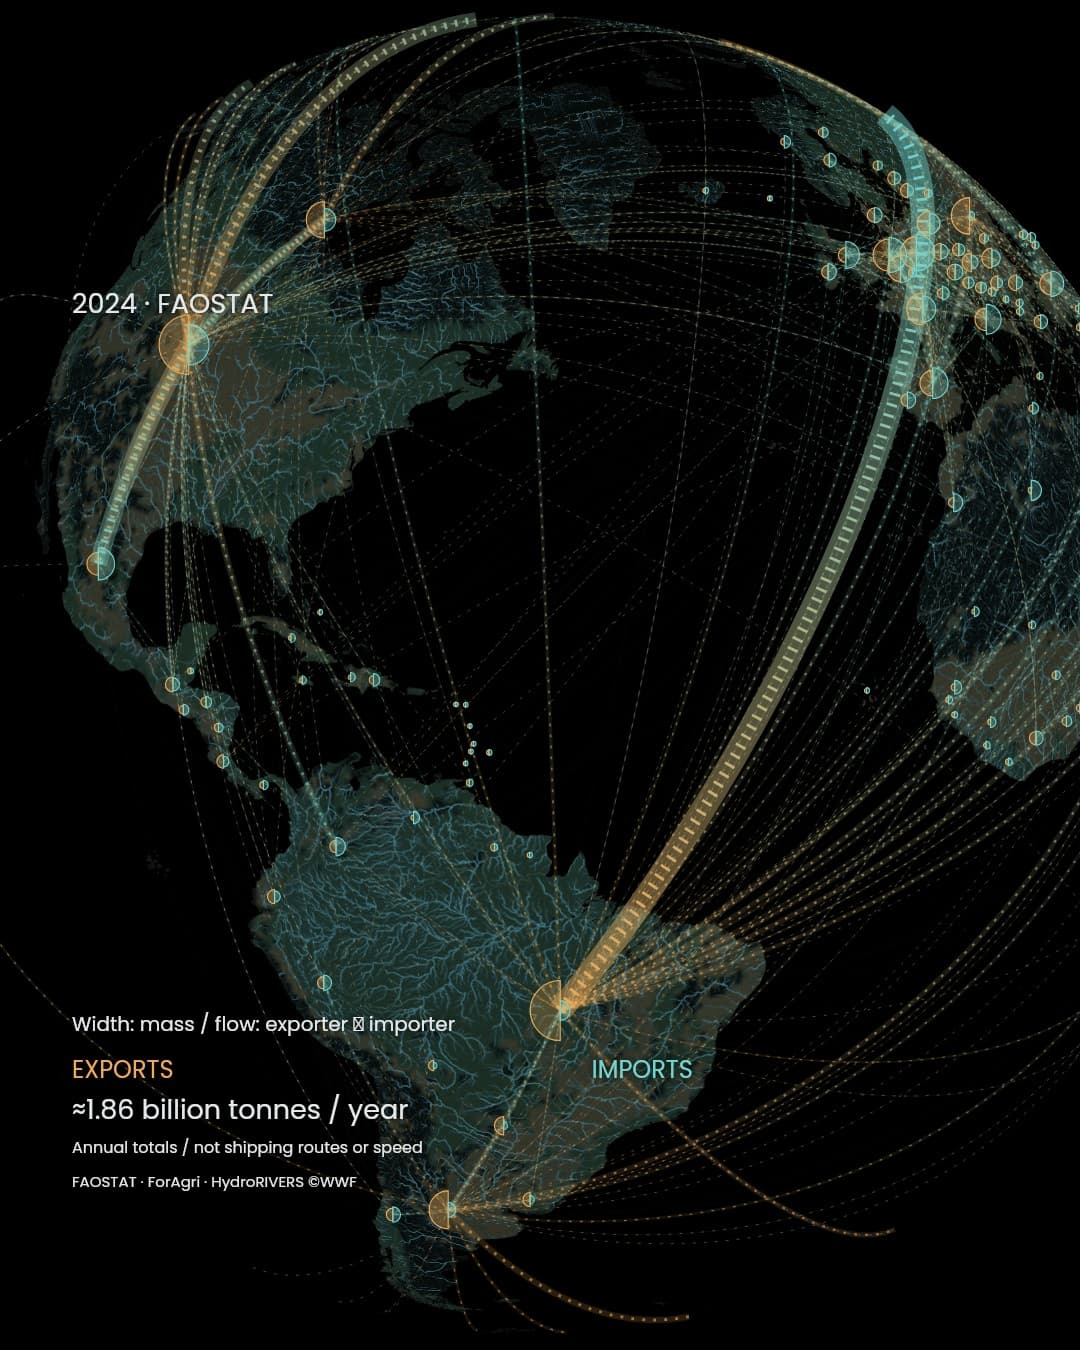
The aggregation includes 198 exporting and 198 importing countries and areas, connected by 18,520 directed pairs. Recorded mass totals about 1.86 billion tonnes. Amber marks the exporting end and teal the importing end. Reversing direction between the same two countries describes a different flow.Wider ribbons mean more annual recorded mass. Fine particles move from exporter to importer, making direction visible across the same year’s network. Mass and direction together reveal how countries differ in what they send and receive. 2024 bilateral aggregation
Retaining smaller relationships alongside the major ones reveals a wider network than a handful of emblematic routes. Selecting a country turns that global pattern into a view of what one place sends and receives.
Most countries play both roles
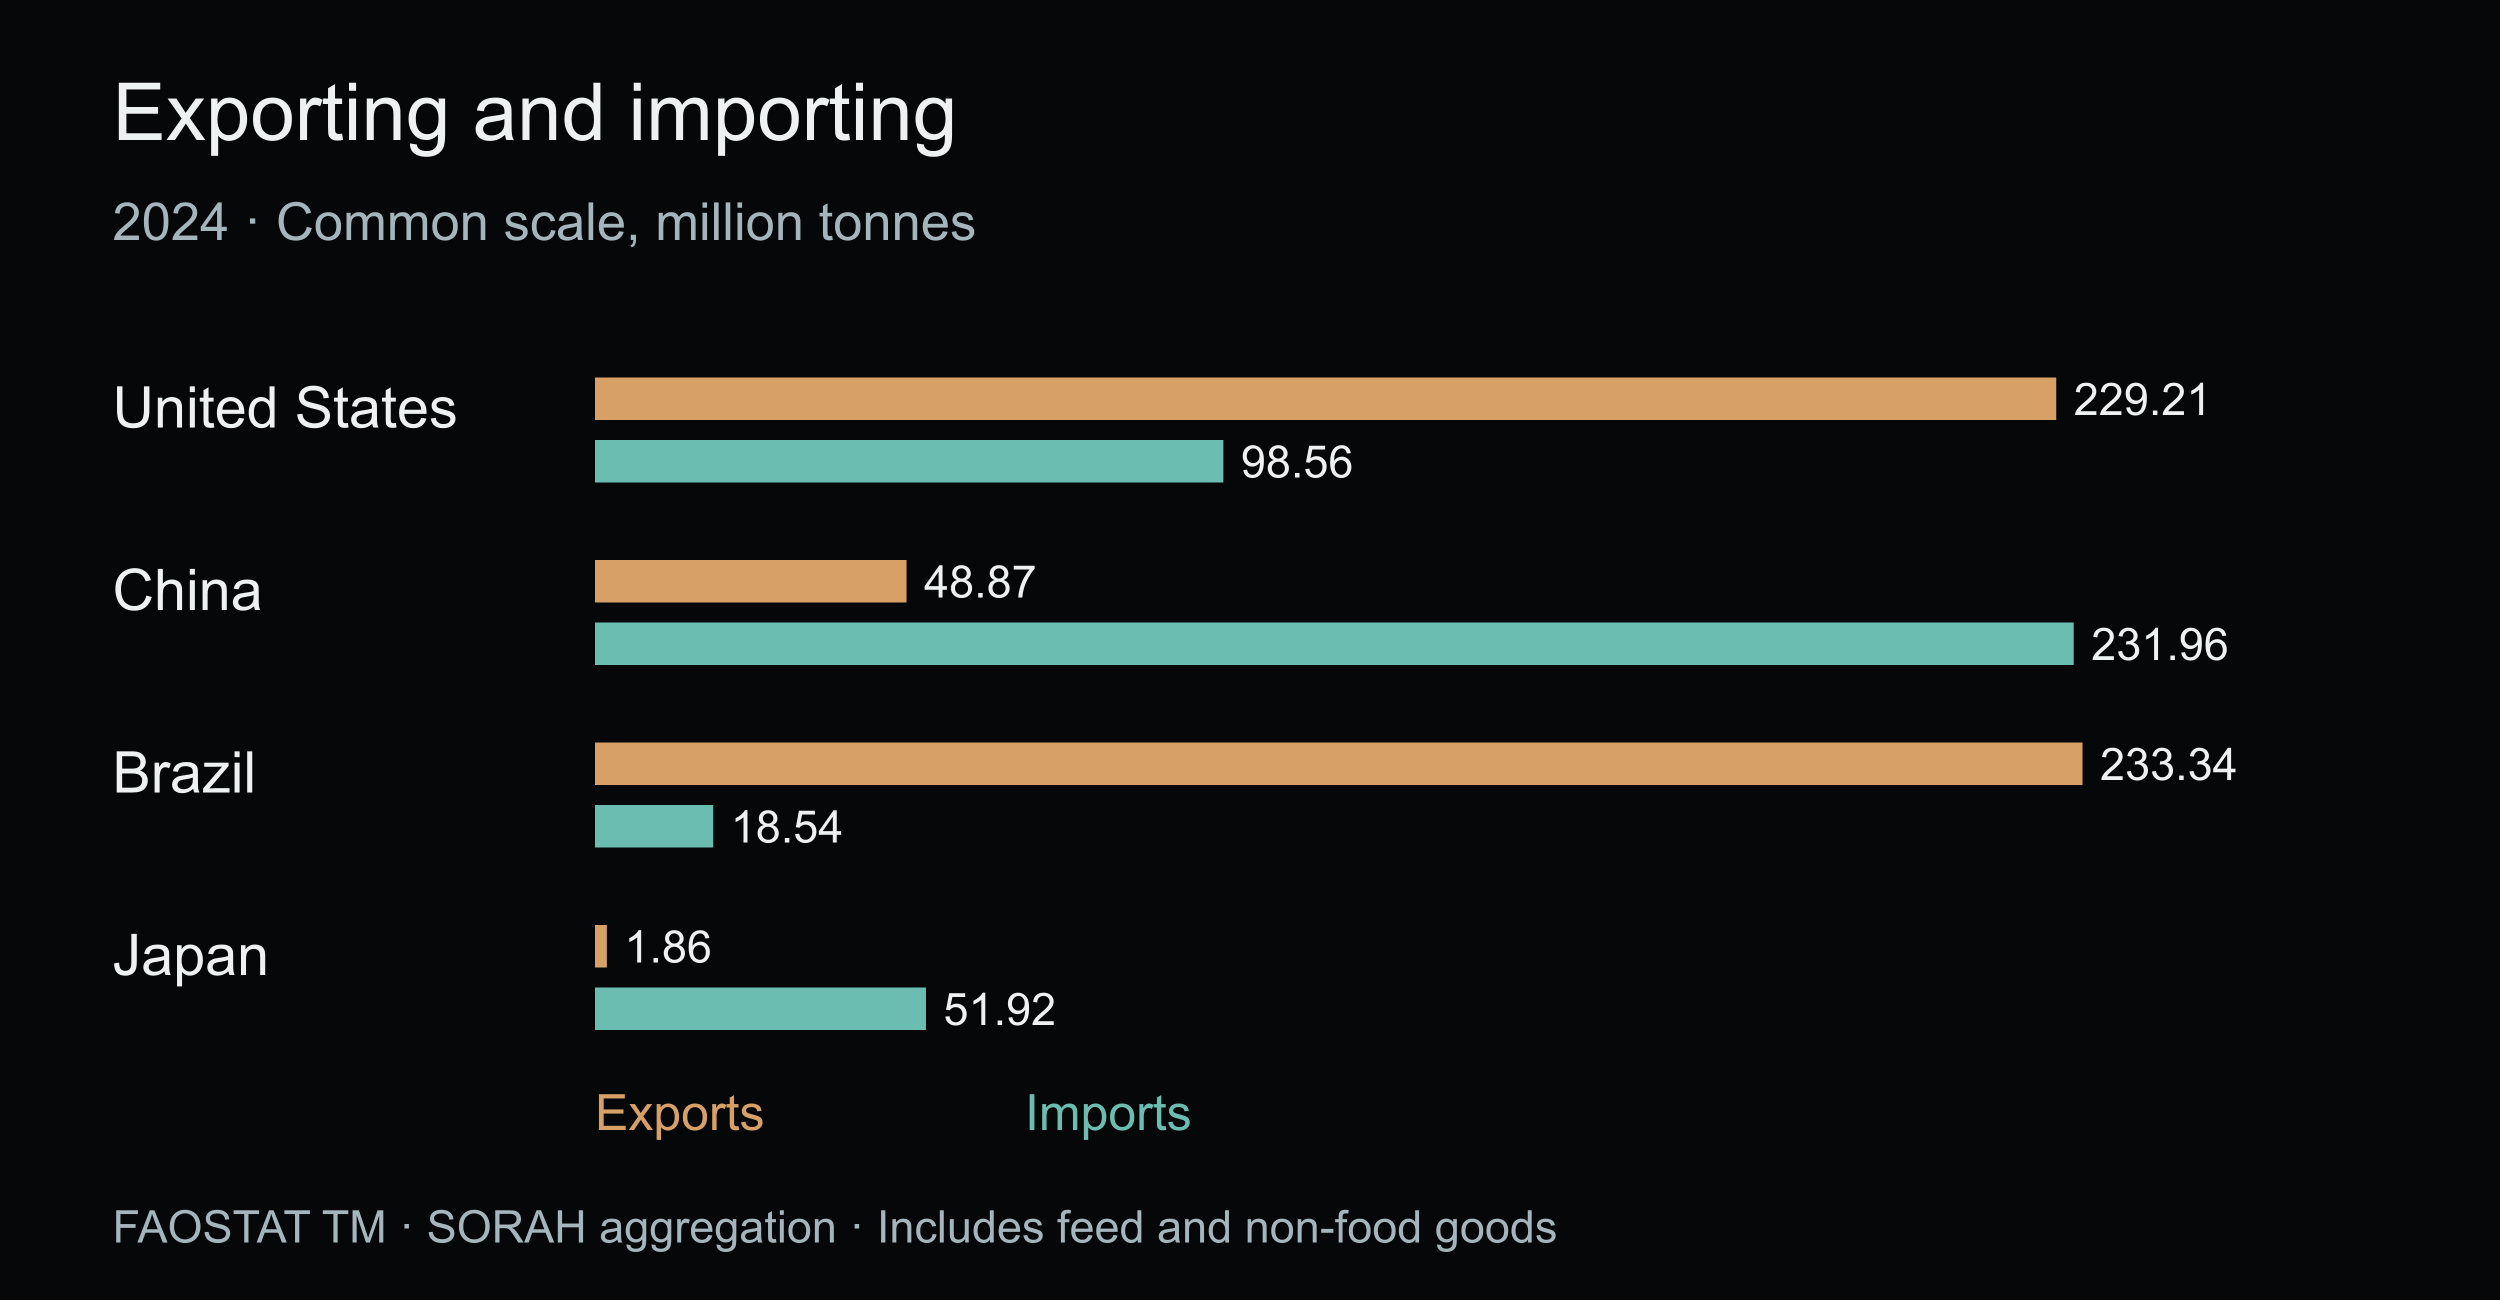
Within this aggregation, US exports amount to about 229 million tonnes and imports to 99 million. China combines about 232 million tonnes of imports with 49 million of exports. Brazil exports about 233 million tonnes. Japan imports about 51.92 million tonnes and exports 1.86 million. A common mass scale across the retained 518 commodities helps reveal each country’s role in agricultural trade. SORAH aggregationThe two semicircles assigned to each country show exports and imports on a common scale. A large exporter also receives goods, and a large importer supplies other places. These overlapping roles form the network through which agricultural goods move.
What can a tonne tell us?
Mass draws attention to the physical scale of goods crossing borders. A tonne of wheat, fruit or oil carries its own price, nutritional content and water content. Looking from the mass map into the commodity mix opens a further question: which diets and industries do these large flows support?Processing and re-export can take the same material across successive borders. The 1.86 billion tonnes sums those gross cross-border transactions. Tracing an exporter back toward the origin of its inputs reveals overlapping roles in production, processing and distribution.
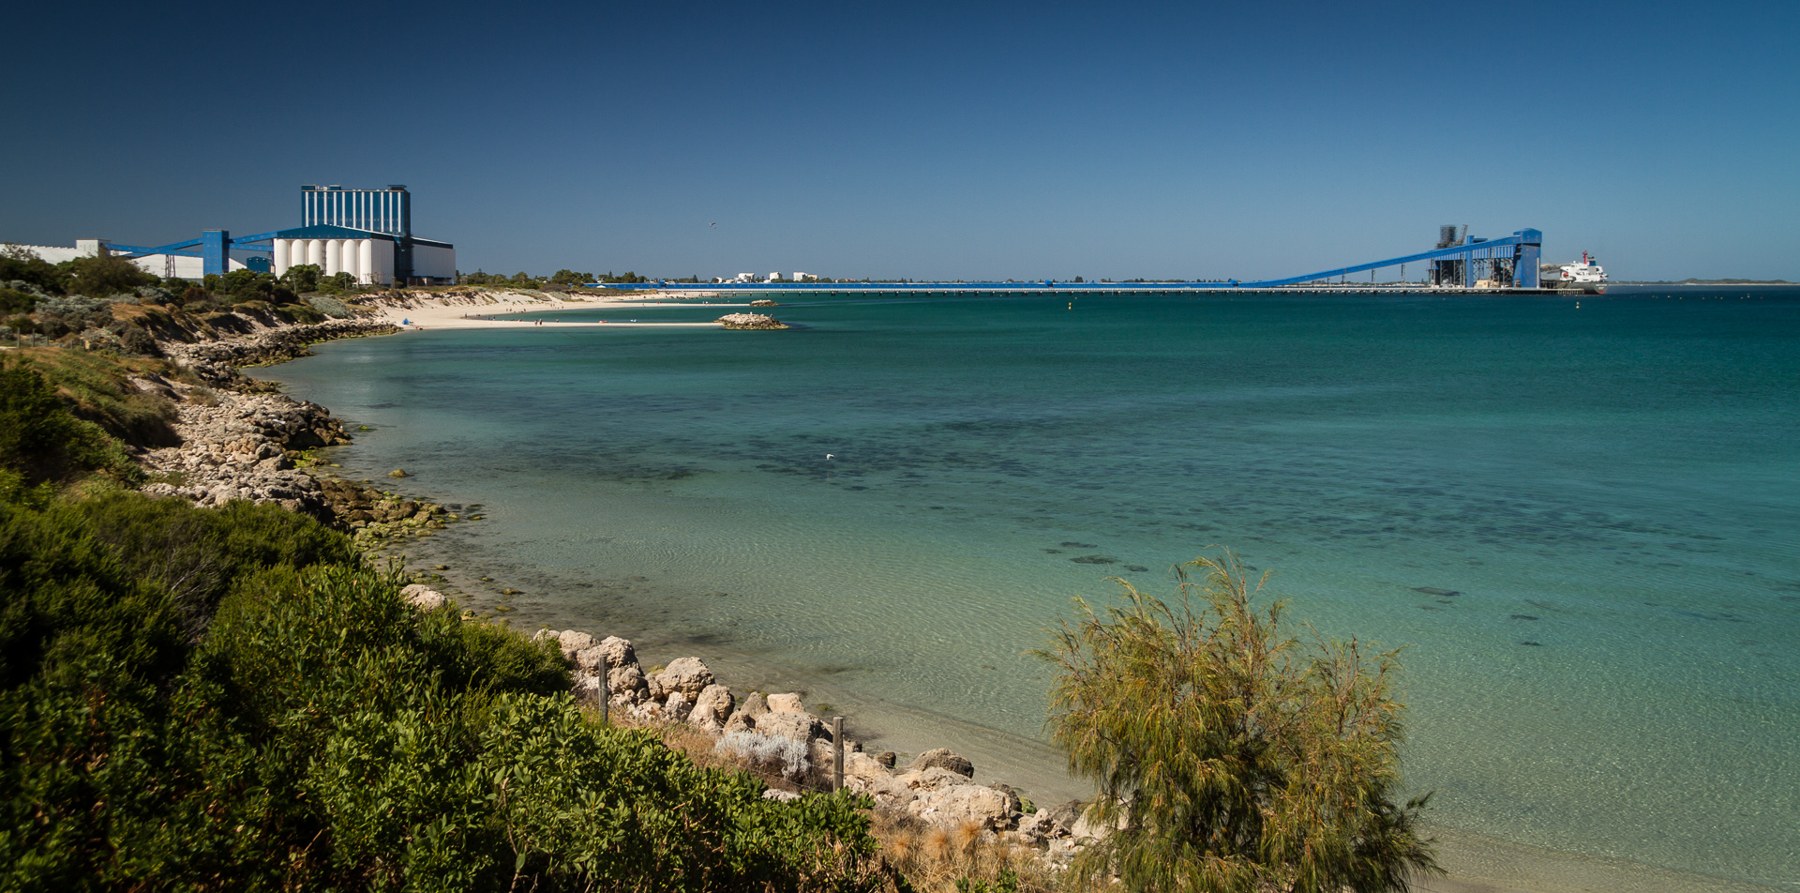
Kwinana Grain Terminal in Western Australia is one setting where land-based production meets maritime transport. The photograph connects a globe-spanning ribbon to the facilities and people that store and load agricultural goods.
The land beneath the network
Farmland, forests and rivers draw attention to the landscapes behind trade. Crops depend on water, soil and suitable growing conditions. Examining the natural environment of major trading countries offers a starting point for understanding what supports production far away.Forests can also support production through rainfall. Research by Pranindita and colleagues in 2025 used models to examine atmospheric moisture from forests and its role in rainfall and crop supply. It adds a perspective on the water cycle supporting agricultural production. Pranindita et al. (2025)
Looking beneath a trade ribbon opens another set of questions: what does a country receive, and what does it send? What water and soils support those crops? The relationship between a meal and the world can be read anew through production and the natural environment of each country and region.
Data and representation
Trade: FAOSTAT Detailed trade matrix (TM), 2024, 518 commodities measured in tonnes, including food, feed and non-food agricultural goods. Head/count units, regional and world totals, and same-country entries are excluded. Catalog revised 22 December 2025; archive update record 23 December; accessed 12 October 2026. CC BY 4.0.For each country-pair/item, export quantity (5910), including reported zeros, takes precedence. Where missing, partner import quantity (5610) is used once. Mirror reports contribute 9.3% of mass and all Russian export values. Missing records retain missing status. Totals cover the retained commodities and reports.
198 exporters, 198 importers, 18,520 directed pairs. Annual gross mass includes re-exports and successive border crossings after processing. Tracing production origins or assessing nutrition, calories and water footprints requires additional data for each purpose.
Width uses mass^0.7 plus a minimum. Both semicircle radii use the same square-root scale plus a minimum. Left amber denotes exports, right teal imports. Endpoints are Natural Earth representative country locations. Animated grain on up to 800 major ribbons is a schematic direction cue; the whole network represents the 2024 annual aggregate.
Forest and farmland: fixed ForAgri 0.5° dominant classes based on mixed-year inputs including MIRCA circa 2000 and MODIS. Rivers: HydroRIVERS mainstems and tributaries, Strahler order 3+. Background layers encode land cover and river positions.
Forest–rain context: Pranindita et al. (2025) is a model-based study of forest-derived moisture, rainfall and crop supply. The main map’s export–import ribbons use FAOSTAT international trade records.
Kwinana Grain Terminal, Western Australia. Photographed on 19 January 2014. Stephen Edmonds · CC BY-SA 3.0 · Source. Proportional resizing and JPEG compression only.
Sources
Author
SORAH Editorial
October 12, 2026