
Published on 15/October/2026 · City
New York’s PM2.5: Fifteen Years of Changing Air
By SORAH Editorial
Annual maps from 2009, 2019 and 2024 connect cleaner air with buildings, kitchens and the work of a city.
New York’s air carries traces of everyday work: heating a building, cooking a meal, moving a delivery. The same activities that keep the city running also help shape the pollution encountered along its streets.
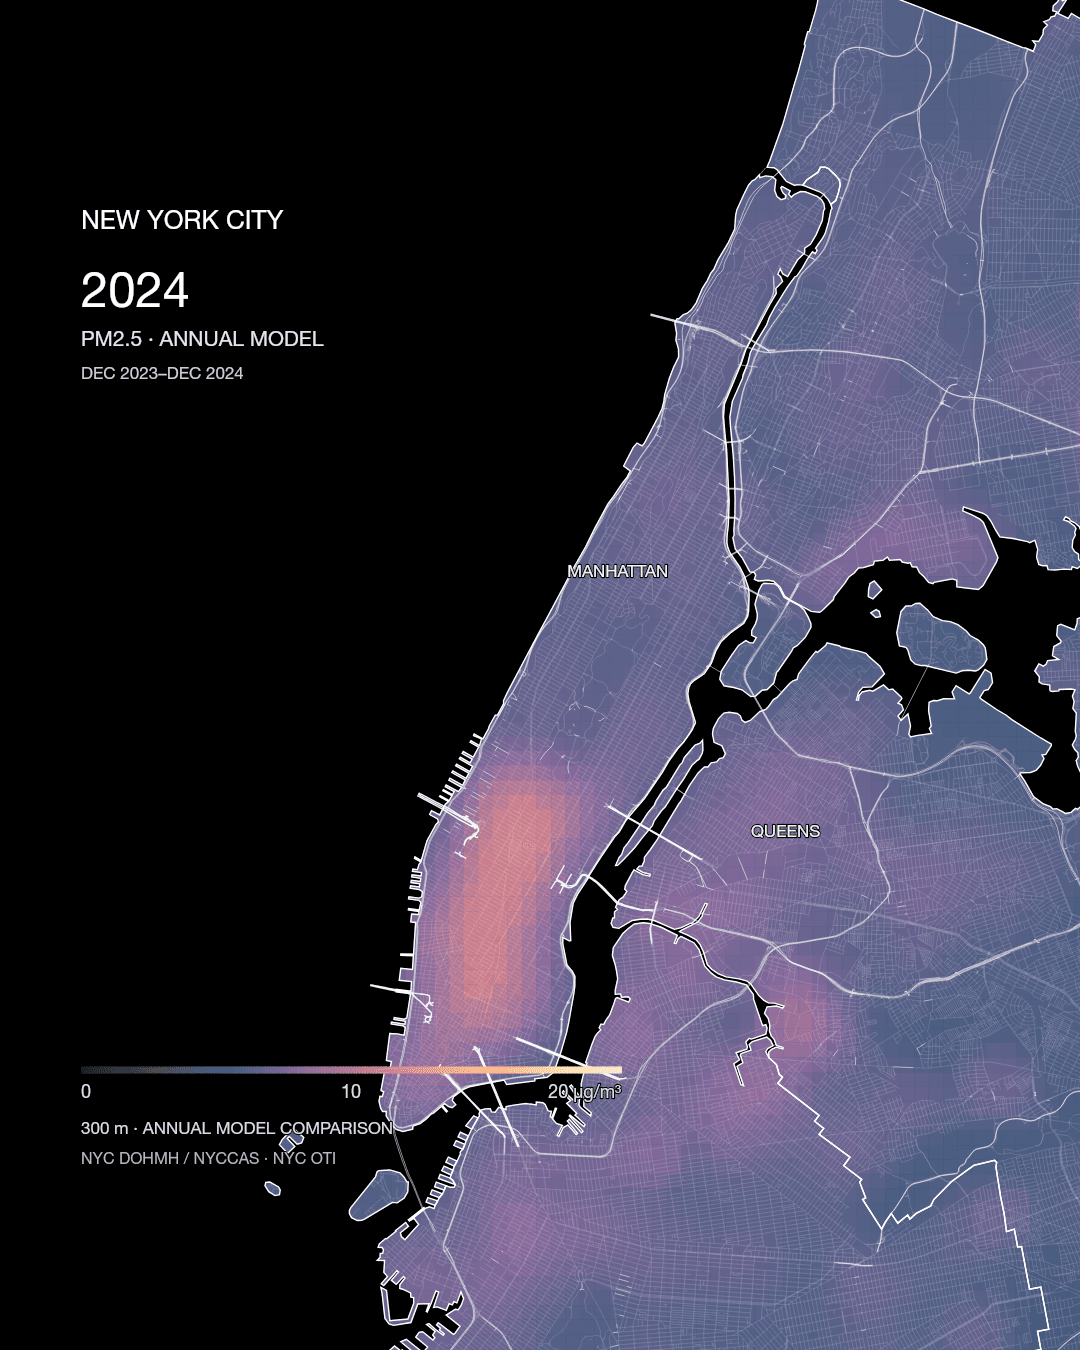
The New York City Community Air Survey, or NYCCAS, reports a 36% decrease in citywide annual average PM2.5 between 2009 and 2024. To explore that longer history, this film holds Manhattan and its surroundings in one view while comparing the city’s official annual model surfaces for 2009, 2019 and 2024. NYC DOHMH · NYCCAS Report: 2008–2024
Measuring the air where people walk
Field teams attach samplers to street lamps and collect air over two-week periods each season. Filters capture fine particles for laboratory analysis. Reference locations operate throughout the year, helping the researchers account for weather-related changes shared across the city. NYCCAS · Sampling MethodologyThose measurements become the starting point for a map. A land-use regression model relates concentrations to the surrounding streets, buildings and land uses, then estimates conditions elsewhere. The resulting surface brings together the physical work of collecting samples and a statistical reading of the city. NYCCAS · Sampling Methodology
A change beneath the buildings
Boilers burn fuel to provide heat and hot water. Heavy heating oil was once a major clue to neighborhood particle pollution. New York City’s 2010 legislation phased out No. 6 oil, while the state reduced the permitted sulfur content of No. 2 oil in 2012. Cleaner fuels changed the emissions coming from buildings. NYC DOHMH · Tracking changes in pollution sourcesBehind a changing map are building owners choosing equipment, technicians maintaining boilers and public agencies setting requirements. Seen this way, cleaner air is connected to practical decisions made in basements, on rooftops and across the city’s heating infrastructure.
Kitchens, streets and the differences that remain
As heating emissions fell, other sources became more prominent in explaining neighborhood differences. The city found that the density of restaurants with grills and charbroilers had become an important predictor of PM2.5. Local Law 38 of 2015 brought commercial cooking into the Air Code, leading to equipment registration and emission-control requirements for covered appliances. NYC DOHMH · Tracking changes in pollution sourcesOn the streets, vehicles contribute particles through exhaust, tire wear and braking. The arrangement of buildings, kitchens, industry and traffic creates different local conditions. A map of air quality can therefore offer another way to read the work of feeding and supplying a city—and the shared air around that work. NYC DOHMH · Your Neighborhood’s Air Quality
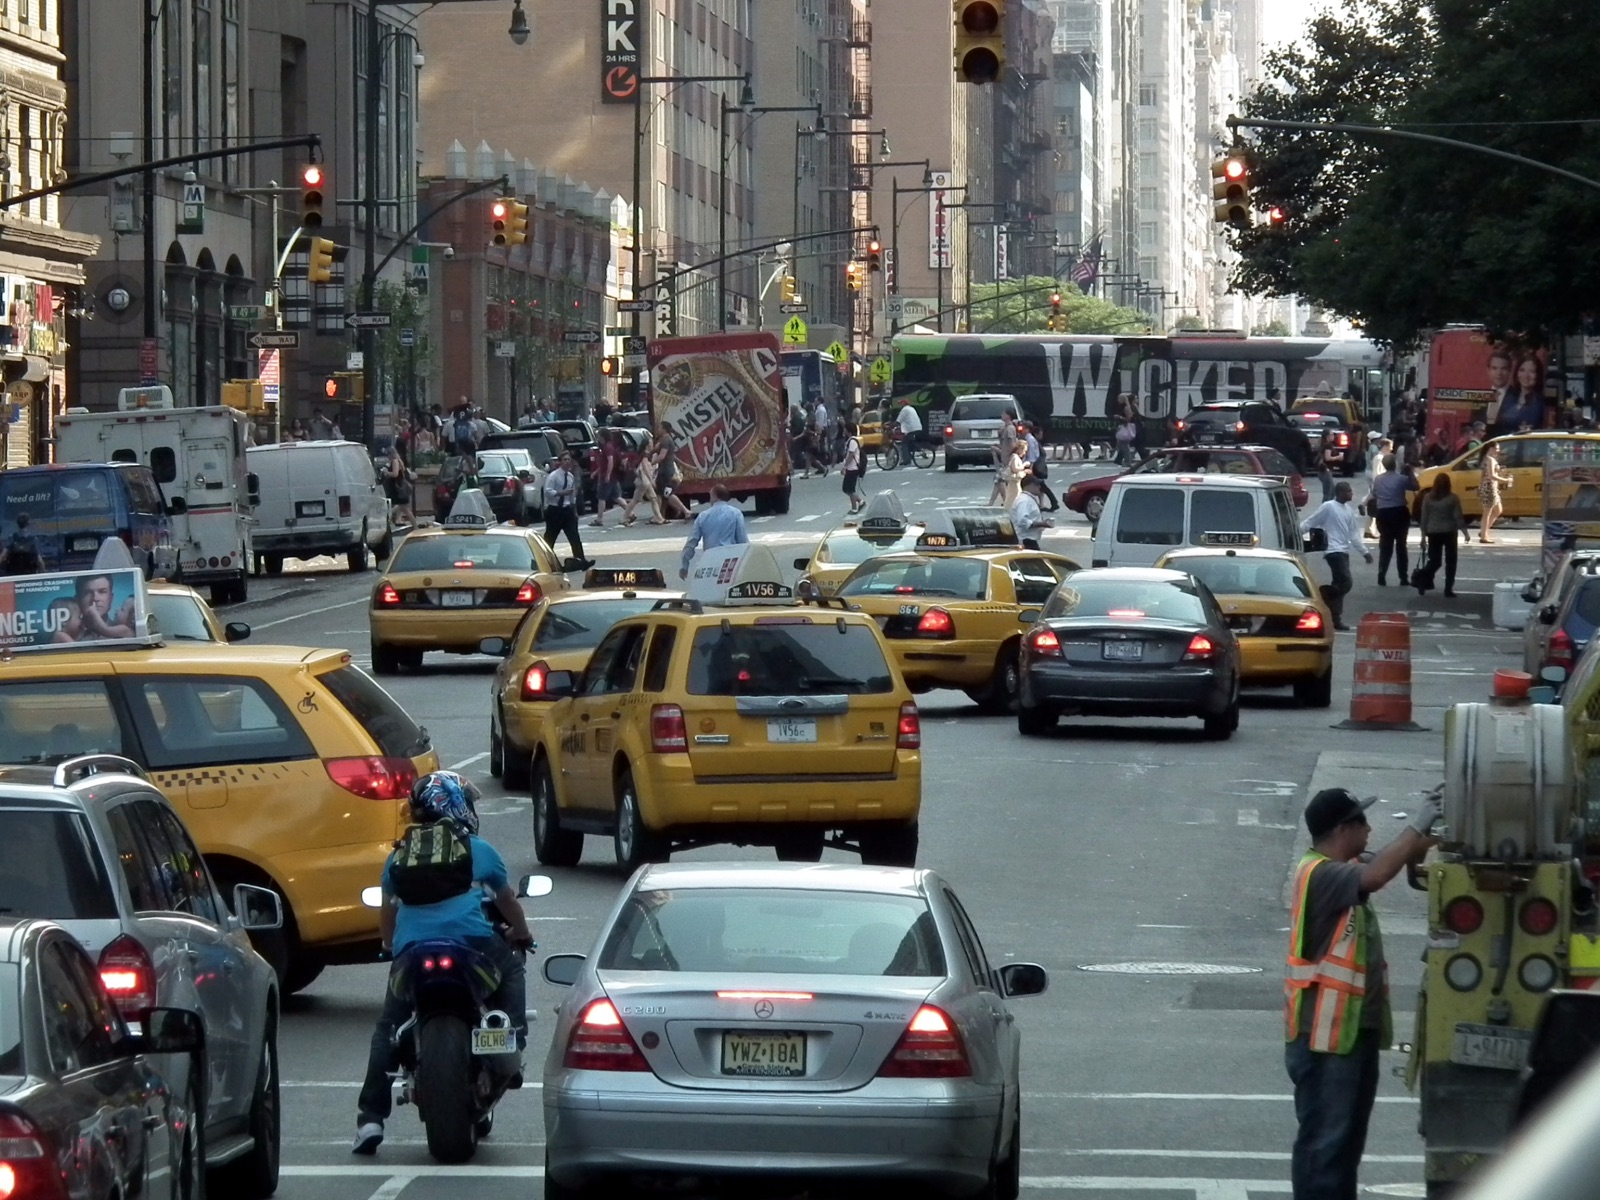
Taxis, delivery vehicles and pedestrians on a Manhattan street, August 2, 2011. Erik Drost · Source · CC BY 2.0 Proportional resize and JPEG compression only.
Air arriving from beyond New York
The city’s real-time monitors reveal shorter rhythms as traffic changes and weather traps or disperses emissions. An annual map gives these changing conditions a longer frame. NYC DOHMH · Real-Time Air QualityThat frame also includes distant events. The NYCCAS report attributes elevated summer 2024 particle concentrations in part to smoke from wildfires in the western United States and Canada. Local emission reductions and pollution arriving from far away both belong to the city’s air history. NYC DOHMH · NYCCAS Report: 2008–2024
With the street geometry held still, three annual maps bring improvement and persistent local differences into the same view. They invite us to connect the air on a familiar block with the buildings, transport and everyday work that surround it.
Data and representation
The film uses NYC DOHMH’s official annual PM2.5 model rasters aa1_pm300m, aa11_pm300m and aa16_pm300m. The March 2026 dictionary identifies the periods as December 2008–December 2009, December 2018–December 2019 and December 2023–December 2024. Units are µg/m³ and the distributed grid spacing is 300 m. Original cells were converted to geographic polygons. The producer’s models, predictors and monitoring network can change between years. NYC Open Data · NYCCAS Air Pollution RastersAll three citywide datasets remain in the project; the film frames Manhattan and nearby areas. Its camera and 0–20 µg/m³ color scale stay fixed. Crossfades are editorial transitions between two annual maps, with both endpoint years displayed during the transition. The 36% figure comes from the city’s annual report.
The white street geometry comes from NYC OTI’s constructed road centerlines, retrieved on October 13, 2026, clipped to the display area and simplified by approximately 1 m. This contemporary street network is shared across all three air-quality years. Coast and borough outlines use NYC Health geography. Line weights indicate cartographic hierarchy. NYC Open Data terms apply; SORAH’s display processing is identified alongside the original sources. NYC OTI · Street Centerline (CSCL)
Sources
Author
SORAH Editorial
October 15, 2026

.jpg)