Published on 10/October/2026 · Energy
Hydropower: generating electricity, storing energy.
By SORAH Editorial
Compare conventional hydropower and pumped storage across the world.
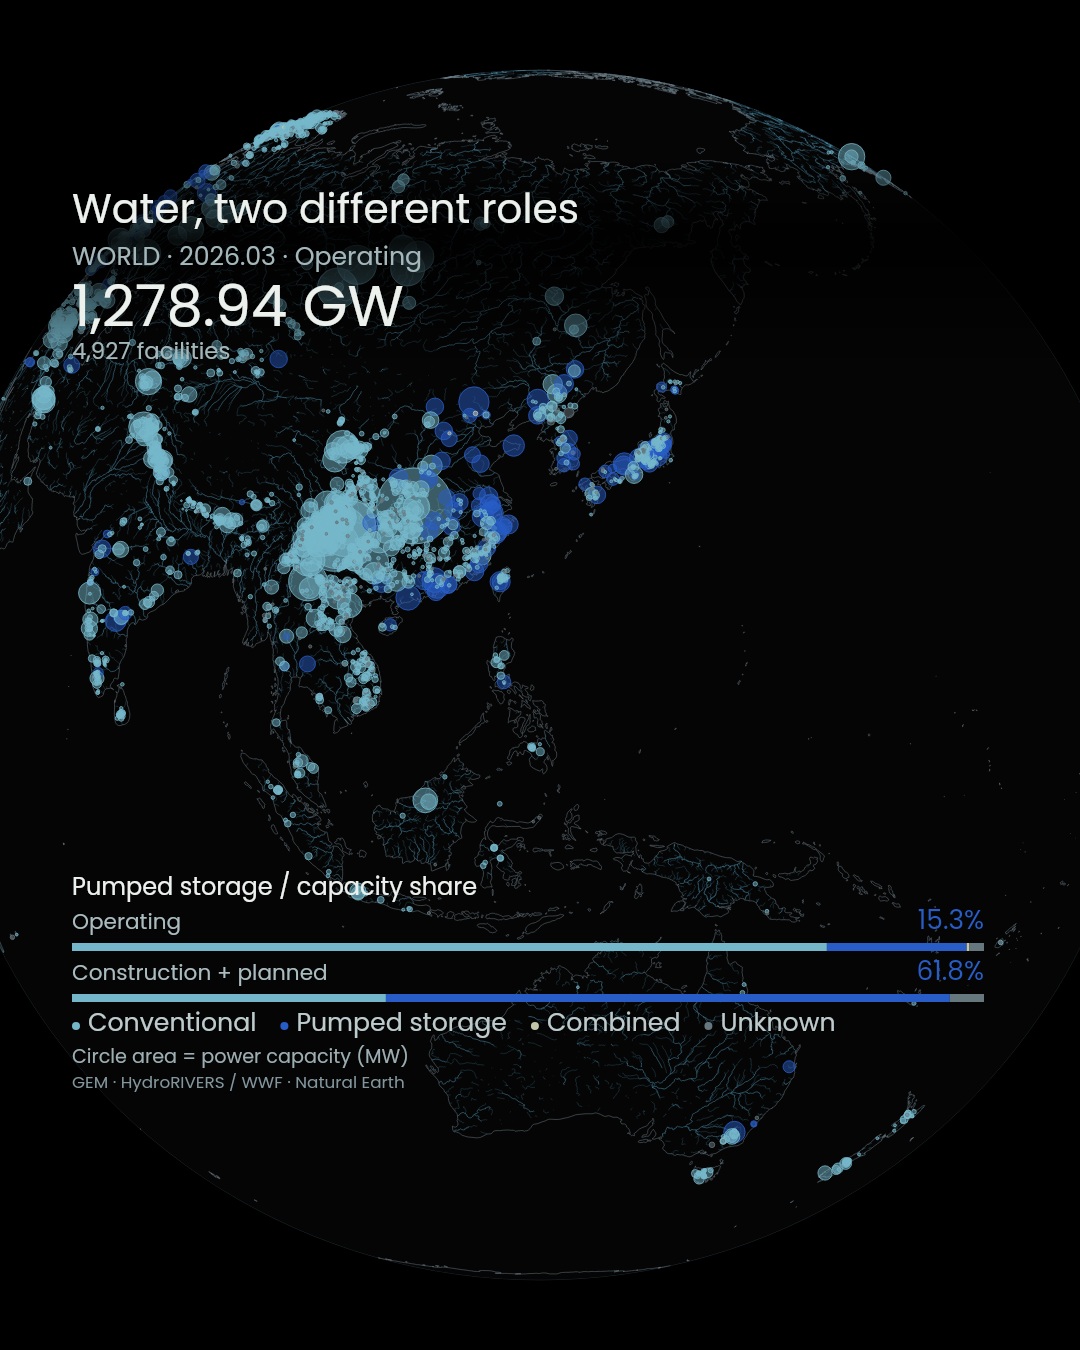
Water flows downhill. Alongside the hydropower plants that use this movement, another type of infrastructure sends water uphill again. Pumped storage uses electricity to raise water, then releases it through turbines when power is needed. Water becomes a means of moving usable energy from one time to another. US Department of Energy
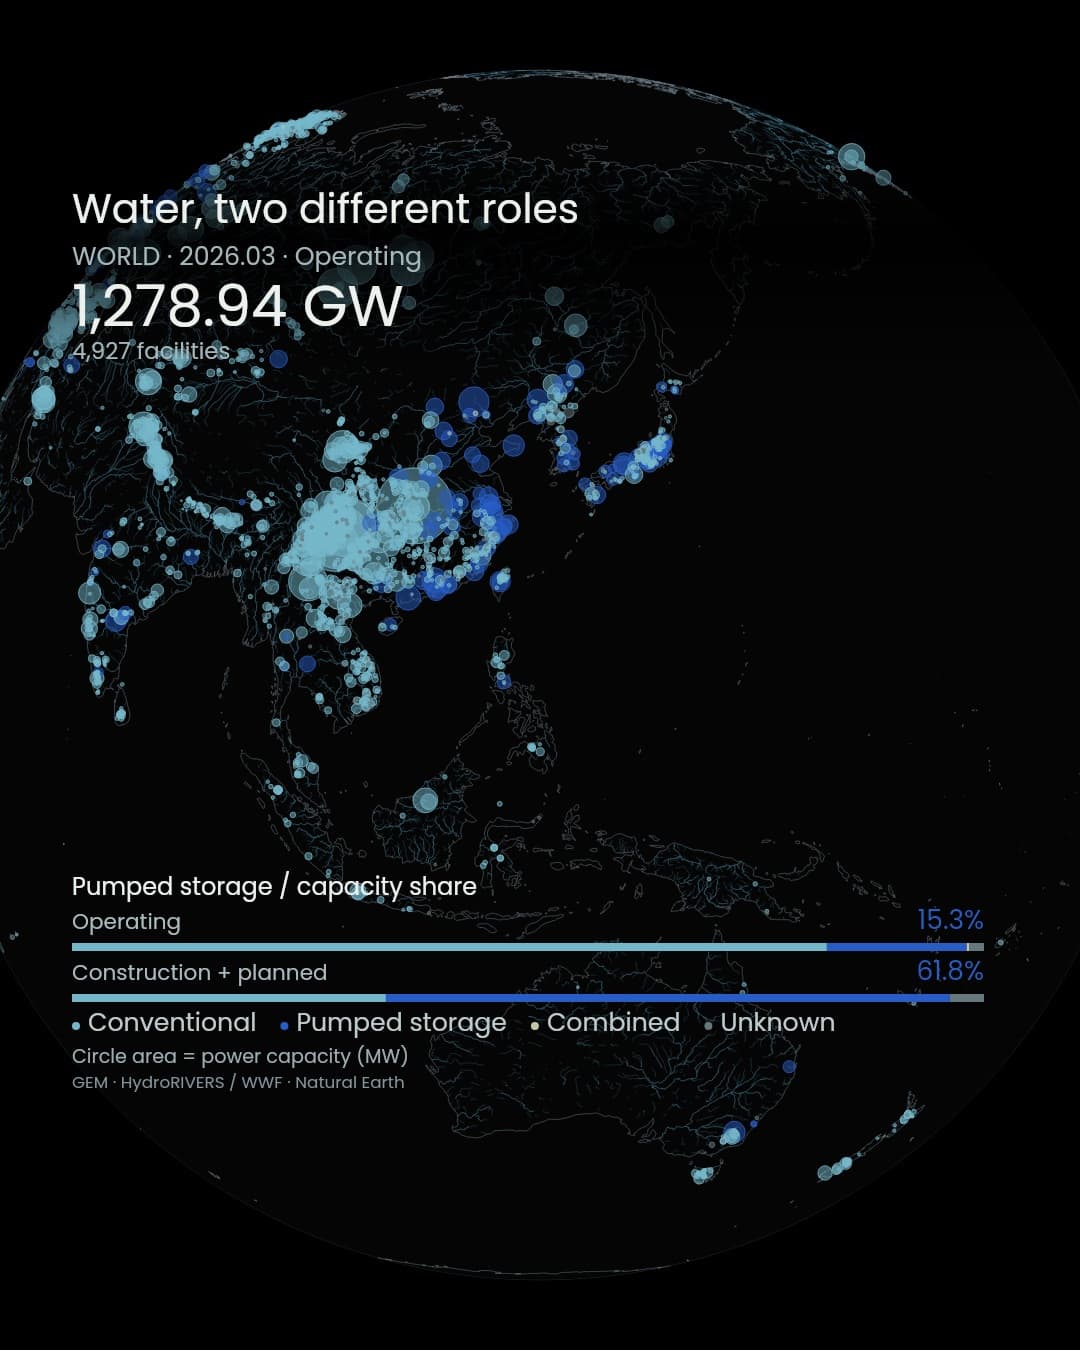
In the downloaded March 2026 GEM map, the pumped-storage-only category accounts for 15.3% of operating hydropower capacity. Among construction and planned projects combined, its share is 61.8%. The existing fleet and the prospective fleet have different compositions. Not every plan will be completed, but the difference offers a way to consider the roles expected of hydropower.
The ability to generate, the amount that can be stored
The retrieved data records 4,927 operating facilities with 1,278.94 GW of capacity, including 196.12 GW classified as pumped storage alone. GEM distinguishes conventional, pumped and combined facilities. This graphic keeps that distinction: pale blue for conventional hydropower, deep blue for pumped storage, and a separate colour for combined plants. GEM definitions and coverageMW and GW describe the rate at which a plant can supply power. How long it can continue depends on usable water, elevation difference and operating conditions. A larger pumped-storage circle cannot, by itself, be read as a larger quantity of stored electricity.
The US Department of Energy describes pumped storage with separate quantities for generating power and stored energy. That distinction matters in a global comparison too. A capacity map shows where the ability to deliver power is located. Comparing storage duration requires additional information. Pumped-storage operation and storage
Following rivers, storing away from them
Conventional hydropower includes plants using stored reservoir water and plants relying mainly on river flow. The fine river network places each facility within a wider system extending upstream and downstream.Pumped-storage plants do not all relate to rivers in the same way. Open-loop systems maintain a connection with natural waters; closed-loop systems use reservoirs without that ongoing connection. A US national-laboratory comparison found potential for closed-loop designs to reduce river-related effects, while identifying groundwater and geological impacts that still require assessment. Moving off-river does not remove a project's environmental relationships. DOE account of the 2020 study
Downstream, the timing of water matters too
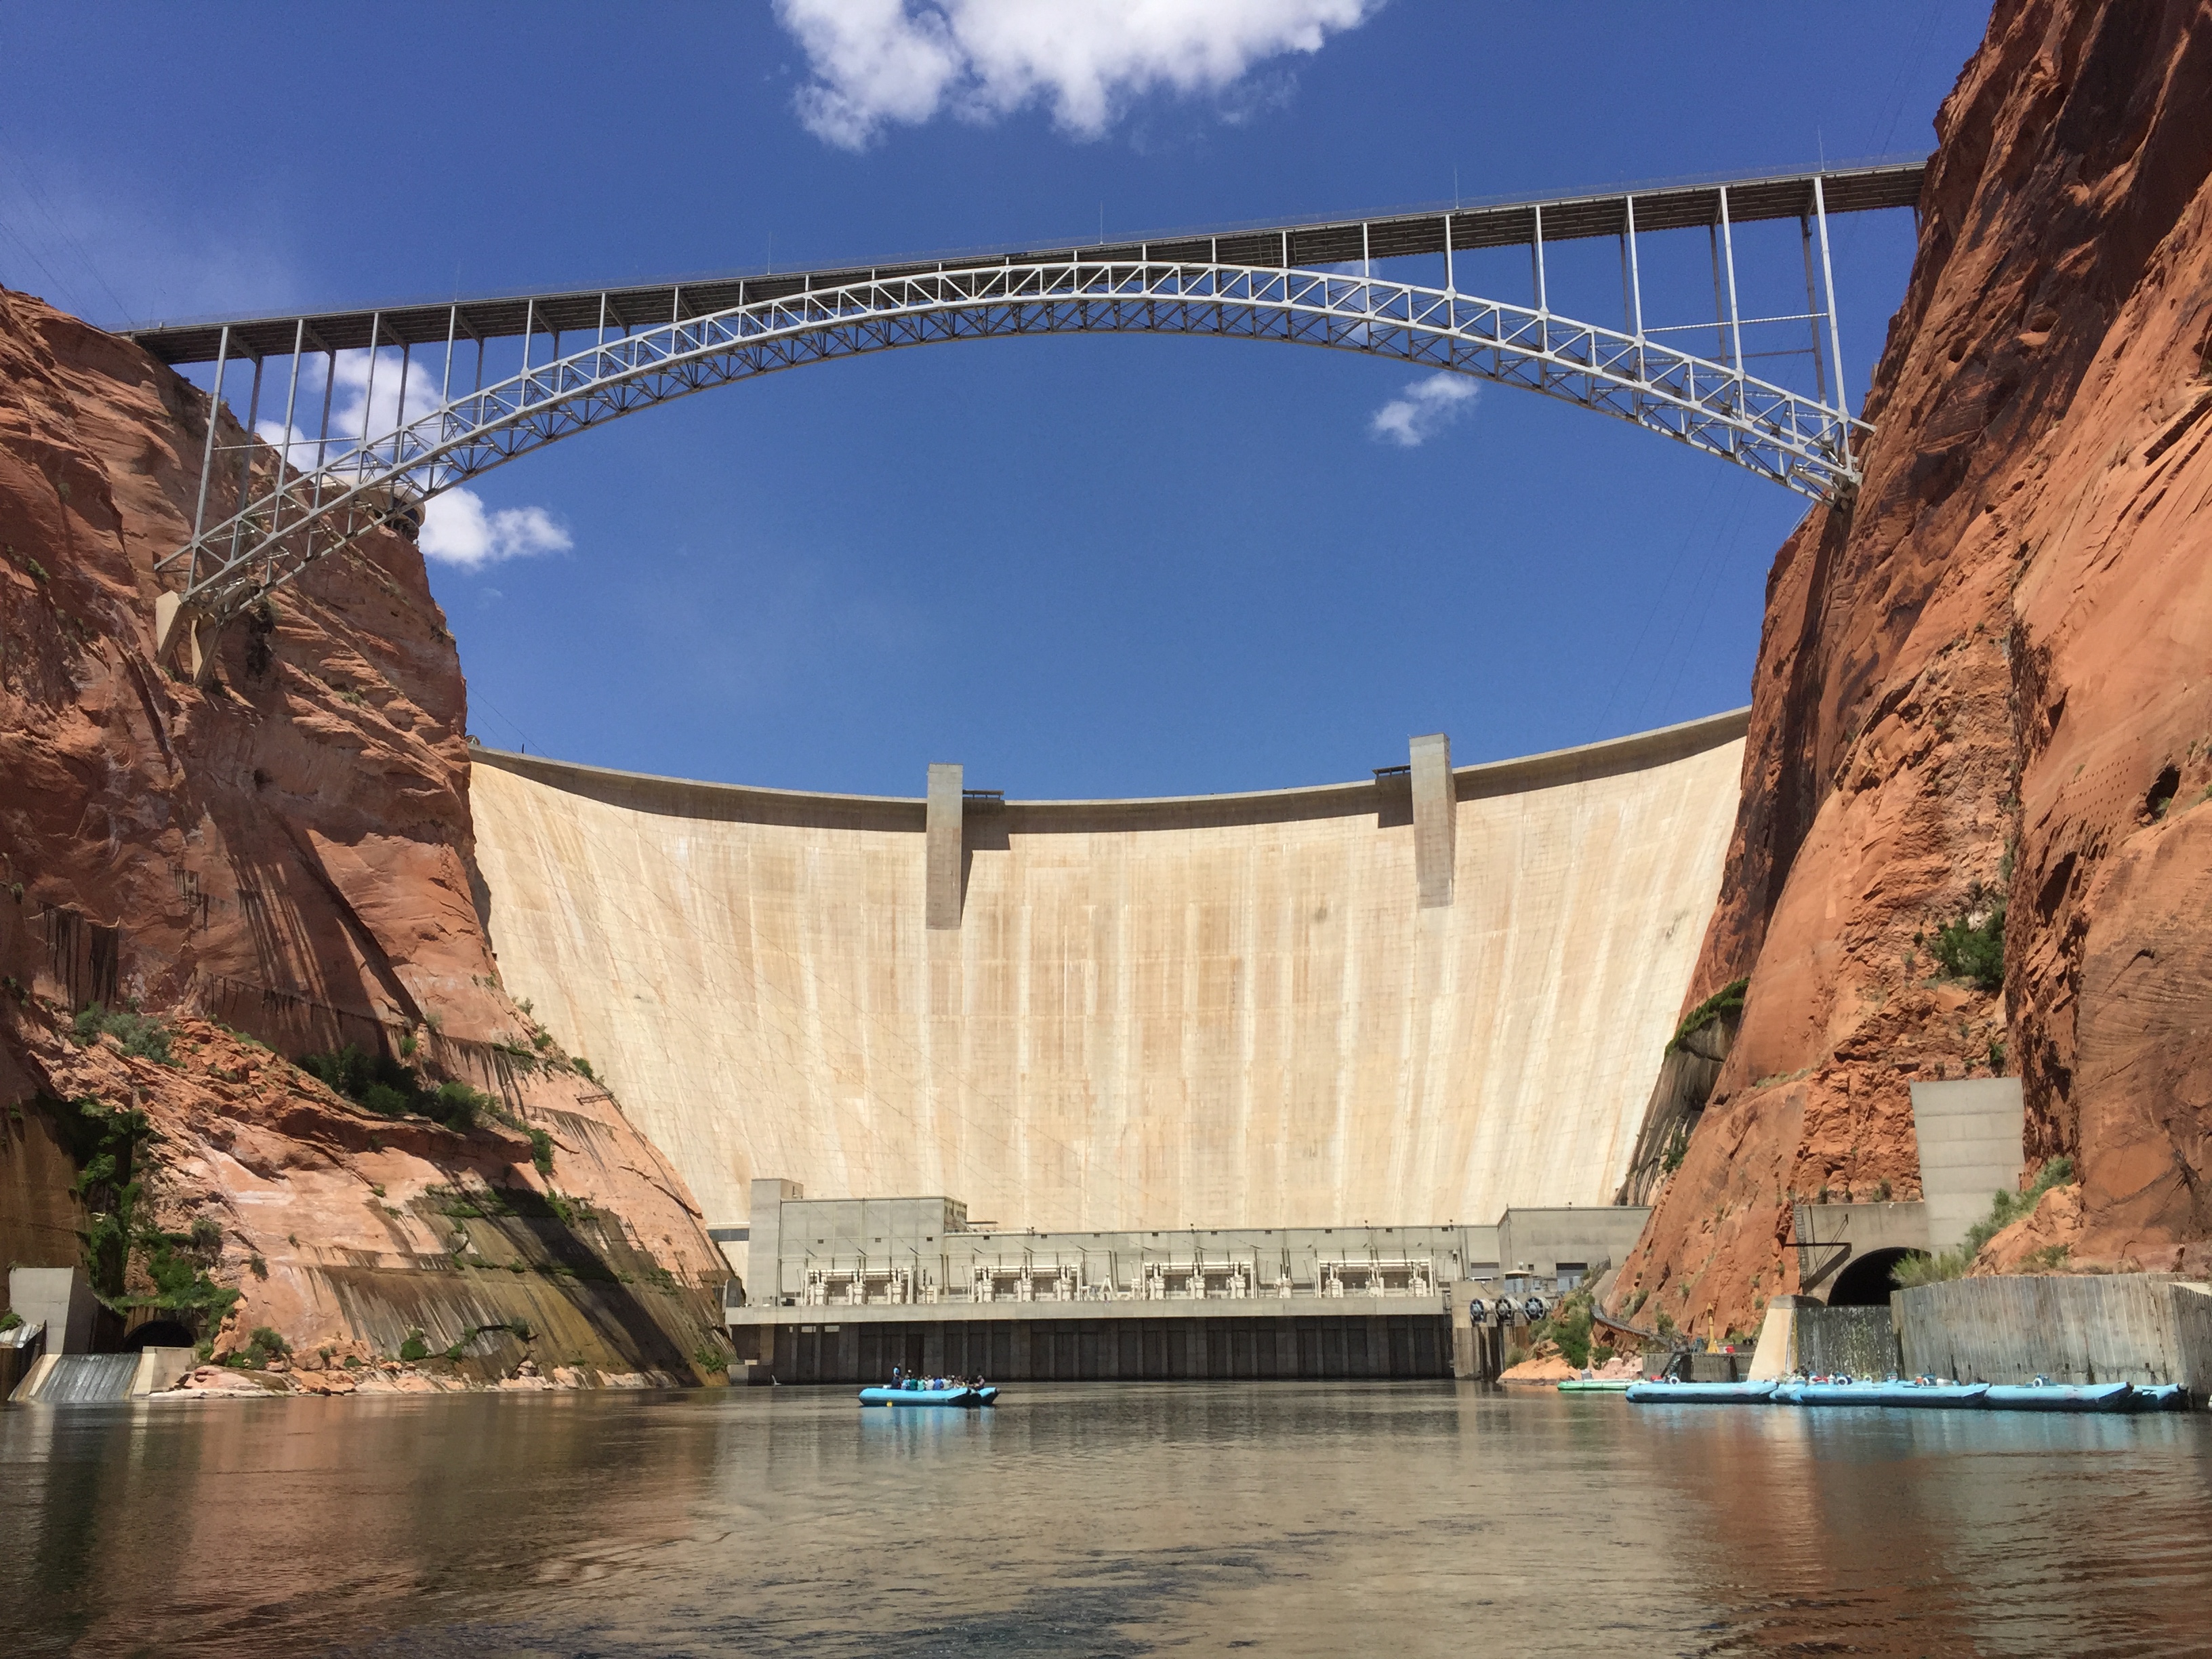
Glen Canyon Dam, Arizona, viewed from the Colorado River, approximately May 2017. Todd Wojtowicz / USGS, Public Domain. This is a conventional hydropower site, not a pumped-storage installation. Photo source
Below Glen Canyon Dam, the movement of water and sediment has changed. USGS has studied experiments that increase dam releases after tributaries deliver sand, seeking to rebuild sandbars. Those bars support river habitats and provide camping areas. The timing of a release, as well as its volume, affects the downstream landscape and the people using it. USGS high-flow experiments
Water supply also varies. In its mid-2025 electricity update, the IEA reported that Chinese hydropower generation fell 2.9% year-on-year in the first half of 2025 amid drought in Sichuan and Yunnan. Adding generating capacity and having water available when needed are separate conditions. IEA Electricity Mid-Year Update 2025
The deep-blue circles identify infrastructure that shifts electricity through time. The rivers around them continue towards rainfall and snow upstream, and towards habitats and communities downstream. On one map, the work of managing electricity's timing meets the work of managing water's timing.
Data and representation
Facilities: GEM Global Hydropower Tracker, March 2026. The 7,023 retrieved records include 4,927 operating facilities totalling 1,278,940 MW. Pumped-storage-only capacity is 196,116 MW / total operating capacity = 15.3%. Construction and planned projects combine construction, pre-construction and announced statuses: 689,830 MW of pumped storage / 1,115,664 MW overall = 61.8%. Combined conventional/pumped plants are not added to the pumped-only category. Plans are neither forecasts nor guarantees of completion.The main threshold is 30 MW. The previous edition used a different threshold, so changes in record counts are not plant additions. Cross-border facilities are counted once globally. Circle area is proportional to MW, not MWh, reservoir volume or generated electricity.
Rivers: HydroRIVERS v1.0, Strahler order 5 and above, simplified for display. Country borders are omitted; Natural Earth coastlines outline the land. The fixed river network is not a measure of flow or an inferred connection to individual plants. GEM: CC BY 4.0. HydroRIVERS: © World Wildlife Fund, Inc. (2006–2022), Lehner & Grill (2013), doi:10.1002/hyp.9740; integrated derivative display under the HydroSHEDS licence. Geography: Natural Earth, Public Domain. Editorial verification: 10 October 2026.
Sources
Author
SORAH Editorial
October 10, 2026