28.7% of the world’s seafloor is mapped to the target standard. The figure announced on 20 April 2026 opens a view of how we have measured the ocean—and how much remains to resolve.
28.7% of the world’s seafloor is mapped to the target standard. The figure announced on 20 April 2026 opens a view of how we have measured the ocean—and how much remains to resolve.
The ocean floor looks complete on a world map. Yet on 20 April 2026, the Nippon Foundation–GEBCO Seabed 2030 project reported mapping coverage of 28.7%. Around five million square kilometres had been added in a year; more than seven-tenths of the seabed still remained below the target standard. Seabed 2030 · Global mapping milestone, 20 April 2026
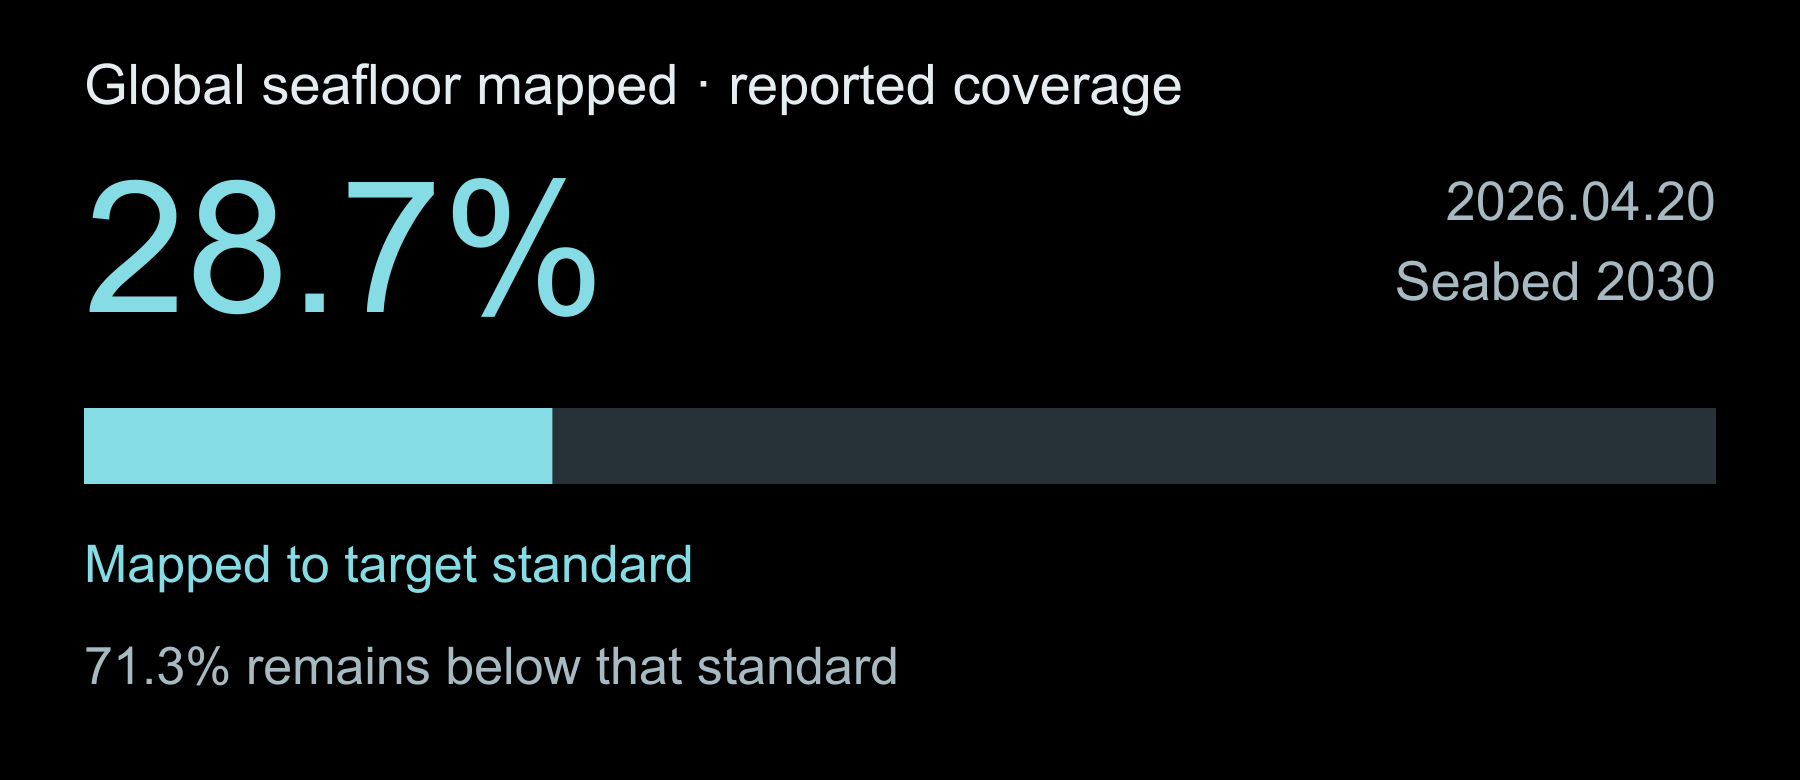
Official Seabed 2030 coverage. The remaining 71.3% is calculated as 100 minus 28.7; it does not mean no depth information exists. Seabed 2030 · Global mapping milestone, 20 April 2026
A continuous map can hide that difference. GEBCO combines measured depths with estimates guided by satellite-derived gravity and interpolation. Broad underwater relief can be visible even where detailed measurements are sparse. GEBCO_2026 Grid / Type Identifier
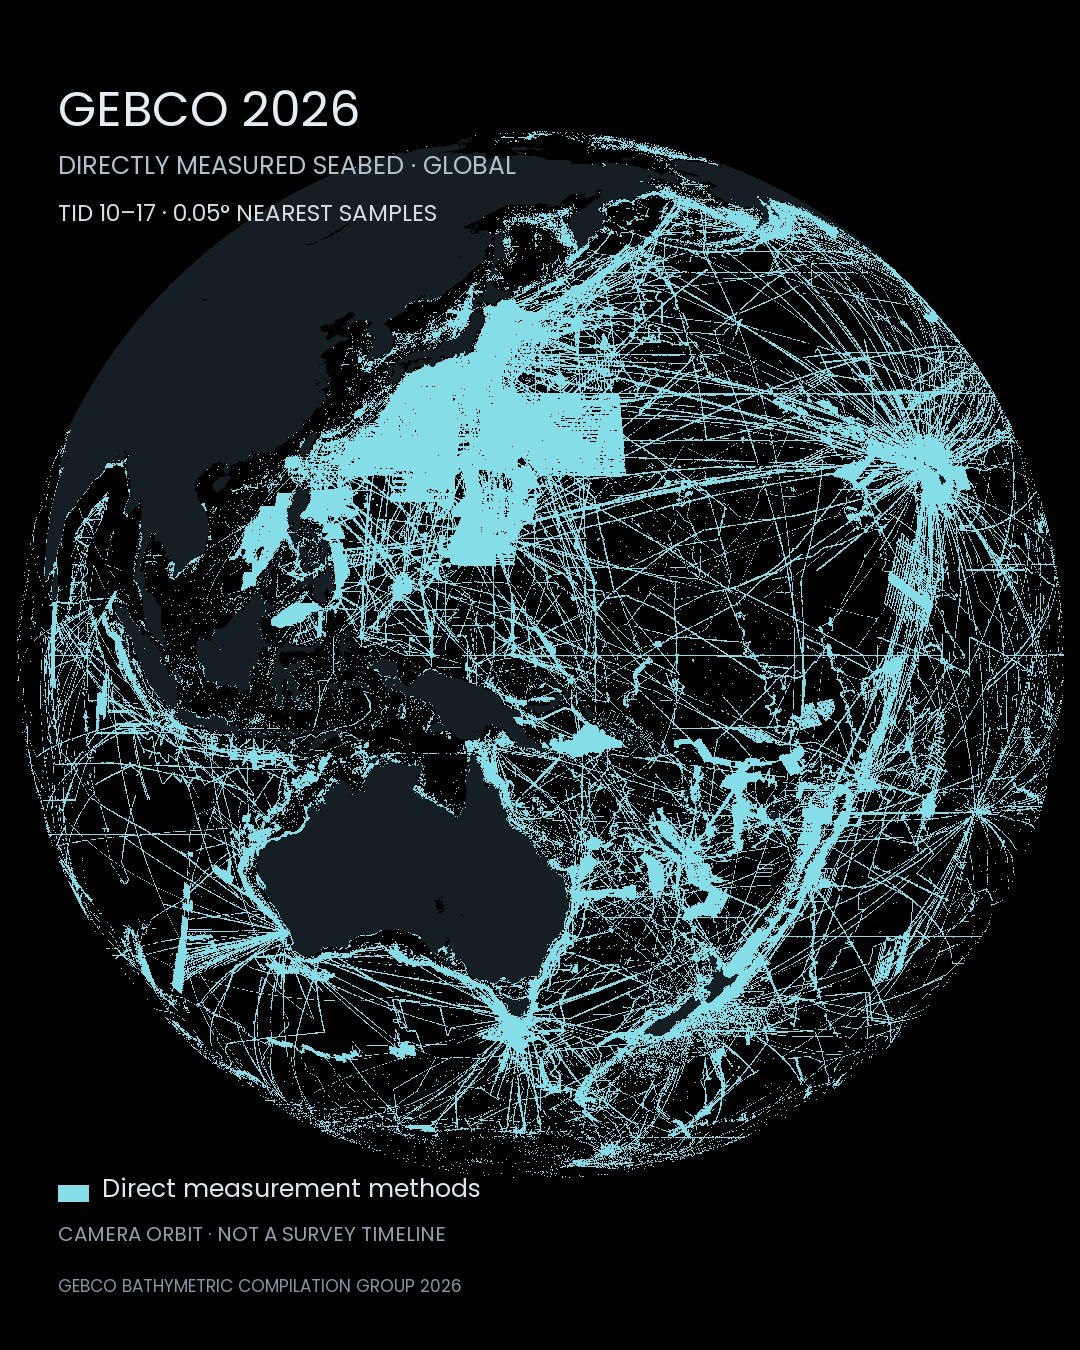
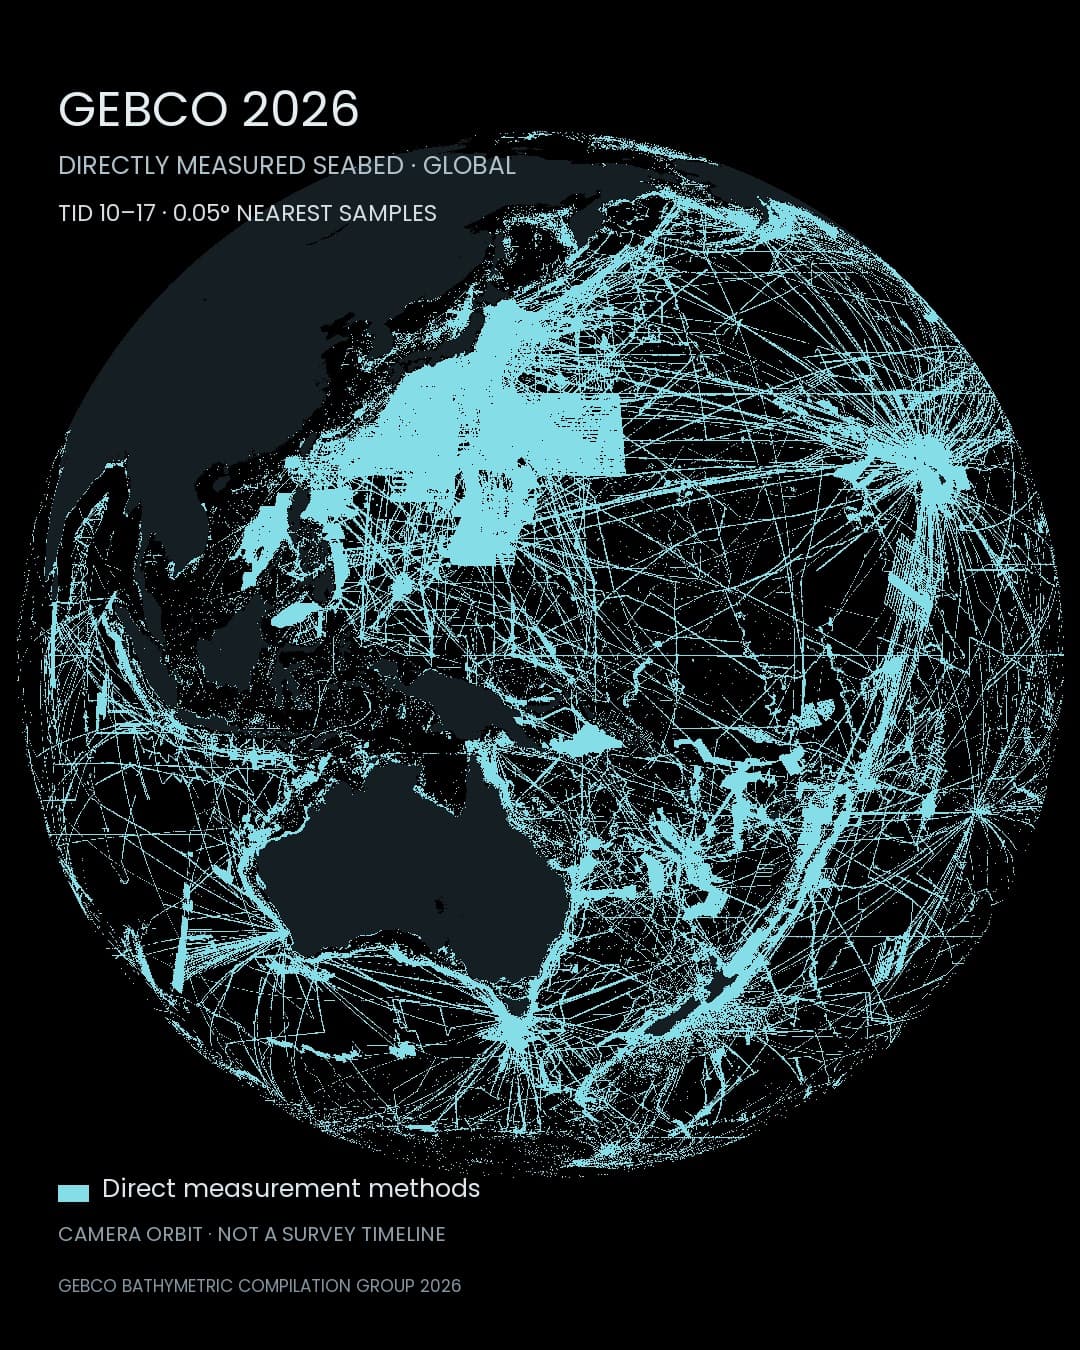
Direct-measurement source classes in GEBCO_2026, viewed from the Pacific. This classification has a different definition from the reported 28.7% coverage.
Which places have been surveyed?
Safe passage is one reason to measure: ports, approaches and coastal routes need reliable depths and hazards marked. NOAA’s survey priorities consider vessel traffic, known hazards and grounding records. Places altered by storms and currents can need repeat surveys, because an older depth may no longer describe the seabed. NOAA Office of Coast Survey · National Hydrographic Survey PrioritiesFarther offshore, surveys support discovery. NOAA’s mapping of the Blake Plateau off the southeastern United States, underway since 2011, revealed deep-sea coral mounds in places previously thought flat. Measuring the terrain also opens a way to understand its habitats. NOAA Ocean Exploration · Seafloor Mapping
On this globe, thin tracks across open water contrast with wider, brighter patches. Single-beam sounders sample beneath a vessel; multibeam systems cover swaths. These different footprints help explain the uneven pattern. A source-classification map alone, however, cannot identify the expedition or purpose behind each track. NOAA Ocean Exploration · Sonar
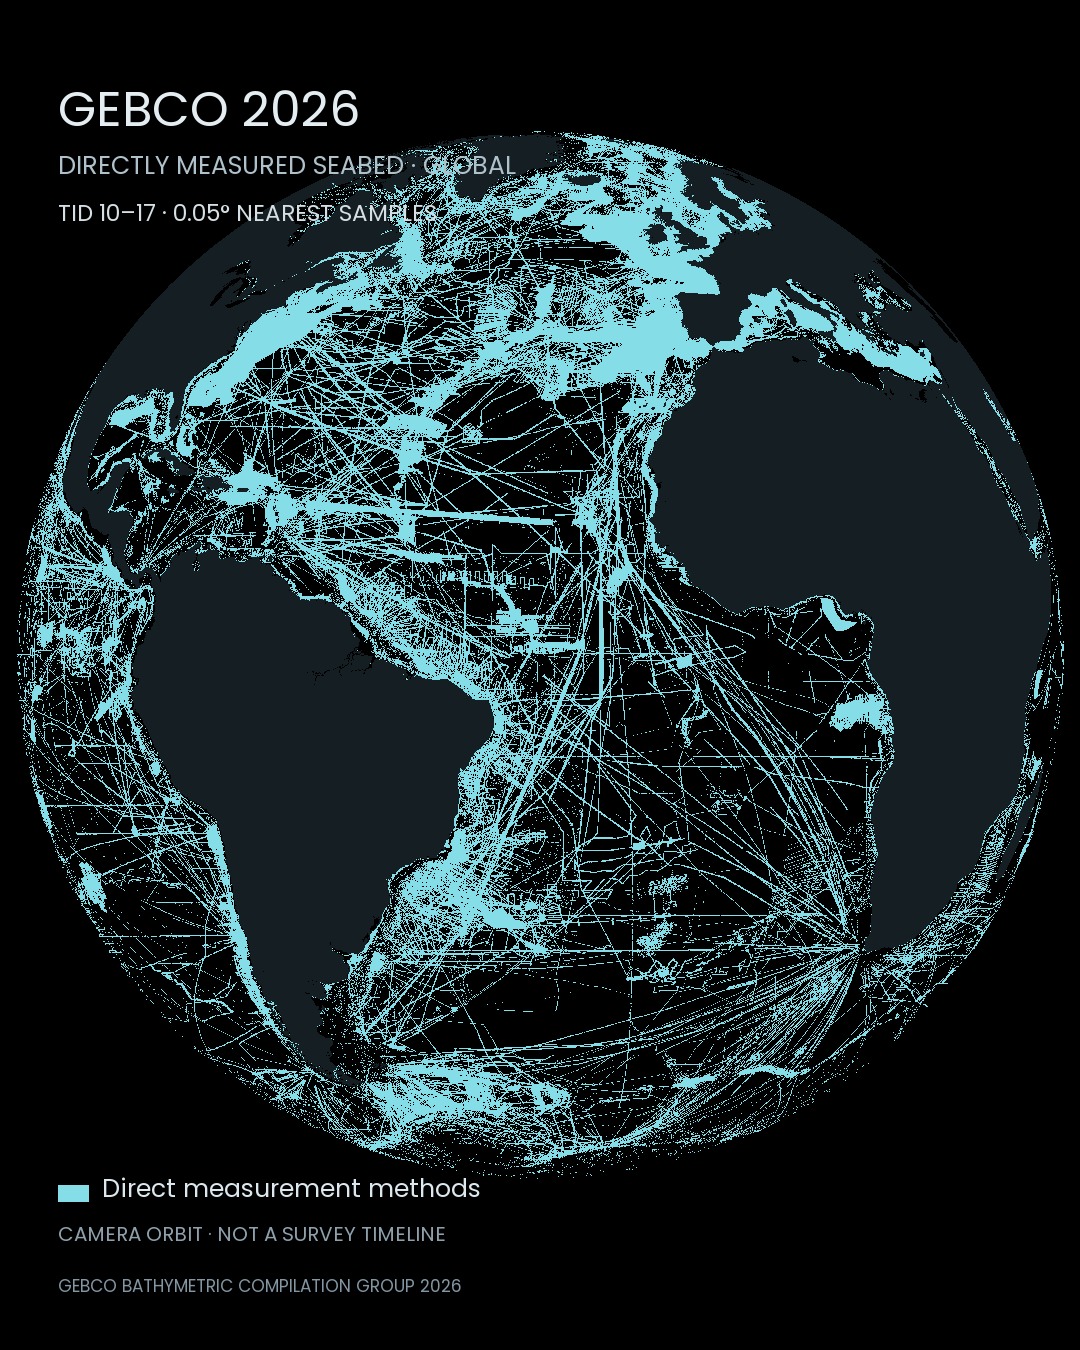
Looking toward the Atlantic. Lines and patches show the distribution of direct-measurement source classes; dark regions can still contain inferred or mixed data.
From a weighted line to a swath of sound
Early surveyors lowered marked, weighted lines by hand: each sounding gave one depth, leaving gaps between points. The U.S. Coast Survey began hydrographic soundings in 1834. By the 1930s, single-beam echo sounders were measuring beneath vessels; developments in the 1950s–70s brought multibeam systems that could cover an area. NOAA Office of Coast Survey · History of Hydrographic Surveying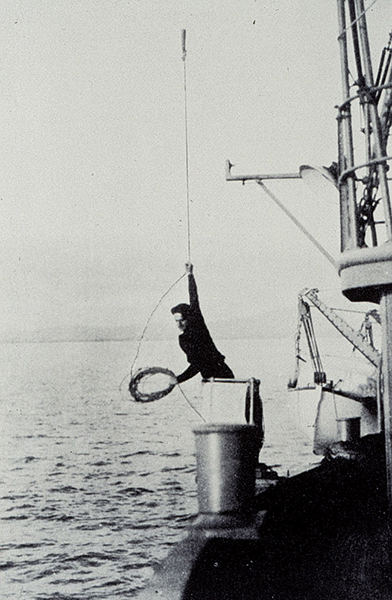
Casting a lead line for manual depth sounding. A historical photograph published by NOAA’s Office of Coast Survey; the source page does not identify its date or location. — NOAA / Office of Coast Survey · Public domain · original, unmodified
Today, shipboard teams inspect acoustic returns on screens and turn them into maps. Wider coverage still takes ship time, particularly in remote waters. The global picture continues to grow one survey at a time. NOAA Ocean Exploration · Seafloor Mapping NOAA Ocean Exploration · Sonar
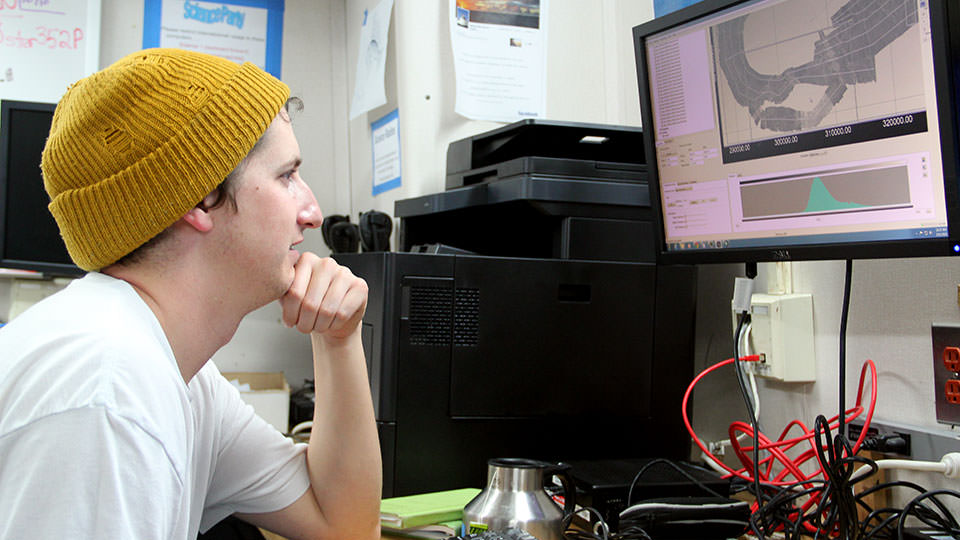
During the 2015 U.S. Virgin Islands expedition aboard NOAA Ship Nancy Foster, acoustic mapping specialist Will Sauter interprets multibeam sonar backscatter. — NOAA / National Ocean Service · NOAA reuse terms
The frontier beyond 28.7%
Progress comes both from new surveys and from sharing existing measurements. An area added to the 2026 compilation was not necessarily surveyed during the previous year. Seabed 2030 · Global mapping milestone, 20 April 202628.7% asks how much more of the ocean floor we can bring into focus. A safer passage and a newly visible deep-sea habitat both begin with measuring. Earth’s frontier is not only beyond the edges of our maps. It continues beneath seas whose names we already know.
Data and representation
28.7% is Seabed 2030’s reported coverage at its target standard, announced 20 April 2026. 71.3% is 100−28.7, not a fraction with no information or no exploration. The globe uses a different measure: GEBCO_2026 TID classes 10–17 denote direct methods; 11 denotes multibeam. The original 15-arcsecond classification is sampled at 0.05° using nearest neighbours. No coverage rate is calculated from rendered pixels. Inferred, mixed and unknown classes remain dark; fine tracks may be lost. Rotation changes viewpoint, not survey date, and a grid edition year is not a measurement year. Not for navigation.Sources
Author
SORAH Editorial
October 5, 2026