Published on 05/October/2026 · Ocean
Hormuz: the passage that has powered the world.
By SORAH Editorial
Place the Strait of Hormuz at the centre of the globe. Ship observations and crude-oil destinations from 2025 show how a small passage reaches into distant lives.
Place the Strait of Hormuz at the centre of the globe. Ship observations and crude-oil destinations from 2025 show how a small passage reaches into distant lives.
Disrupted passage through Hormuz reaches far beyond nearby shipping lanes. It changes fuel costs, the choices available to power stations and the conditions in which factories operate. To understand the worldwide effects of the constraints seen in 2026, this visualization first looks back at the passage’s role in 2025. IEA · Oil markets and the Middle East supply shortfall, 18 September 2026 IEA · Coal demand outlook, 10 September 2026
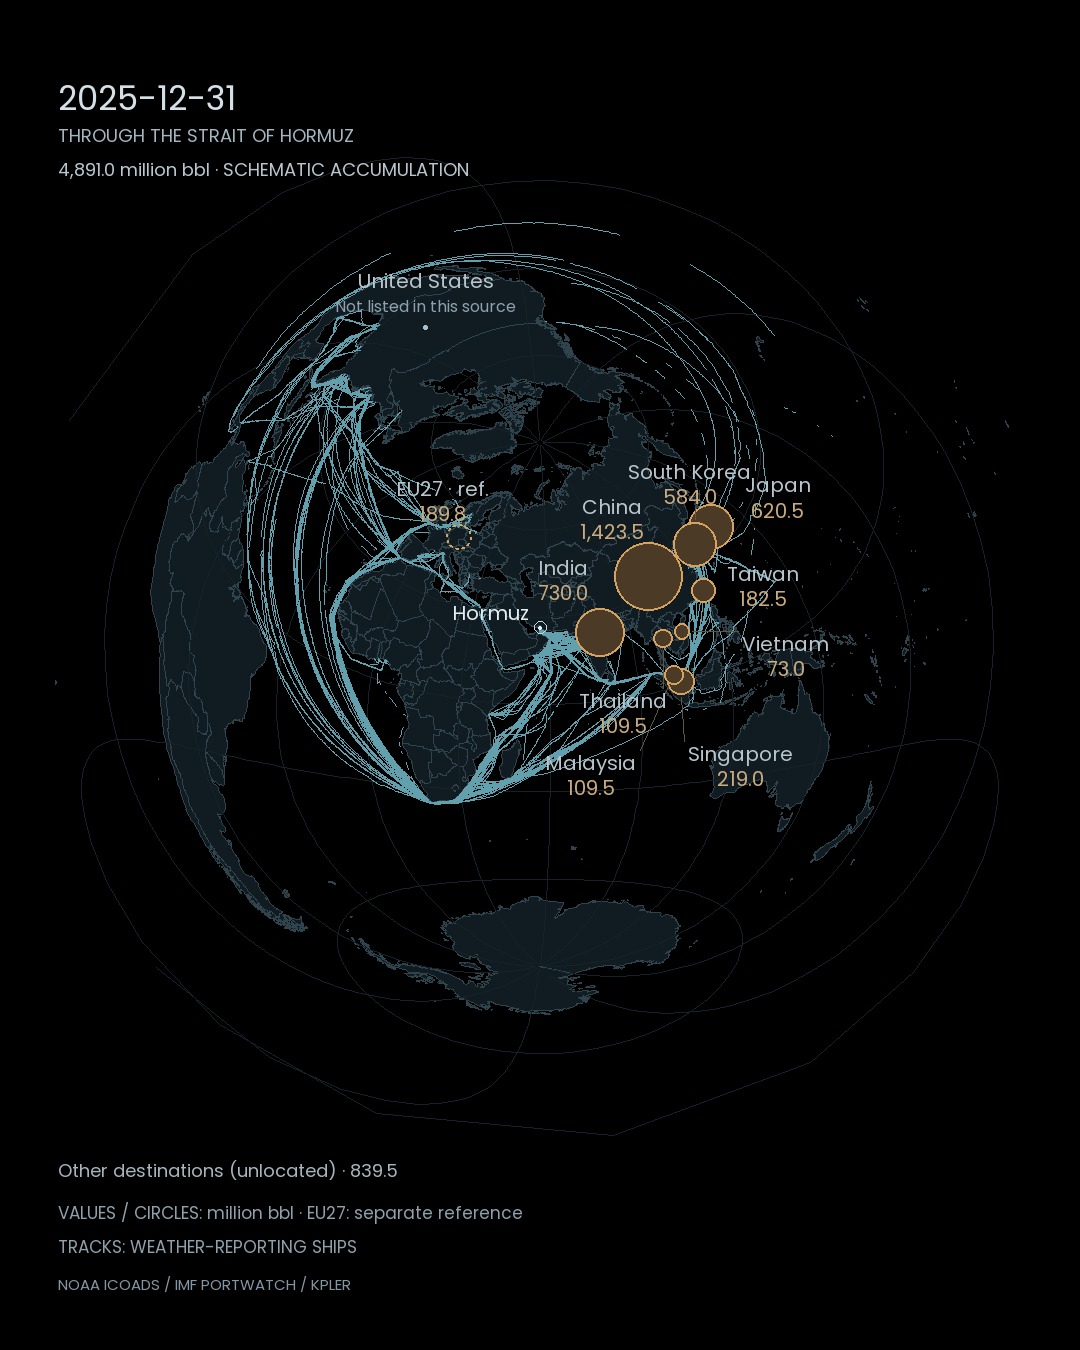
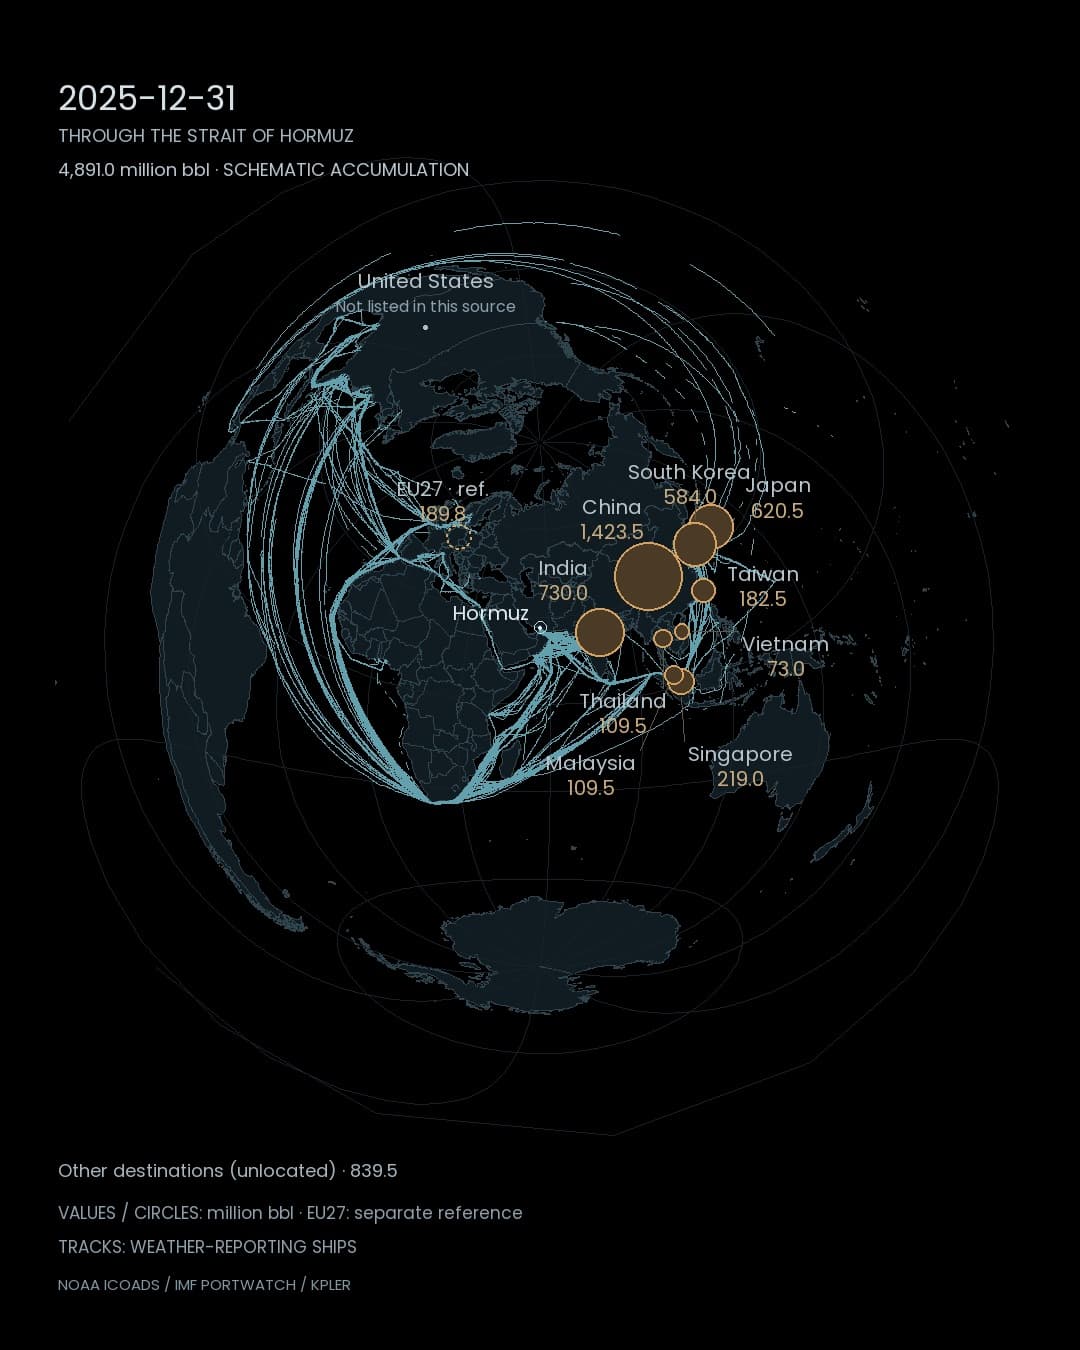
The full year 2025. Lines are weather-report ship tracks; circle areas show independent annual crude-oil statistics. The tracks do not identify the ships carrying that oil.
Move the centre of the map
The video uses an azimuthal equidistant projection centred on Hormuz. It preserves direction and distance from the centre, bringing distant places around one passage. Shapes and distances elsewhere on the map are distorted.Cyan lines come from ship positions in NOAA’s International Comprehensive Ocean–Atmosphere Data Set, ICOADS. The selection contains 34 identifiers and 55 departures in 2025. It is a sample of weather-report ships, not all commercial shipping. Missing observations interrupt tracks; their ends do not establish arrival ports or cargo. NOAA NCEI · ICOADS
Passages and cargo are different measures
A separate AIS series from the UN Global Platform and IMF PortWatch records 31,218 passages by the covered commercial vessels in both directions during 2025, including 17,585 tanker passages. Repeat transits count again; these are not unique-vessel totals. IMF PortWatch / UN Global Platform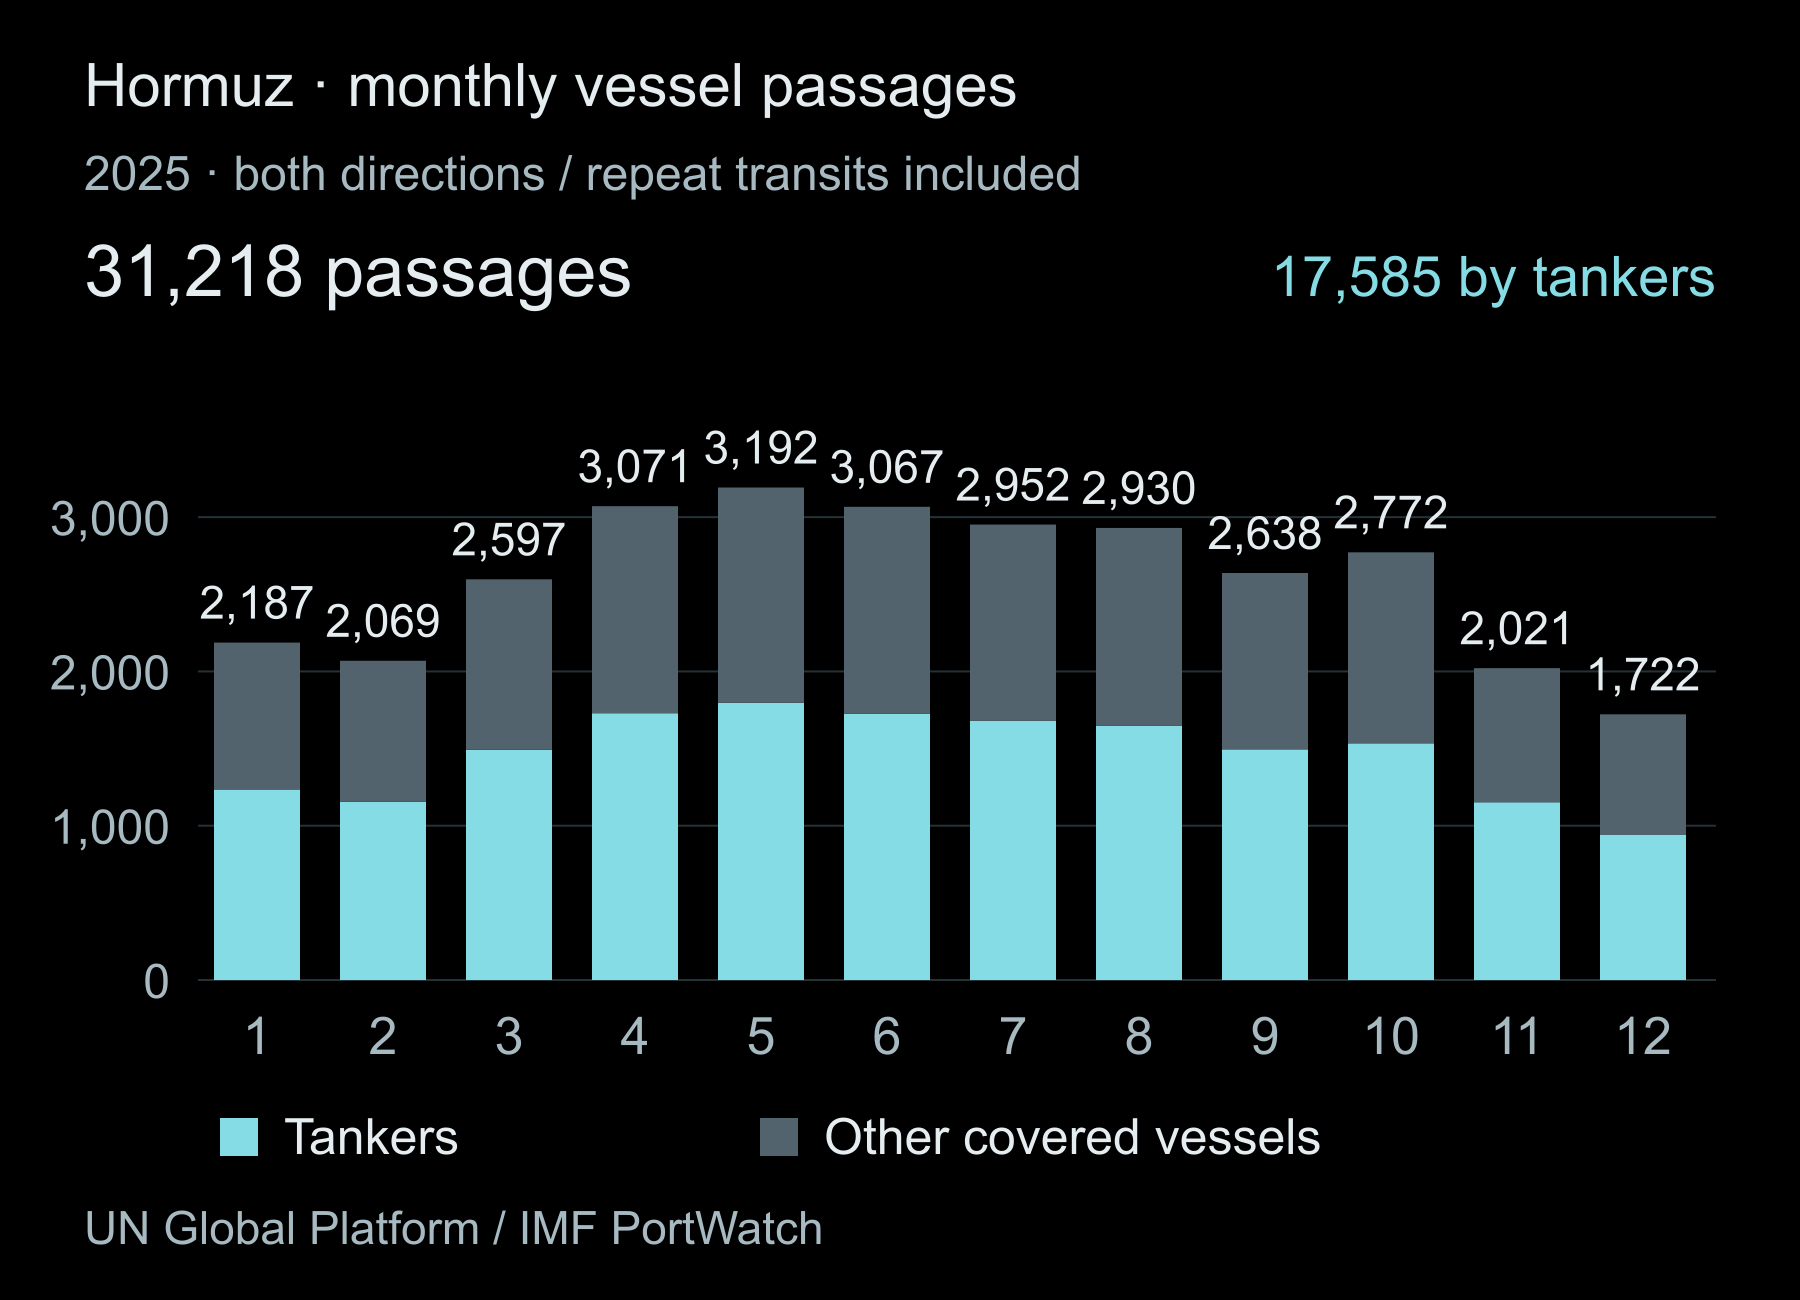
Monthly passages in 2025. Totals appear above the bars; cyan marks tankers. Both directions and repeat transits are included. IMF PortWatch / UN Global Platform
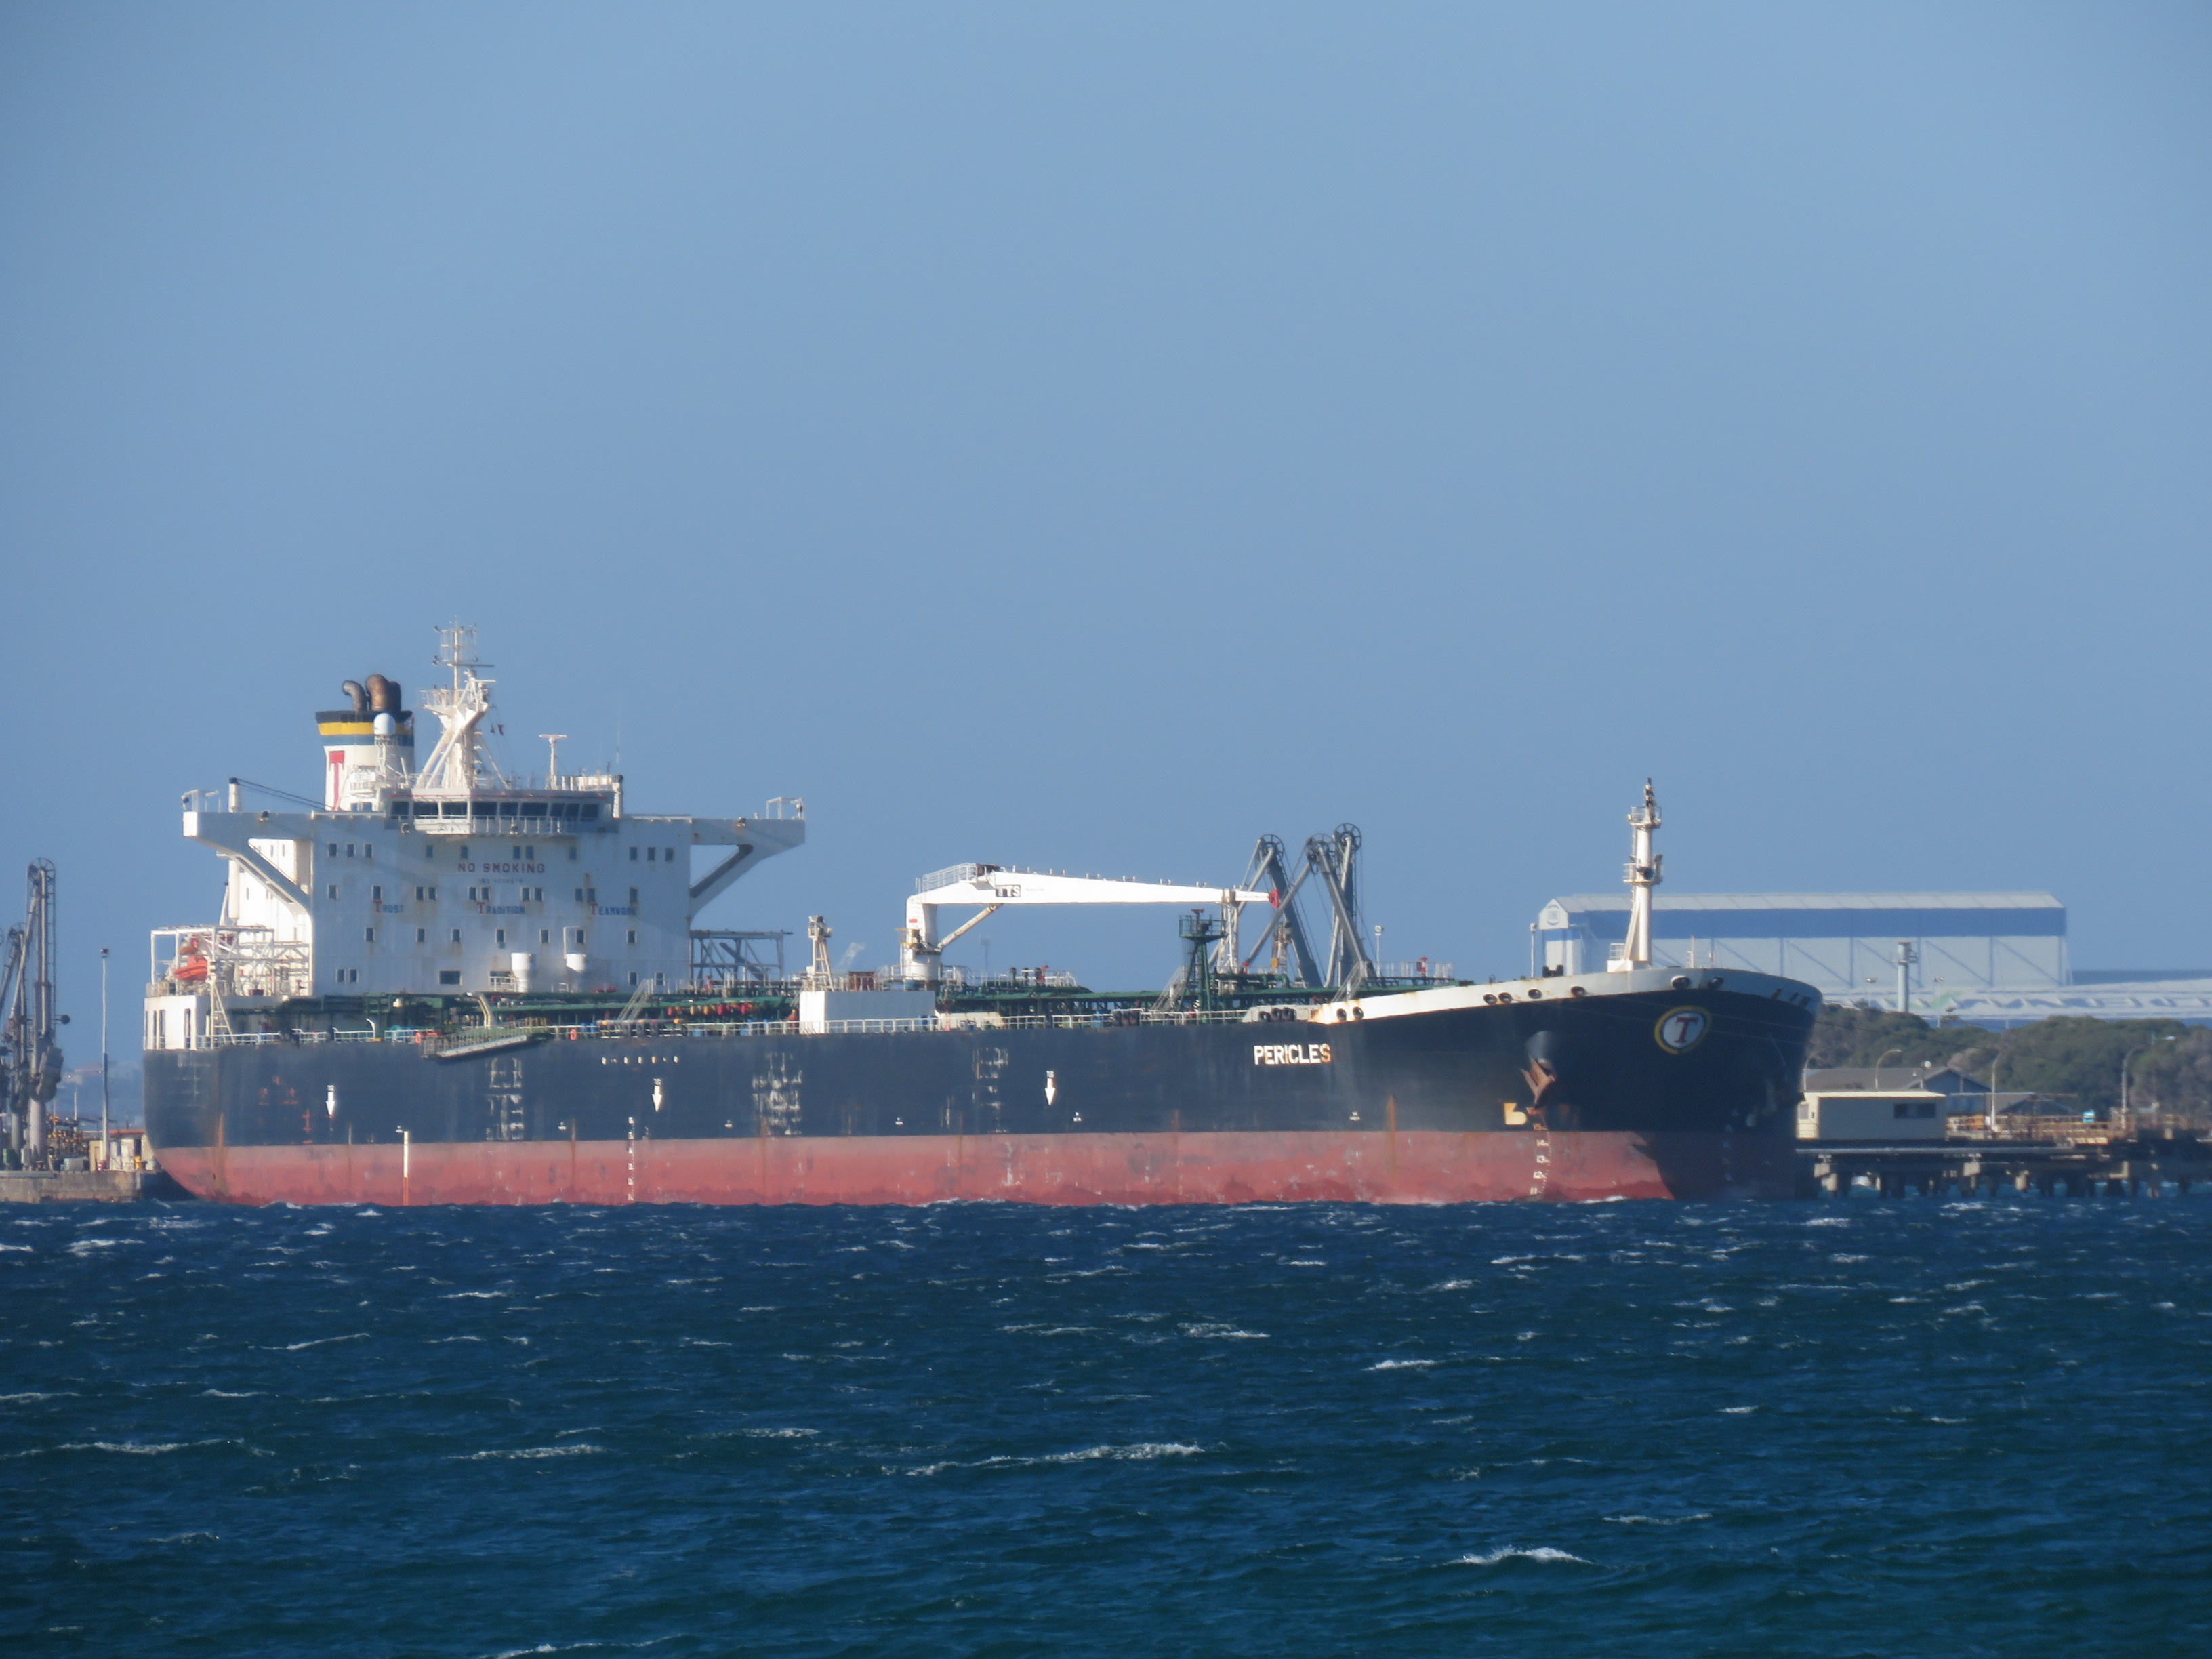
The crude-oil tanker Pericles at a refinery jetty in Kwinana, Western Australia, on 26 December 2020. An illustrative tanker photograph, not an identification of a vessel in the plotted tracks. — Calistemon / Wikimedia Commons · CC BY-SA 4.0 · original, unmodified
Annualizing the crude-oil destination estimates gives approximately 4.891 billion barrels overall: 1.424 billion to China, 730 million to India and 621 million to Japan. Circle area represents those annual quantities. The tracks and circles provide different views of the same passage, without linking a particular vessel to a shipment. Maybank · Gulf War: Assessing the Fallout, 20 March 2026, Fig. 3 Oxford Institute for Energy Studies · Europe’s oil vulnerability, April 2026
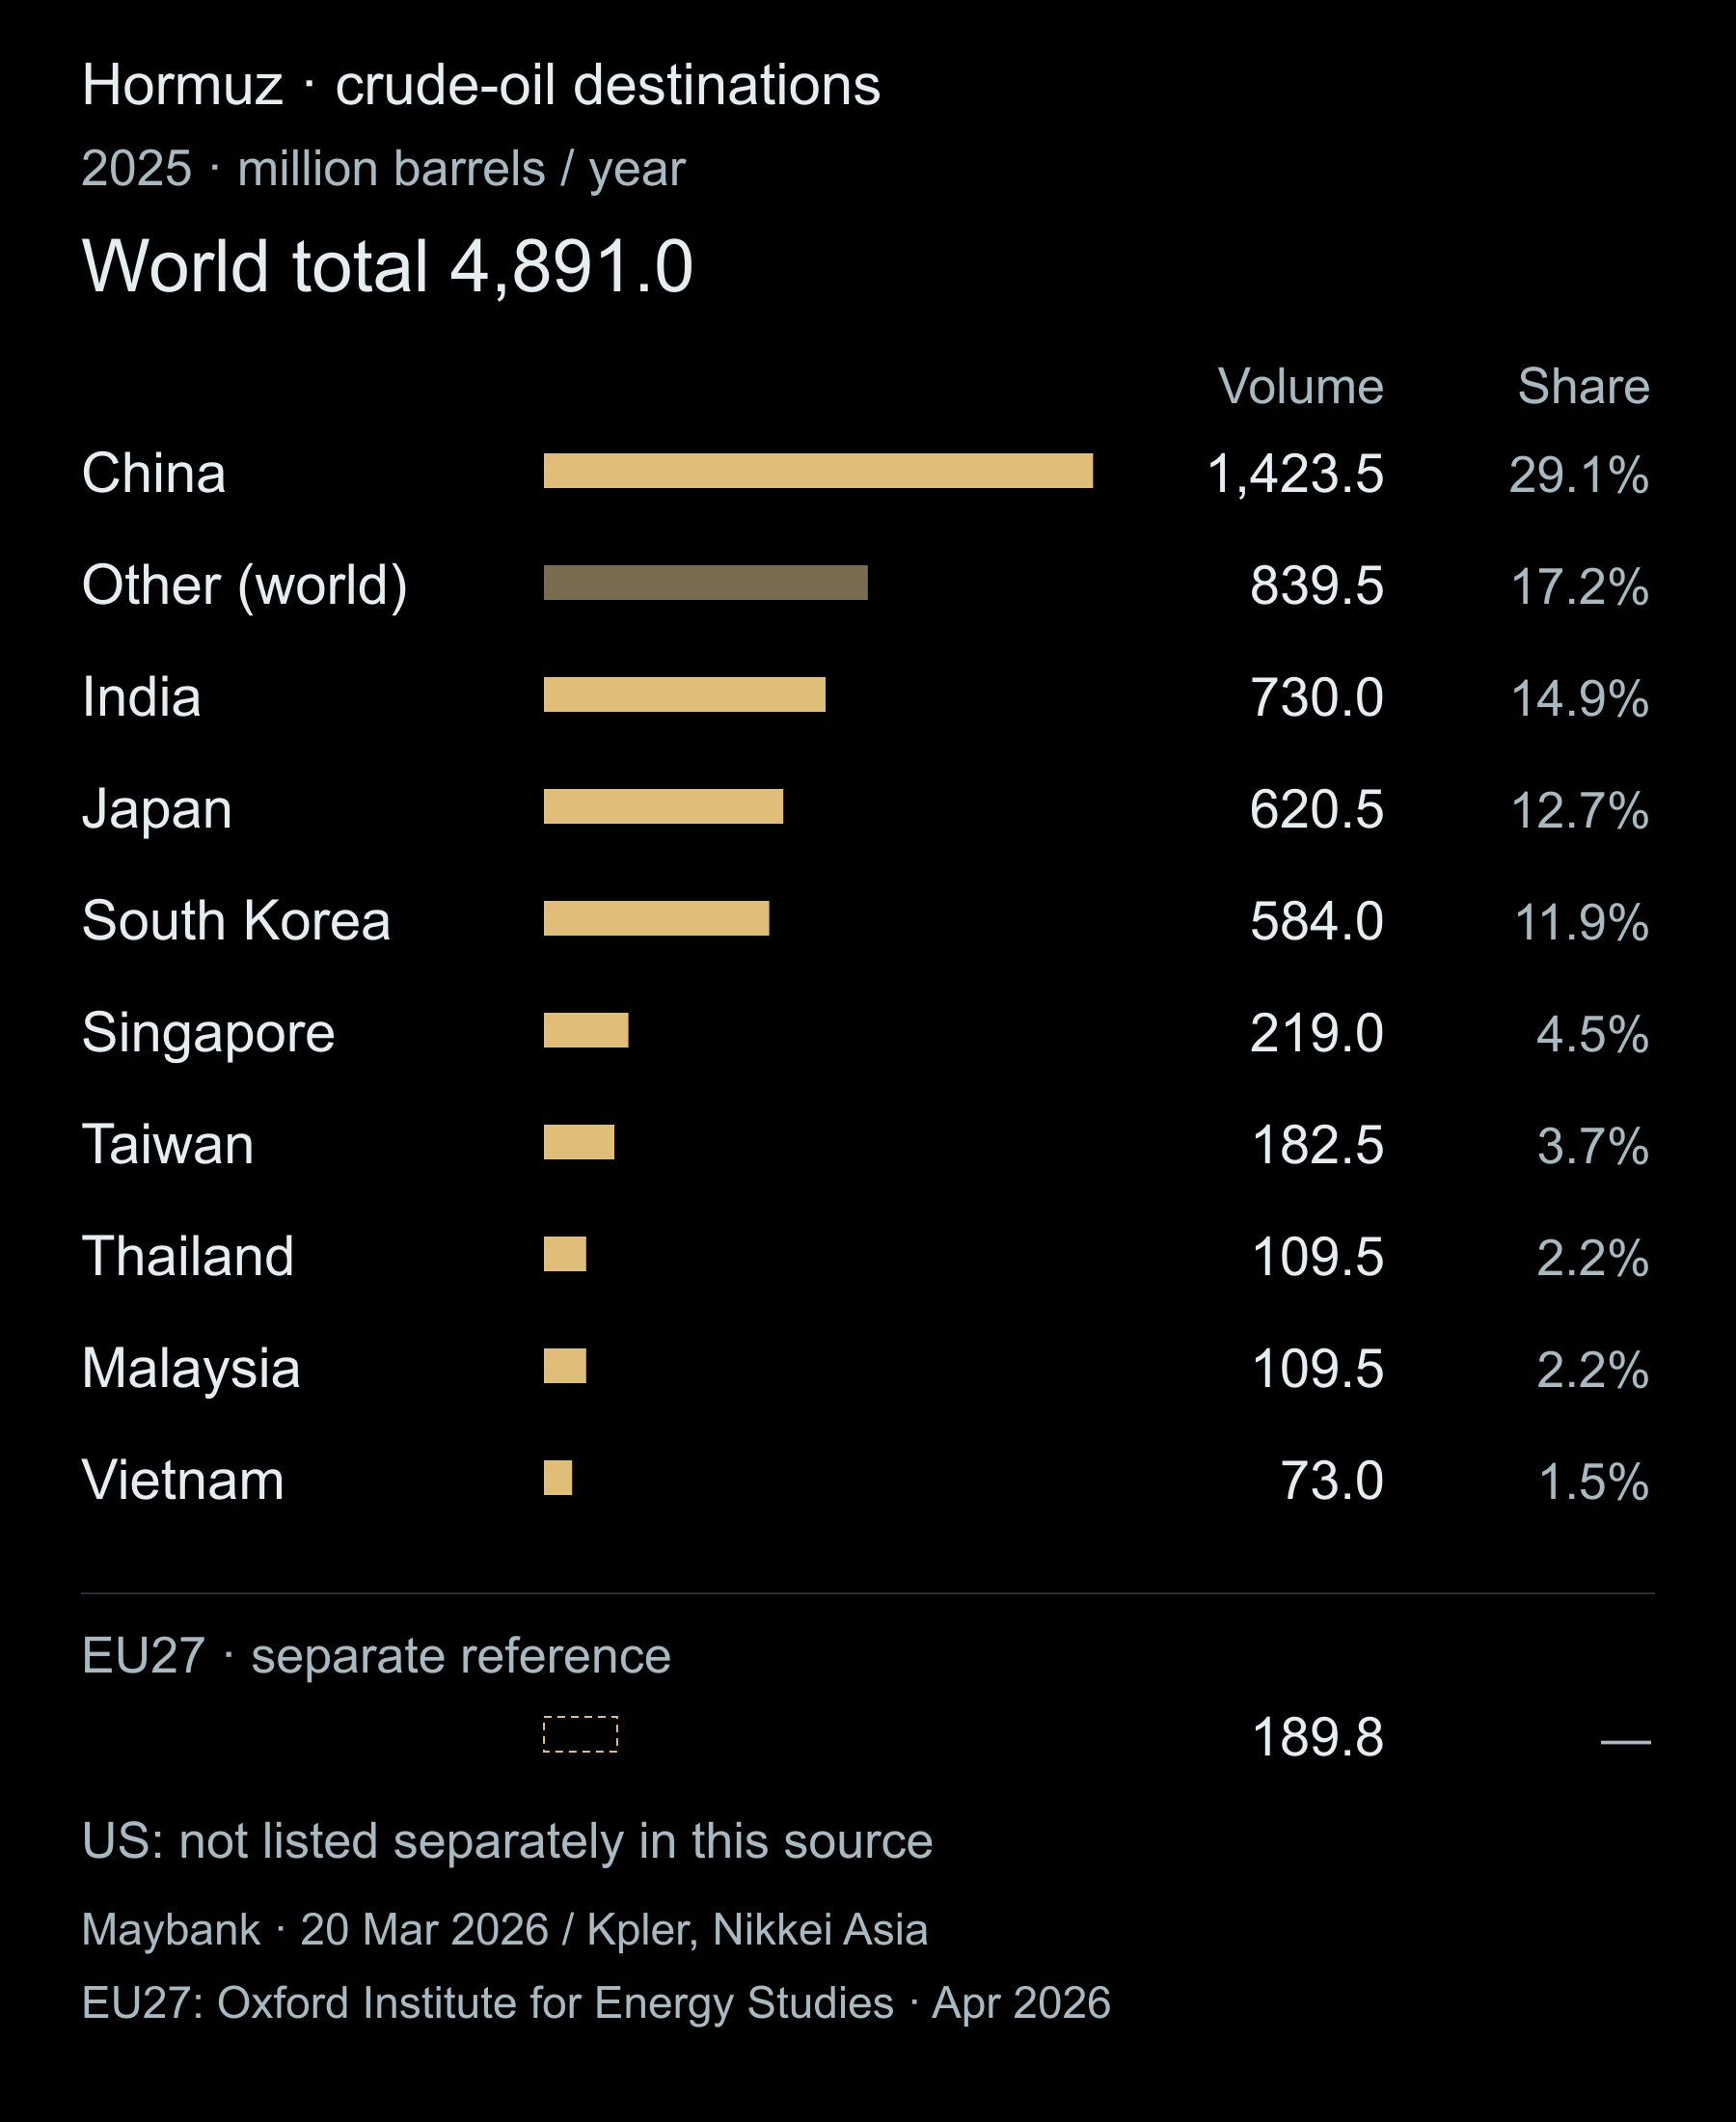
Annualized daily averages ×365. Shares use the world total; Other is the worldwide residual without a published breakdown. EU27 is a separate reference, excluded from the total and shares. Maybank · Gulf War: Assessing the Fallout, 20 March 2026, Fig. 3 Oxford Institute for Energy Studies · Europe’s oil vulnerability, April 2026
The Maybank report of 20 March 2026 (Figure 3, citing Kpler / Nikkei Asia), used for the country-level crude-oil figures, does not list a separate US value. The map therefore says “Not listed in this source.” This does not mean zero imports or that no US statistics are publicly available. Maybank · Gulf War: Assessing the Fallout, 20 March 2026, Fig. 3
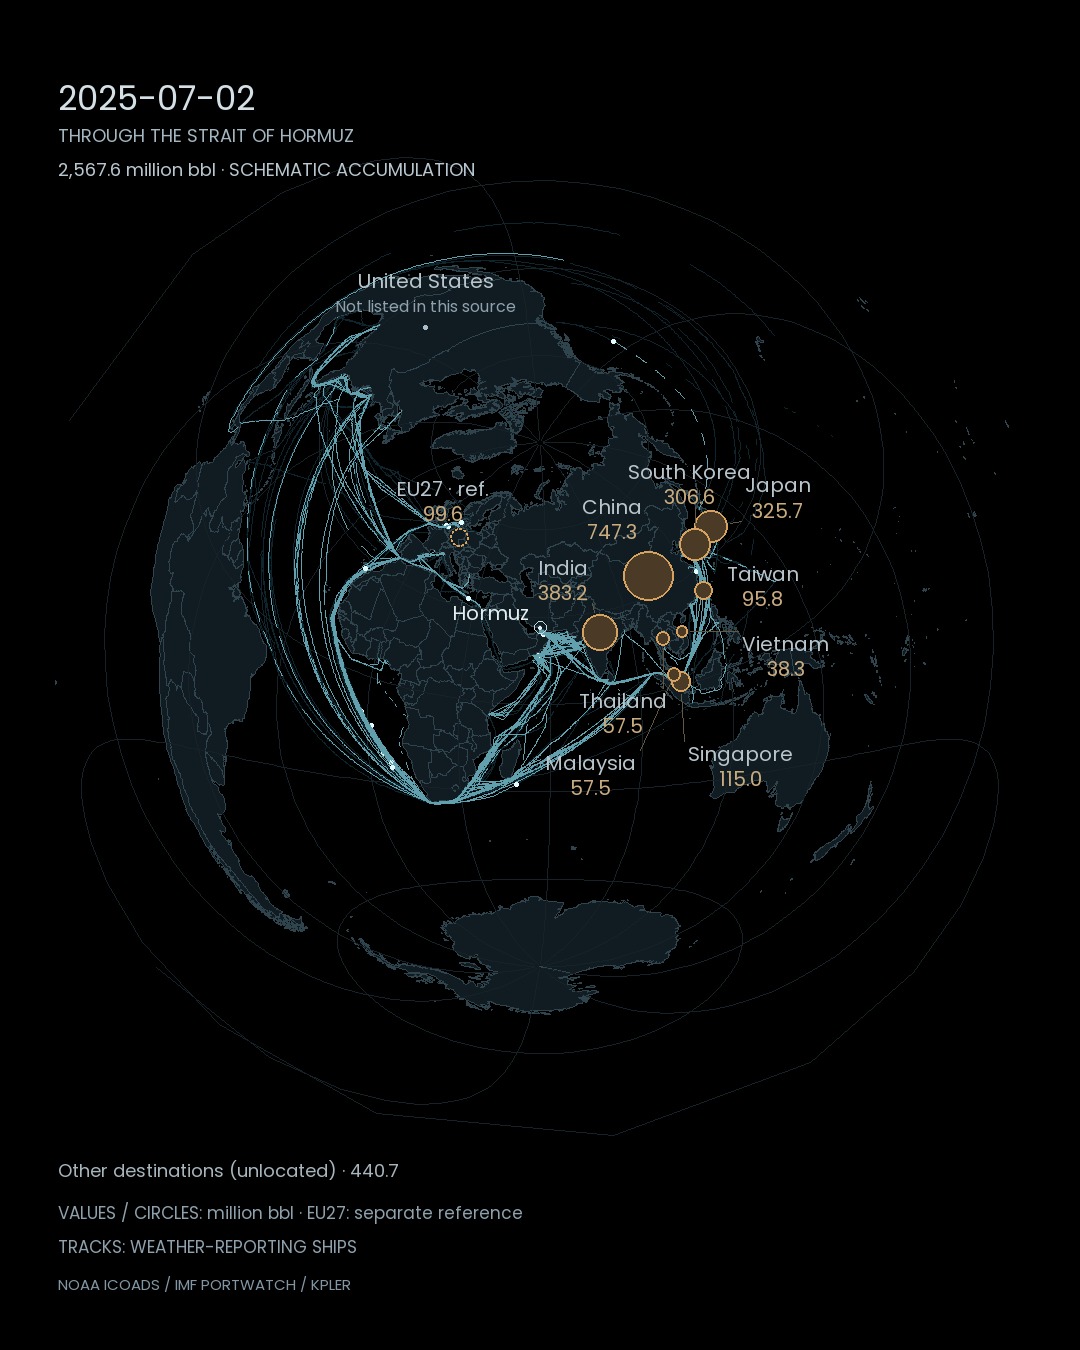
Oil accumulation is schematic: annual totals are allocated using monthly tanker-passage weights.
A constrained passage changes the world’s fuel choices
An IEA analysis published on 18 September 2026 put August oil flows through Hormuz at about 7.6 million barrels per day, provisionally 13.1 million below pre-war levels. Bypass routes, production outside the Gulf and stock releases offset part of the shortfall. Supply remained constrained, and renewed upward pressure on oil and product prices was evident in September. IEA · Oil markets and the Middle East supply shortfall, 18 September 2026Even fuels that barely use the strait are affected. On 10 September, the IEA reported that reduced LNG shipments and higher gas prices were encouraging a switch to available coal-fired capacity, including in Europe, Japan, Korea and China. It forecast global coal demand rising 1.2% in 2026. This is an annual forecast, not a measured coal-use share; weather-related cooling demand and hydropower changes also influence the outlook. IEA · Coal demand outlook, 10 September 2026
The tracks on the 2025 map followed sea lanes that carried energy into everyday life. When that flow narrows, choices at distant power stations and factories can change with it. The passage has supported much more than the movement of ships: it has helped determine how places far beyond the Gulf keep running.
Data and representation
2025 ICOADS weather-report ship positions. Tracks break across gaps over 6 hours, speeds over 50 knots or land intersections; positions between observations are interpolated for playback. AIS passage counts are independent. Crude-oil estimates use Kpler / Nikkei Asia via Maybank: daily averages ×365. Animated accumulation uses monthly tanker-passage weights and a constant within-month rate, not observed shipment timing. EU27 is a separate OIES reference of about 190 million barrels per year, neither added to the total nor deducted from other destinations. The article’s current context uses IEA releases of 10 and 18 September 2026, distinct from the 2025 visualization. Unspecified destinations are not assigned to countries.Sources
- IEA · Oil markets and the Middle East supply shortfall, 18 September 2026
- IEA · Coal demand outlook, 10 September 2026
- NOAA NCEI · ICOADS
- IMF PortWatch / UN Global Platform
- Maybank · Gulf War: Assessing the Fallout, 20 March 2026, Fig. 3
- Oxford Institute for Energy Studies · Europe’s oil vulnerability, April 2026
Author
SORAH Editorial
October 5, 2026