Published on 04/October/2026 · Technology
The satellites around Earth, and the lives beneath them.
By SORAH Editorial
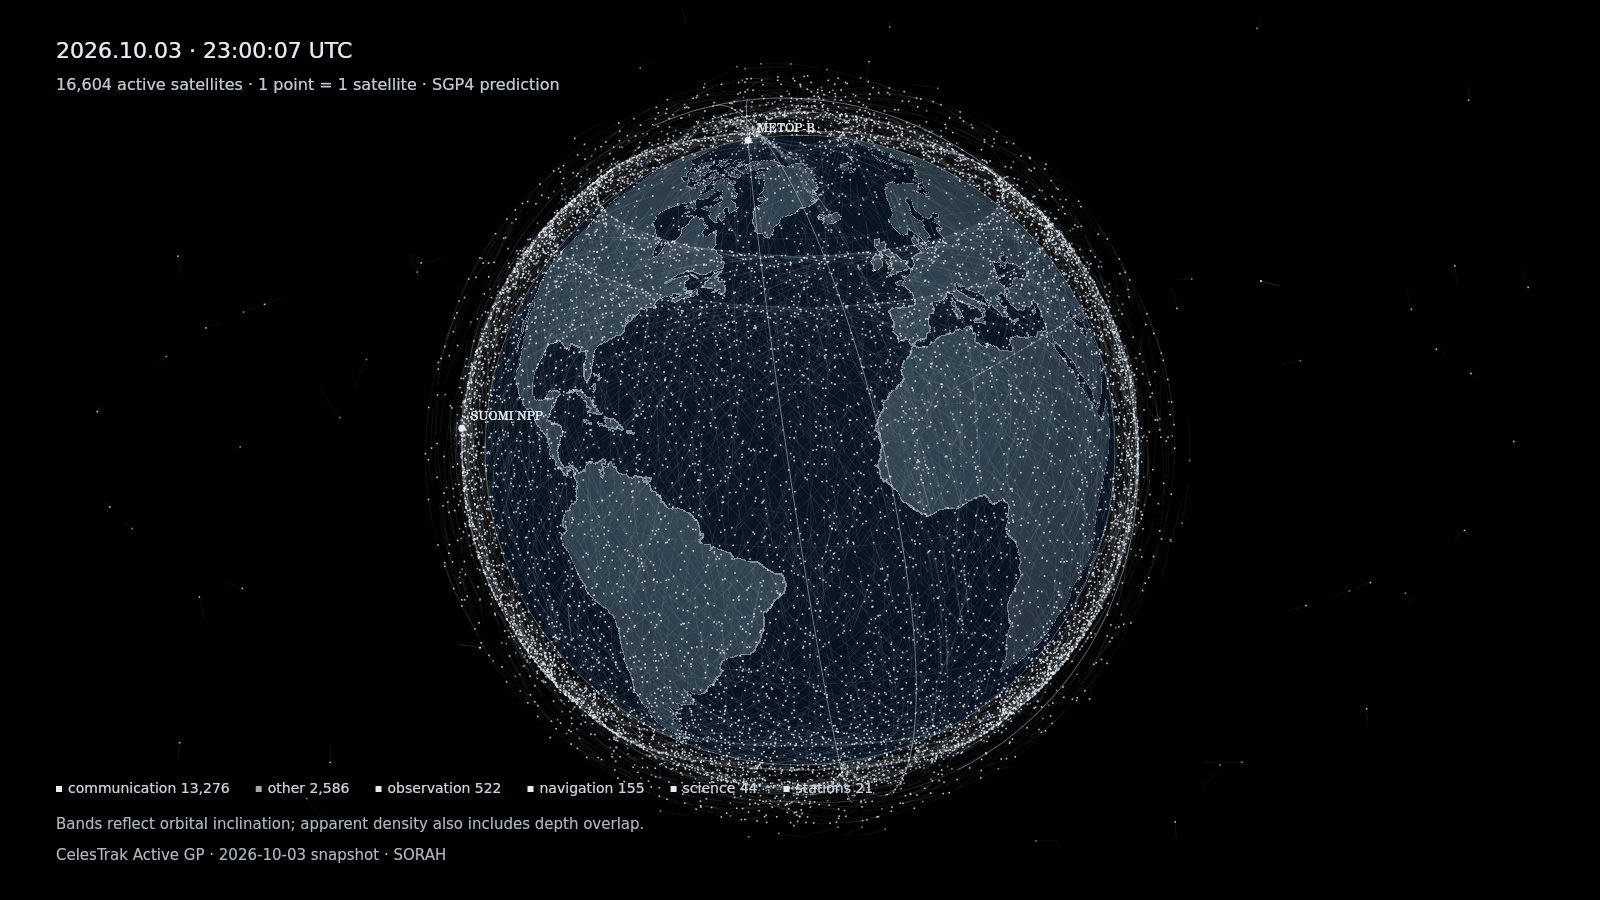
Communication, weather and location: part of the information we use on the ground arrives from infrastructure beyond Earth. Predicted positions of 16,604 satellites bring that surrounding space into view.
According to European Space Agency figures updated on 31 July 2026, about 18,840 satellites launched into Earth orbit remain in space, including about 15,900 still functioning.[5] Communication, weather and location: part of the information we use on the ground arrives from this infrastructure beyond Earth.
One point per satellite: predicted positions of 16,604 included satellites, 22:00–00:00 UTC, 3–4 October 2026. Some higher orbits fall outside the initial frame. Trails show the preceding two minutes, not coverage.
Infrastructure above the ground
Points pass over Japan and out across the Pacific; others head south above Africa. Seen from farther away, the space around the continents becomes another place people use. The visualization includes 16,604 satellites from orbital data retrieved on 3 October 2026, with 13,276 classified as communication satellites. These are counts from the archived list and our selection rules, not a census of every satellite in the world. They give a sense of how extensively communication infrastructure occupies orbit.[1]Different heights, different tasks
Satellites in low Earth orbit move quickly relative to the surface. Communication constellations use cooperating satellites to maintain coverage. Geostationary satellites above the equator circle with Earth's rotation, appearing in nearly the same direction from the ground.[3] Near-polar orbits serve a different purpose: as a satellite moves north and south, Earth turns beneath it, bringing other longitudes into view. Navigation satellites operate at different heights again. The map and weather forecast on a phone draw on different arrangements in the same surrounding space.[3]An orbital pattern near the poles
Looking toward either pole reveals bands among the points. Orbital planes have different inclinations to the equator; groups with similar inclinations produce uneven latitude distributions. Depth also matters. Adjacent points on screen may be far apart in altitude or distance. The bands describe orbital arrangement from a particular viewpoint. They do not directly map population, network congestion or the likelihood of a collision.Keeping that space usable
The European Space Agency's report released on 14 September 2026 describes expanding constellations and active satellites spreading across more altitudes. Coordinating operations and disposing of satellites at the end of their lives become increasingly important.[4] This view does not include the full debris population or calculate collision risk. It shows equipment with different jobs sharing space beyond Earth. Managing that space is also part of keeping communication and information available to people below. One retired satellite is the US Earth-observing Landsat 5. Launched in 1984, it recorded the surface for about 29 years before receiving its final command on 5 June 2013. Its retirement involved lowering its orbit, exhausting remaining fuel and switching off its transmitter. Ending a mission also takes work on the ground.[6]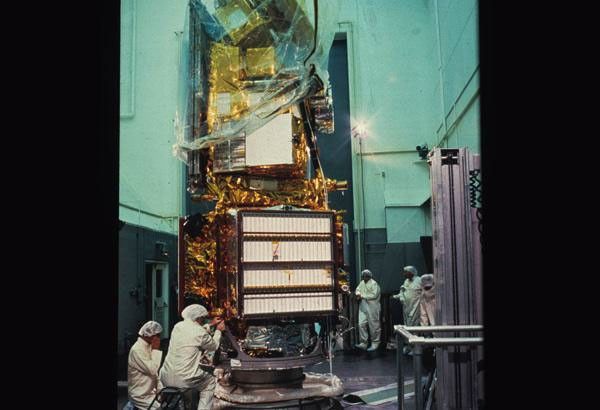
Landsat 5, a retired satellite, during spacecraft integration before launch. This is a prelaunch photograph of the hardware, not an orbital image after retirement. Launched in 1984, it received its final command on 5 June 2013.
USGS / NASA · U.S. Public Domain · Original image, unaltered
Data / Sources
Active GP retrieved from CelesTrak at 22:05:58 UTC on 3 October 2026. Of 16,636 entries, 16,604 had element epochs within seven days of the interval start; 32 older entries were excluded. Archived elements produce predictions, not live measured positions. NORAD IDs match groups, prioritizing stations, observation/weather, navigation, science, communication, then other. Six pale colors identify roles; counts do not rank their importance.CelesTrak Active GP / python-sgp4 2.27, WGS72 / TEME → GMST → ECF / 6371 km normalization / 121 samples, 60 s step, linear display interpolation. The R7 film plays the first 20 minutes at 60×. VIEW DIAMETER is the horizontal field of view (about 16,400–227,400 km), not physical expansion of an orbit.
[1] CelesTrak GP formats: https://celestrak.org/NORAD/documentation/gp-data-formats.php [2] CelesTrak usage policy: https://celestrak.org/usage-policy.php [3] ESA · Types of orbits: https://www.esa.int/Enabling_Support/Space_Transportation/Types_of_orbits [4] ESA · Space Environment Report 2026(2026-09-14): https://www.esa.int/Space_Safety/Space_Debris/ESA_Space_Environment_Report_2026 [5] ESA · Space debris by the numbers(2026-07-31更新): https://sdup.esoc.esa.int/discosweb/statistics/embed/bythenumbers [6] USGS · Landsat 5 decommissioning(2013-06-19): https://www.usgs.gov/landsat-missions/usgs-completes-decommissioning-landsat-5
Author
SORAH Editorial
October 4, 2026