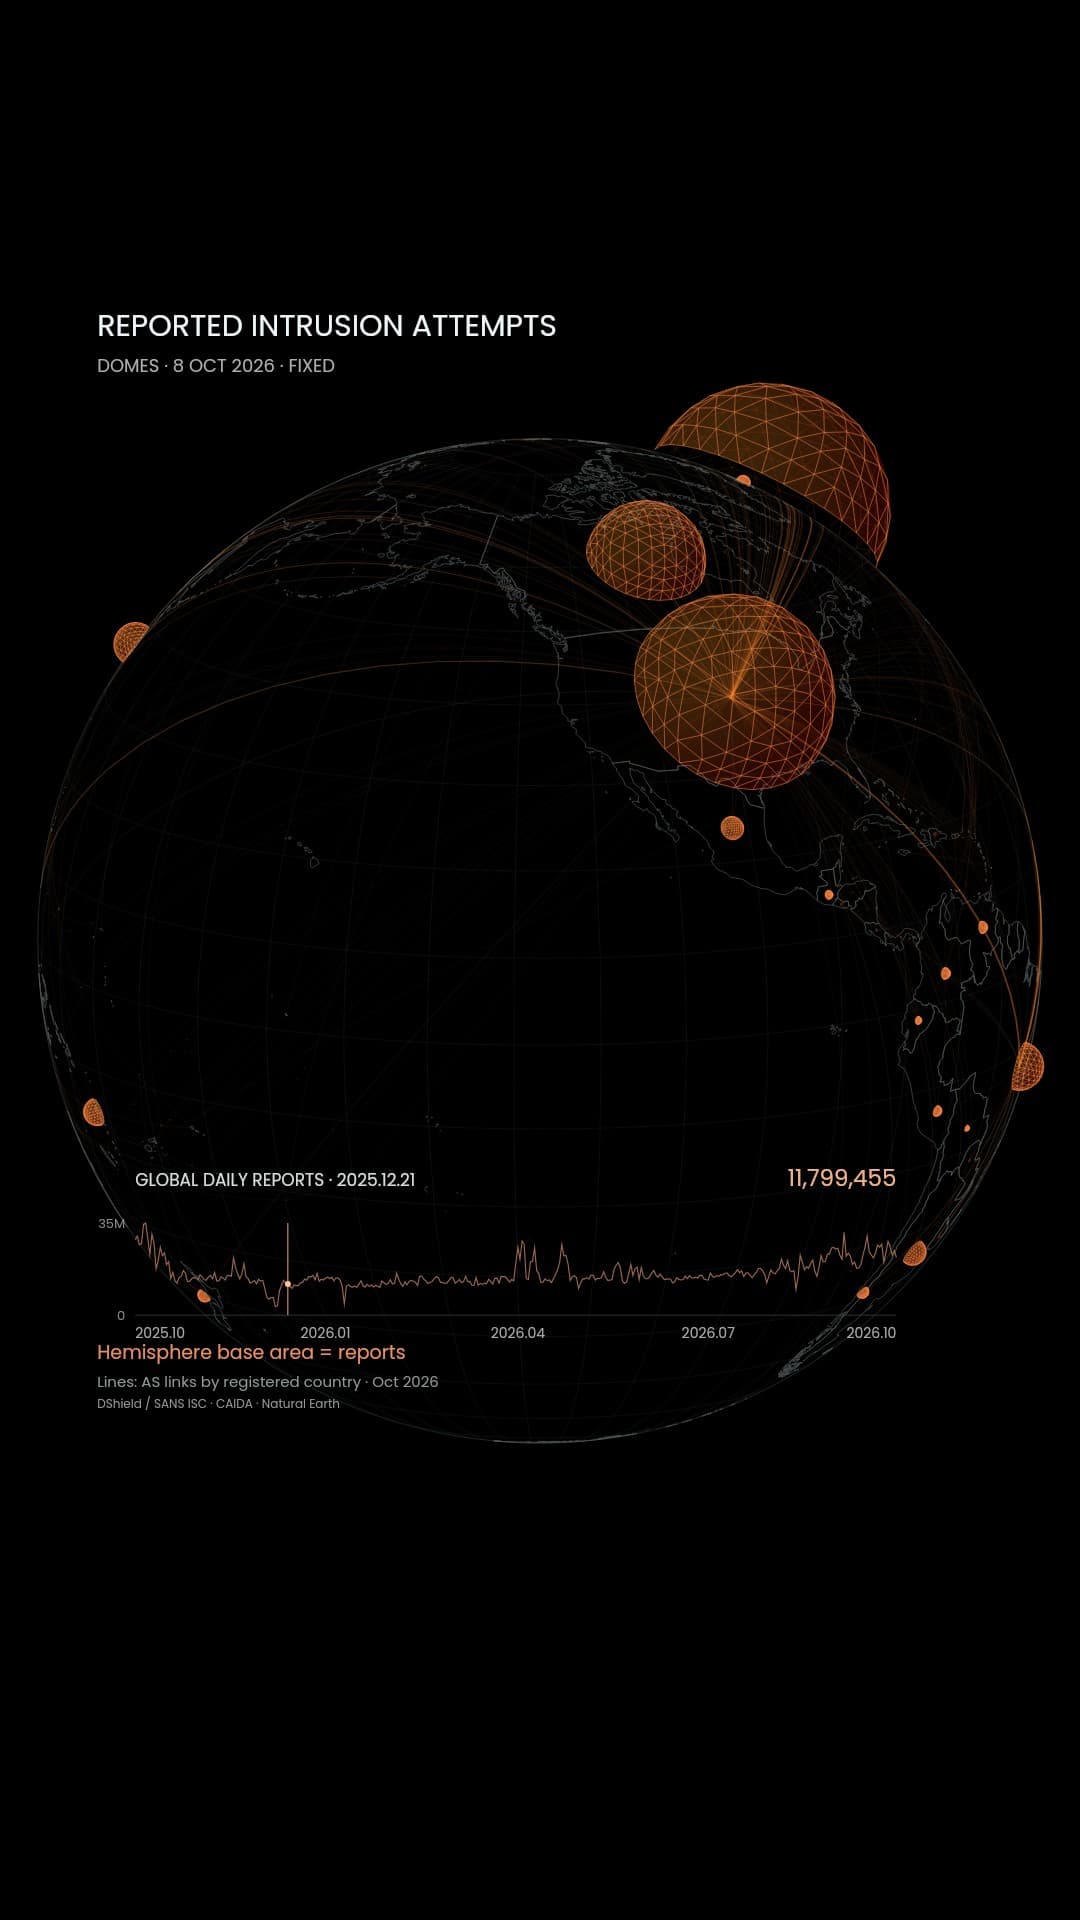
Transparent red–orange domes and the networks connecting the world. Follow a year of global daily reports on the timeline.
Connections and reports
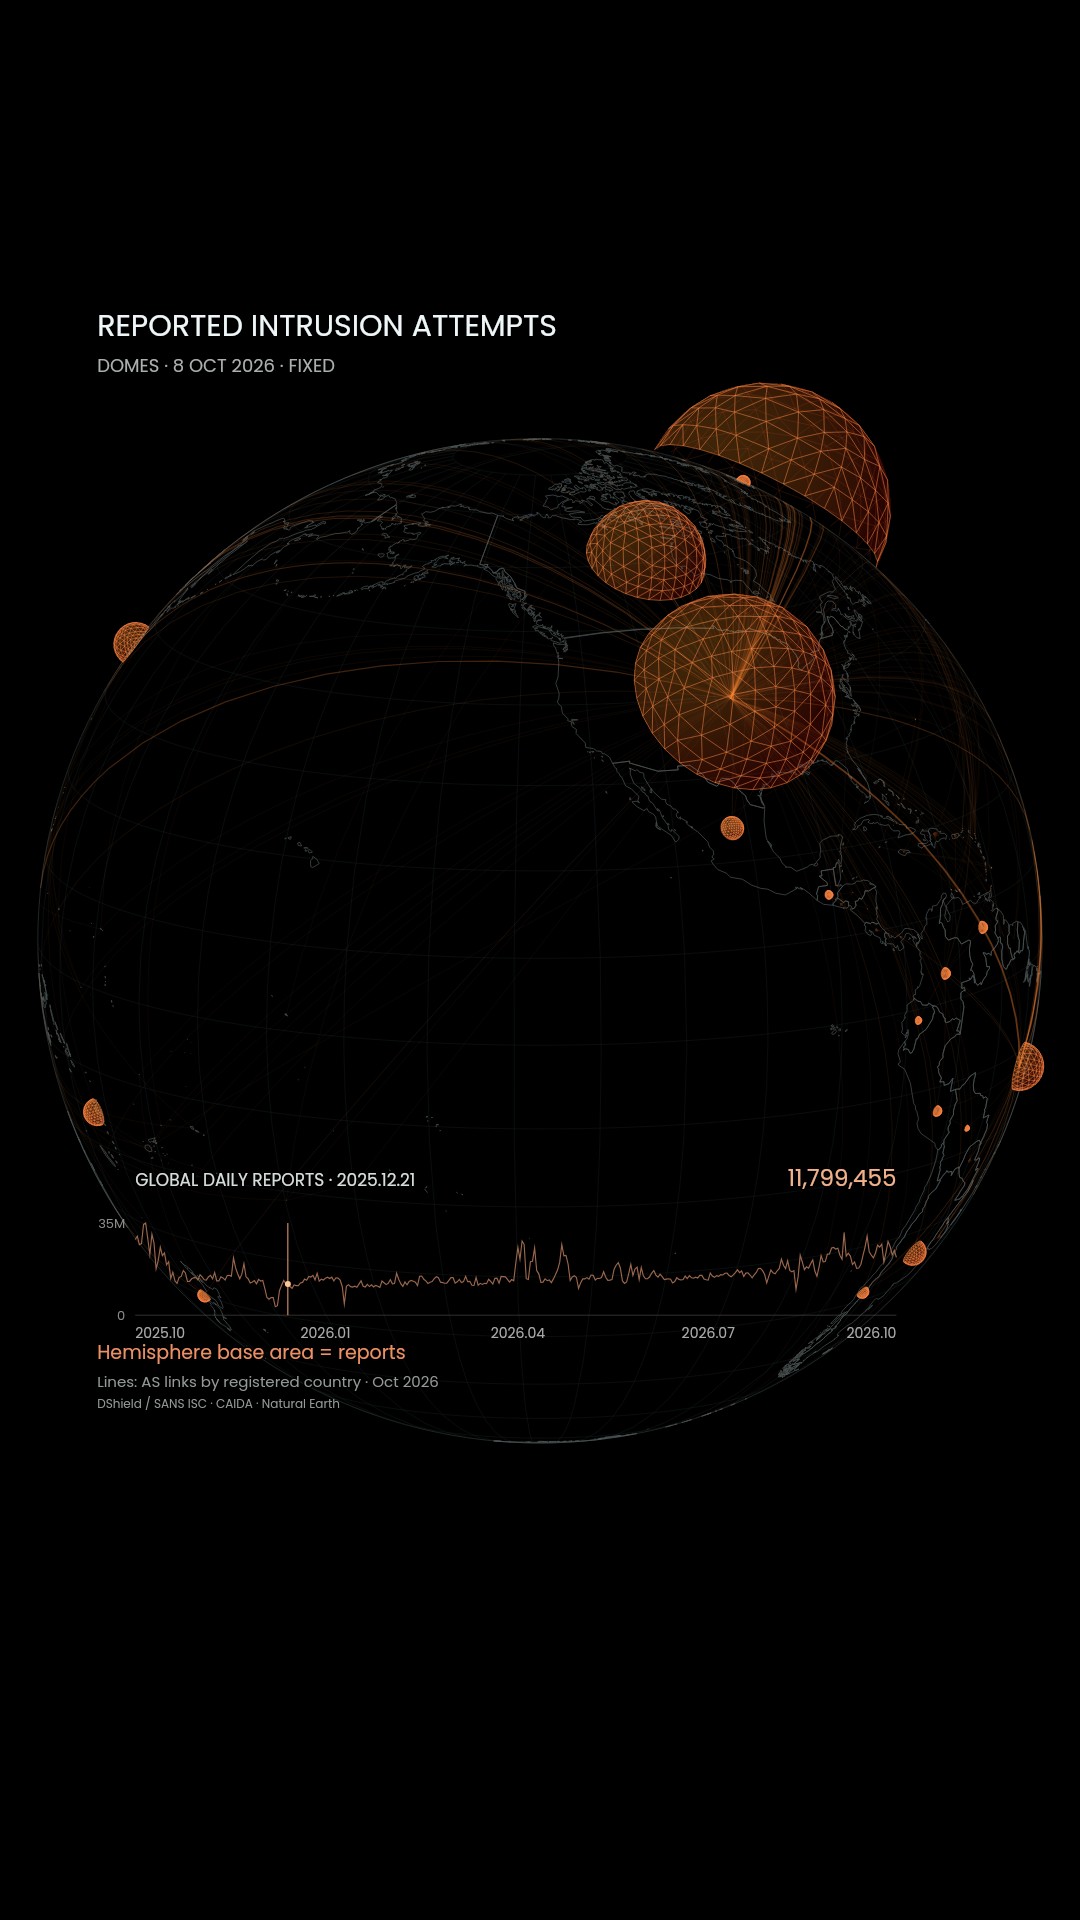
Red hemispheres rise from a black globe while orange lines connect countries. The film brings together two views of the Internet: reported activity grouped by source-IP country, updated on 8 October 2026, and a network of connections between operating organisations. A separate timeline follows global daily reports from 9 October 2025 to 8 October 2026.A line joining two countries can look like an attack in motion. Here, it represents a different relationship. Keeping connections separate from reports makes the image a way to ask who observed an event, rather than a map that assigns blame to whichever country looks largest.
Comparing records across places
The SANS Internet Storm Center traces its beginnings to the response to the Li0n worm in 2001. Comparing logs from different places helped reveal activity that one system could not explain alone. Contributions from participating systems remain central to DShield’s observations.[1]When reports rise, has hostile activity increased, or has the observation network changed? The total alone cannot settle that question. ISC also documents research scanning. Understanding unsolicited traffic requires examining its purpose and context as well as its volume.[2]
How networks cross borders
The Internet carries traffic across networks operated by different organisations. BGP is one of the mechanisms through which those networks exchange routing information. CAIDA uses routing observations to infer relationships between autonomous systems, or ASes, and makes those research datasets available.[3][4]
William Cronin working on network infrastructure at Scott Air Force Base, Illinois, 25 April 2018. Contextual photograph of network maintenance, not a DShield sensor. Maj. Jon Quinlan / U.S. Air Force / DVIDS · Public Domain; no endorsement The appearance of U.S. Department of War (DoW) visual information does not imply or constitute DoW endorsement. Source
Our orange lines aggregate AS adjacencies by the registered countries of their operating organisations. They connect country reference points, not mapped cable landing sites. Their arcs offer a schematic view of a system that crosses borders; they do not reconstruct the physical journey of a packet.[3][5]
Reading a year of change
The hemispheres add a second layer: reports are unevenly distributed across estimated source-IP countries. Japan accounts for 138,413 reports in the archived snapshot. That is not a count of attacks suffered by Japan, nor evidence that the people responsible were in Japan. The geography of a server and the geography of its operator can differ.[6]The daily series ends at 21,805,399 reports on 8 October 2026. The country snapshot totals 21,284,011; its collection window and aggregation differ. Neither number measures successful intrusions. The domes therefore stay fixed while the timeline changes: the film shows a verified geographic snapshot alongside an independently collected global history.[6]
Back to the people maintaining the network
Behind these marks are people maintaining equipment and interpreting logs. The large shapes on the globe begin with that local work. Returning to the map means returning to its dates, its contributors and the meaning of a single report—not only to its largest hemisphere.Data and representation
The DShield source-country snapshot was updated on 8 October 2026 at 04:04:14 UTC: 2,353,104 rows, 21,284,011 reports and 173,887 source IPs. DB-IP estimates country locations. Individual IPs are not published or redistributed. The unfiltered feed can include false positives and research scans.Dome base area is proportional to report count. The estimated source-IP country is not the attack target, attacker location or number of successful intrusions. Country histories were not obtained, so domes stay fixed while the global daily series follows 365 days, 9 October 2025–8 October 2026. Country and daily aggregates have different collection windows and do not sum to the same value.
CAIDA BGP-inferred AS adjacencies are aggregated by the registered countries of operating organisations. Orange line width represents AS-link count, not traffic volume, cable geography or source–victim attack pairs. These links are not individually matched to DShield reports.
Credits: DShield / SANS ISC, CAIDA, DB-IP and Natural Earth. Earlier Cloudflare and Shadowserver comparisons remain archived in P1 records and are not added to this final film.
Sources
Author
SORAH Editorial
October 9, 2026