Published on 09/October/2026 · Water
Cotton, groundwater and the circles of the Texas High Plains.
By SORAH Editorial
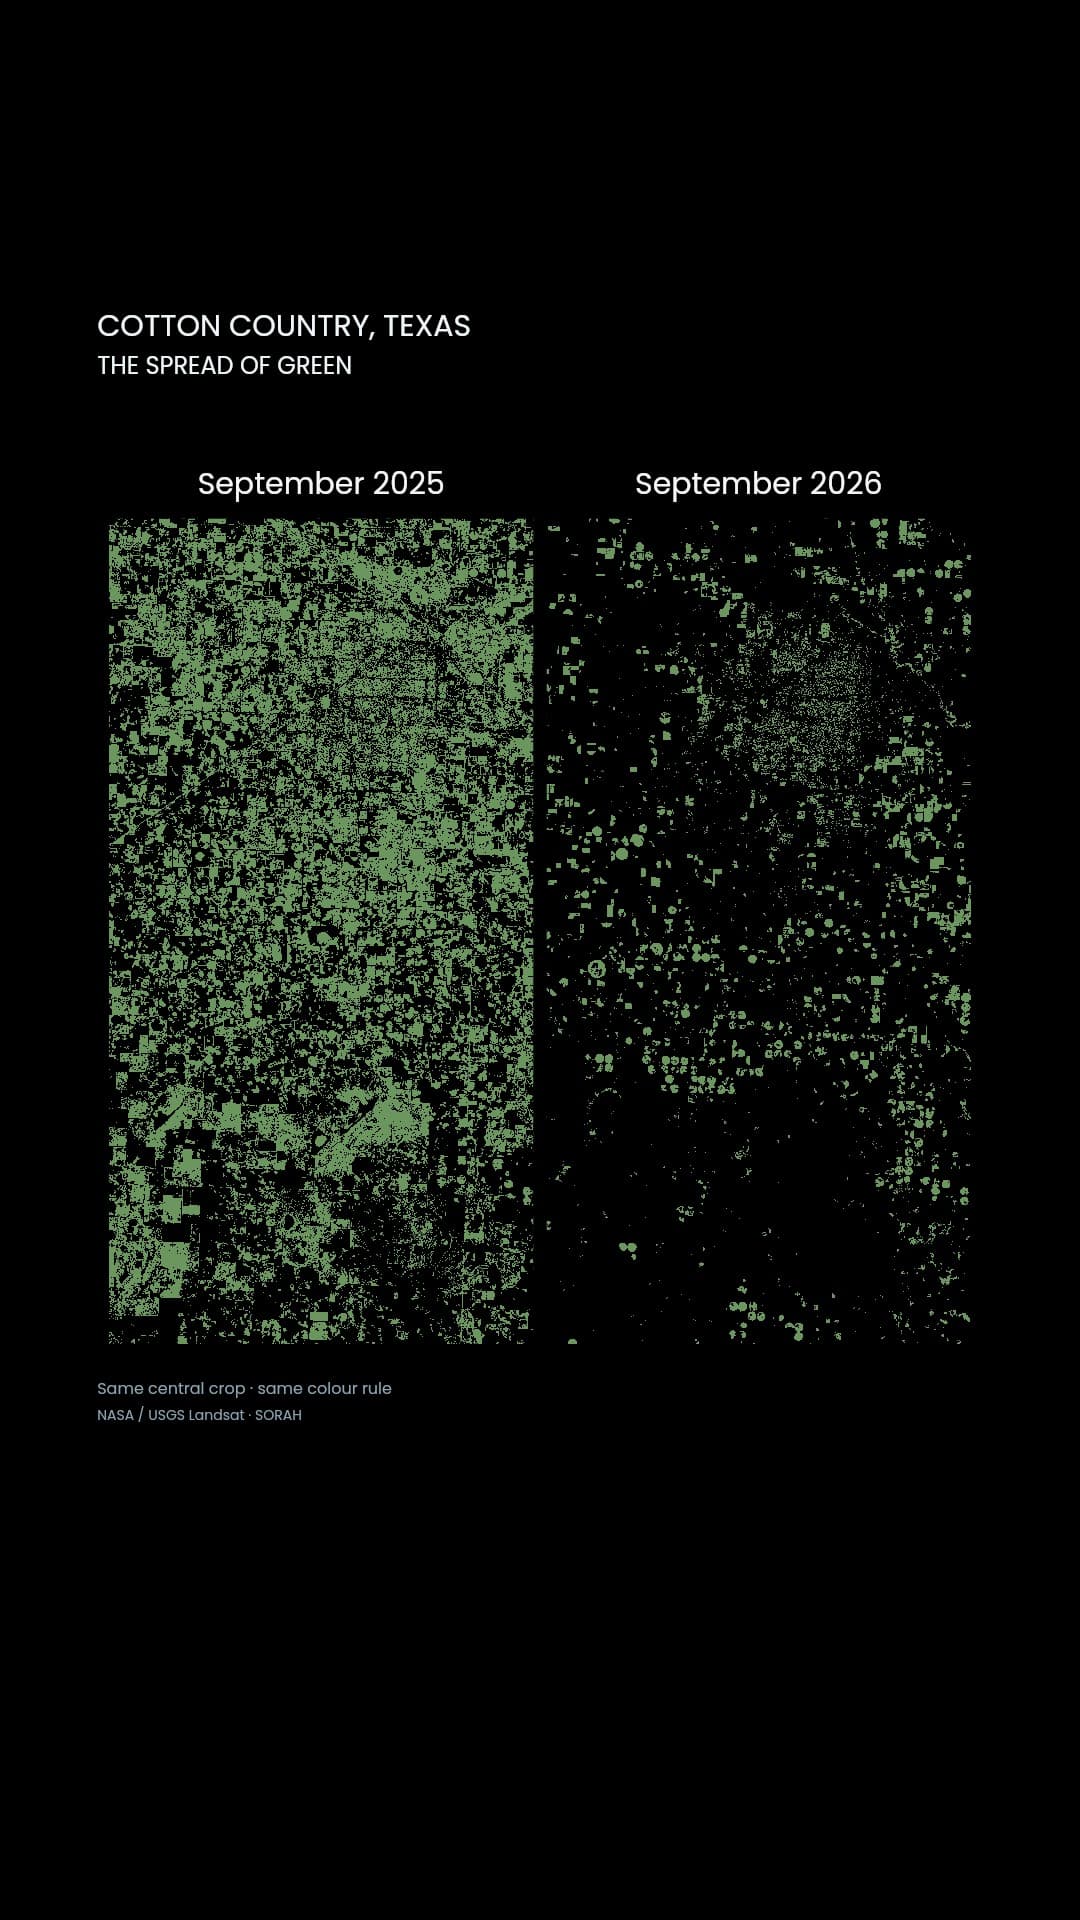
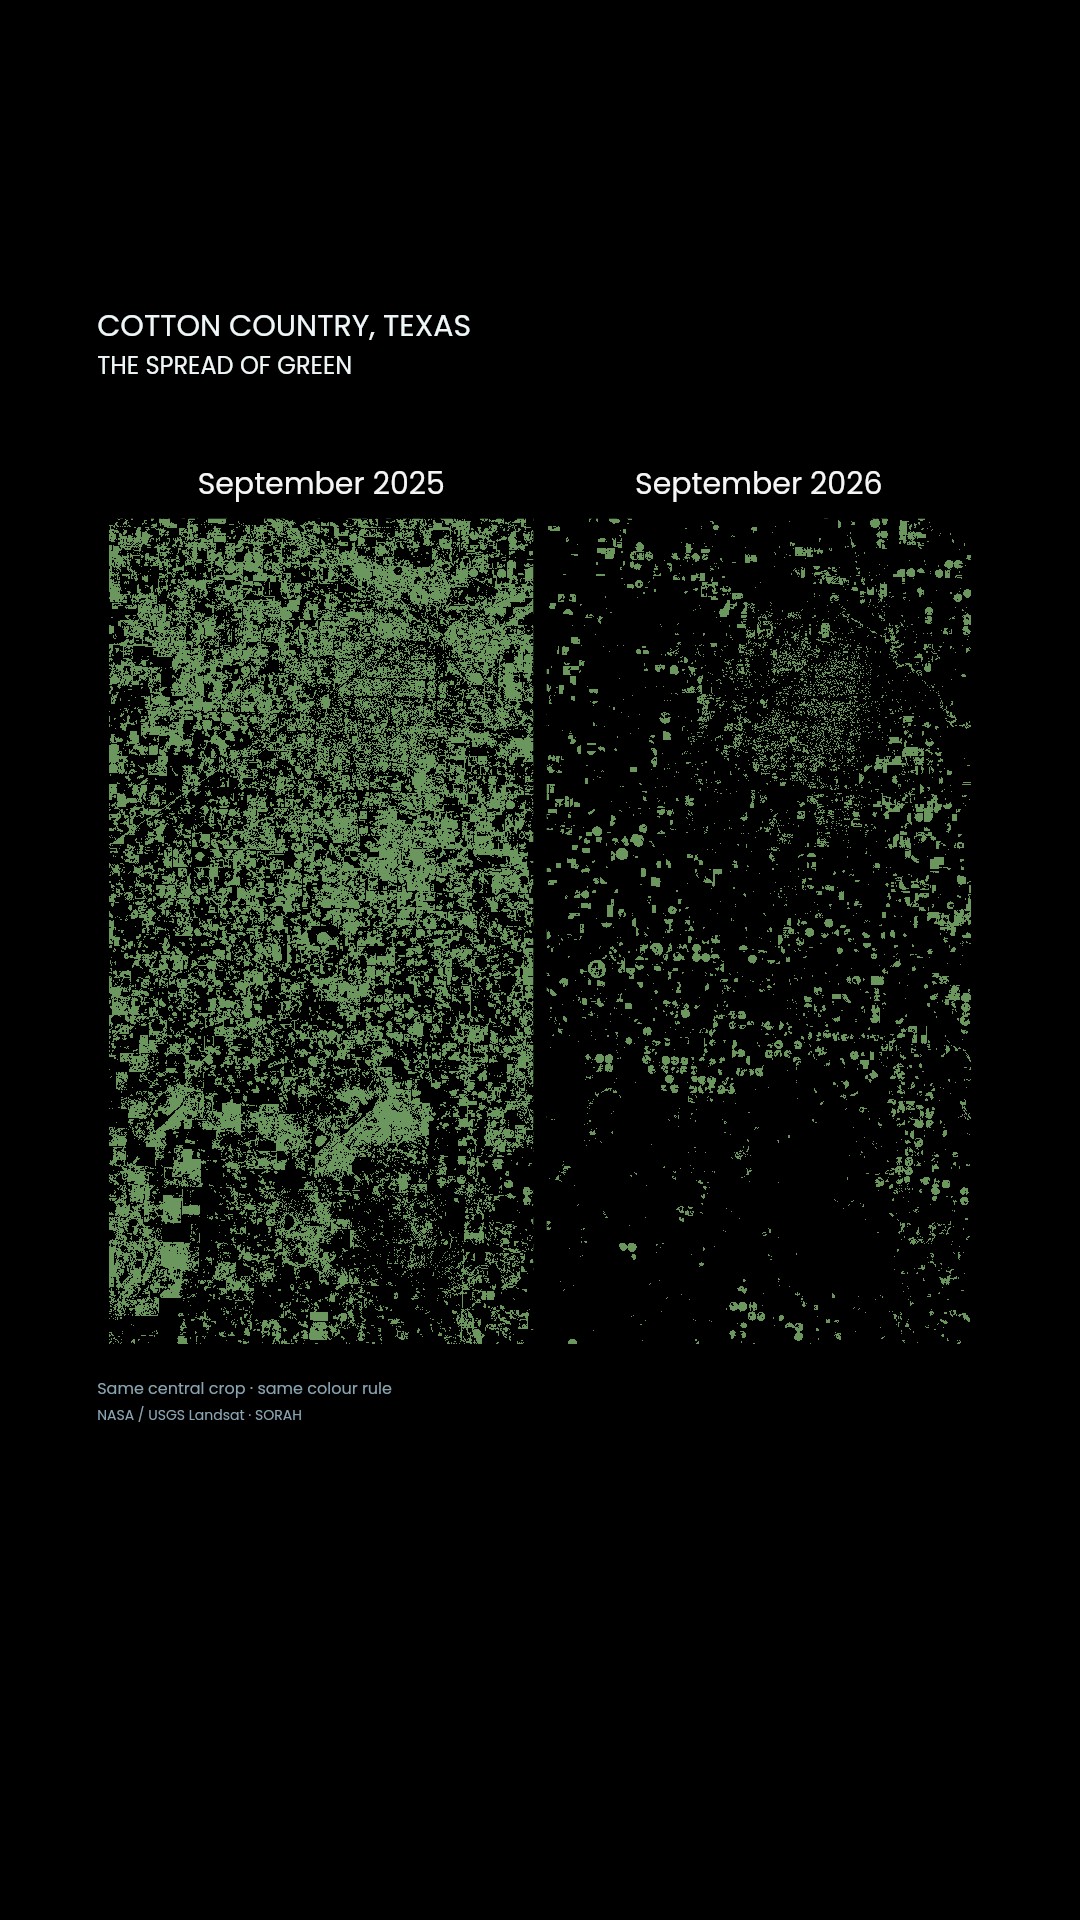
The same landscape in September 2025 and 2026. Circular irrigation fields bring the water behind cotton into view.
Rain over Texas cotton country
Two September views place 2025 and 2026 side by side around Lubbock, Texas. Dots first represent rainfall, then greenery spreads across the frame before gathering into proportional colour fields. The sequence revisits the drought conditions described by NASA Earth Observatory on 8 October 2026 through rain records and the colours of satellite imagery.[1]At Lubbock airport, January–August precipitation totalled 399.0 mm in 2025 and 220.0 mm in 2026—a difference of 179.0 mm. Matching the months gives useful seasonal context. It remains a record at one station, not a measurement of the rain that reached every surrounding field.[2]
From a change in green to life on the farm
The published Landsat images represent 22 September 2025 and 9 September 2026. Within a common crop, we classify pixels as green, earth-toned or other. Green pixels occupy 42.8% and 9.4% of the displayed area, a difference of 33.4 percentage points. Those values describe image colours, not proportional losses of cotton yield or groundwater.Water is only one influence on visible greenery. Crop choice, growing stage and harvest can also affect what a field looks like. The observations are thirteen days apart. Their colour proportions are therefore an opening for investigating the landscape, rather than a complete account of what happened on each farm.
NASA’s reporting describes different choices on rain-fed and irrigated land. Lubbock County farmer Lacy Cotter-Vardeman reported extensive losses in her own dryland cotton, an individual experience rather than a regional damage estimate. Near Brownfield, the account describes irrigating only part of a circular field as available well water becomes a constraint.[1]
A longer history below the surface
The High Plains aquifer extends beneath parts of eight states. Its broad outline on a map contains very different local water-level histories. USGS monitoring wells allow researchers to compare recent levels with conditions before intensive development.[3]A USGS report published in 2024 estimated an area-weighted average decline of 16.5 feet, about 5.0 metres, across the aquifer from around 1950 to 2019. This is a change in water level, not a uniform thickness of water removed everywhere. The wells record a much longer history than the two Texas images.[3]
Wet and dry years can produce conspicuous changes at the surface. Below it, decisions about irrigation interact with decades of pumping and replenishment. A USGS study found that agricultural withdrawals across the aquifer decreased between 1985 and 2015 while irrigated area increased. Neither area nor total withdrawals alone tells the whole story of agricultural change.[4]
Deciding where water can go
The irrigation equipment photographed in Cochran County gives a ground-level counterpart to the circular patterns seen from space. Their orderly shapes are produced by machinery and water delivery, and by decisions about which parts of a field can be supplied.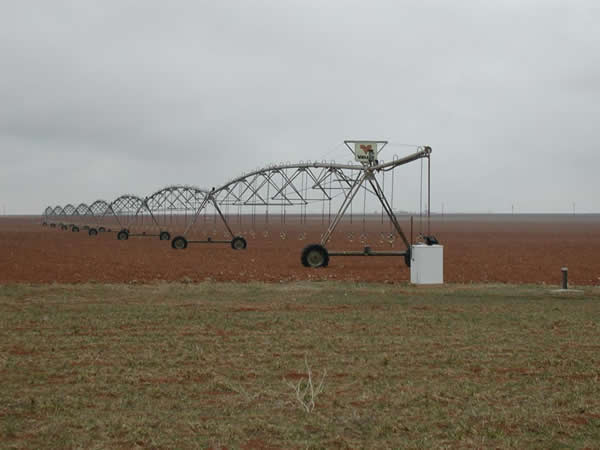
Center-pivot irrigation in Cochran County, Texas. USGS contextual photograph; capture date and individual photographer not supplied. This is not a photograph of the exact 2025/2026 comparison crop. USGS Groundwater Resources Program; individual photographer not supplied · USGS public-domain government image; no third-party credit shown Source
In the final scene, fine pixels gather into fields of colour. After comparing the green shares, attention can return to the land those shapes represent. For a grower considering the next planting around Lubbock, the rain still to come and the water available from a well belong to the same working day.
Data and representation
The two co-located NASA Earth Observatory / Lauren Dauphin Landsat JPEGs are classified at native pixel resolution using identical RGB thresholds. ExG=(2G−R−B)/(R+G+B)>0.035 plus green-channel, saturation and brightness tests defines green-toned pixels. Brown tones define non-green; all remaining pixels are other. The side-by-side storyboard uses the central 50% width and full height in both images; percentages use that displayed crop. Original full-image statistics remain separately archived. This exploratory classification of processed RGB is not validated land cover, NDVI or planted area. Dates differ by 13 days; phenology, soil, shadow and image processing affect colour.USGS reports an aquifer-wide, area-weighted average water-level decline of 16.5 feet (about 5.0 m) from predevelopment to 2019. This is not a local well measurement for the fields shown.
Precipitation: NOAA/NWS Lubbock airport monthly table, January–August in both years before either September image: 399.0 mm (2025), 220.0 mm (2026). Inches × 25.4; February 2025 trace is retained as a flag and counted as zero in displayed totals. Single-station context, not a spatial rainfall layer, irrigation or groundwater volume. The sequence is explanatory, not observed crop growth or a causal attribution to rain alone.
The rain sequence progresses through cumulative monthly totals. Changes between month endpoints are graphical interpolation, not daily observations. It begins with each January total and reaches 399.0 / 220.0 mm at the end of August.
Regular samples of the classified image retain their category colour while rearranging as particles into matching bands. This is a graphic transition, not physical movement of water, soil or crops. Final percentages use all original pixels in the displayed crop, not sampled particle counts.
Sources
Author
SORAH Editorial
October 9, 2026