
Published on 03/October/2026 · Earth
Kīlauea: lava that changed the coast, and a summit still changing
By SORAH Editorial
In 2018, lava reached the ocean and changed Hawaiʻi’s coastline. Since December 2024, renewed summit activity has been building ground inside the crater. Eruption records through September 2026, alongside an October 2 update, show an island still taking shape.
In 2018, lava reached the ocean and changed Hawaiʻi’s coastline. Since December 2024, renewed summit activity has been building ground inside the crater. Eruption records through September 2026, alongside an October 2 update, show an island still taking shape.
Red lava entering the ocean made Kīlauea’s 2018 eruption unforgettable. But that year was not the end of the volcano’s story. The current focus is its summit: on September 14–16, 2026, new vents released lava inside Halemaʻumaʻu without tall fountains. The U.S. Geological Survey’s Hawaiian Volcano Observatory recorded approximately 0.4 million cubic metres of erupted lava.[1][3]
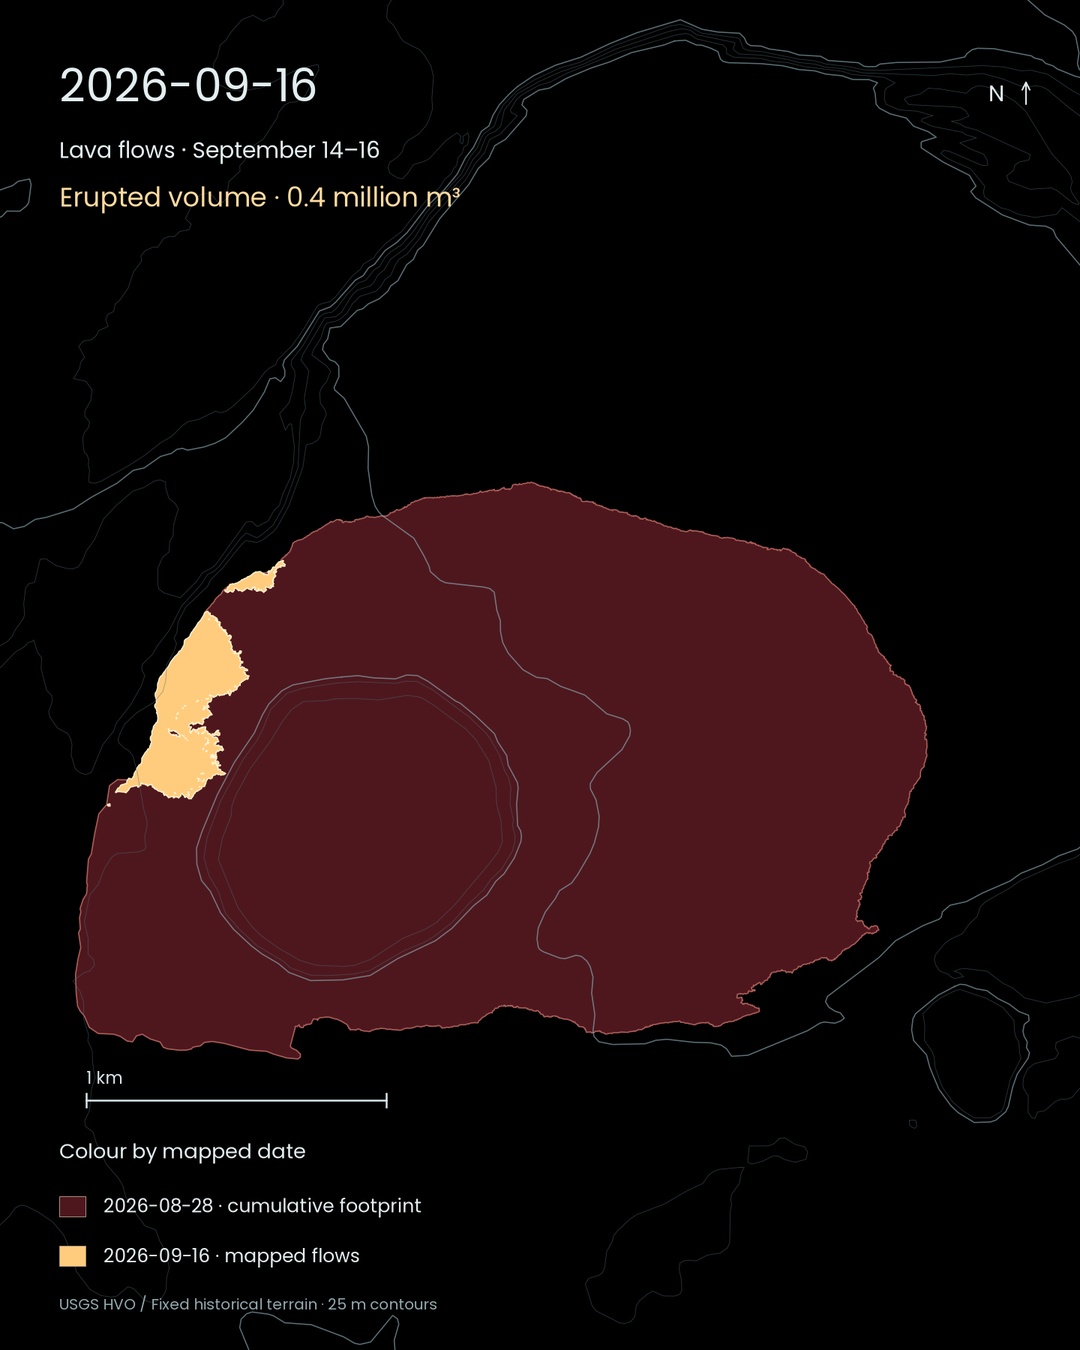
Dark red: cumulative footprint mapped August 28, 2026. Pale orange: flows mapped September 16. Colours distinguish map dates, not temperature or elapsed days. The 25 m contours show fixed historical terrain.[2][3][6][7]
A day without fountains is still part of the story
At 9:45 a.m. Hawaiʻi Standard Time on October 2, 2026, USGS reported no overflows or spattering from the main vents during the preceding 24 hours. Earthquakes continued beneath the crater. A shallow magma intrusion on September 30–October 1 had not produced an observed lava eruption at a new location.[8]Lava at the surface and magma moving underground are different parts of an active volcano. A pause in the spectacle does not erase the quieter observations. The summit figures in this article and the Data Scape view use eruption records through September 16; the October underground activity is described in the text.
A higher fountain does not necessarily leave more lava
The summit eruption began on December 23, 2024 and has proceeded through episodes separated by pauses. The observatory lists 54 numbered fountain episodes through August 25, 2026. Their maximum heights and erupted volumes reveal two different measures of an eruption.[1]Episode 3 reached approximately 86 metres and released 13.0 million cubic metres. Episode 43 reached approximately 540 metres but released 11.9 million cubic metres. The taller fountain did not produce the larger total volume. How much material emerges, and for how long, matters alongside the height it reaches.[1]
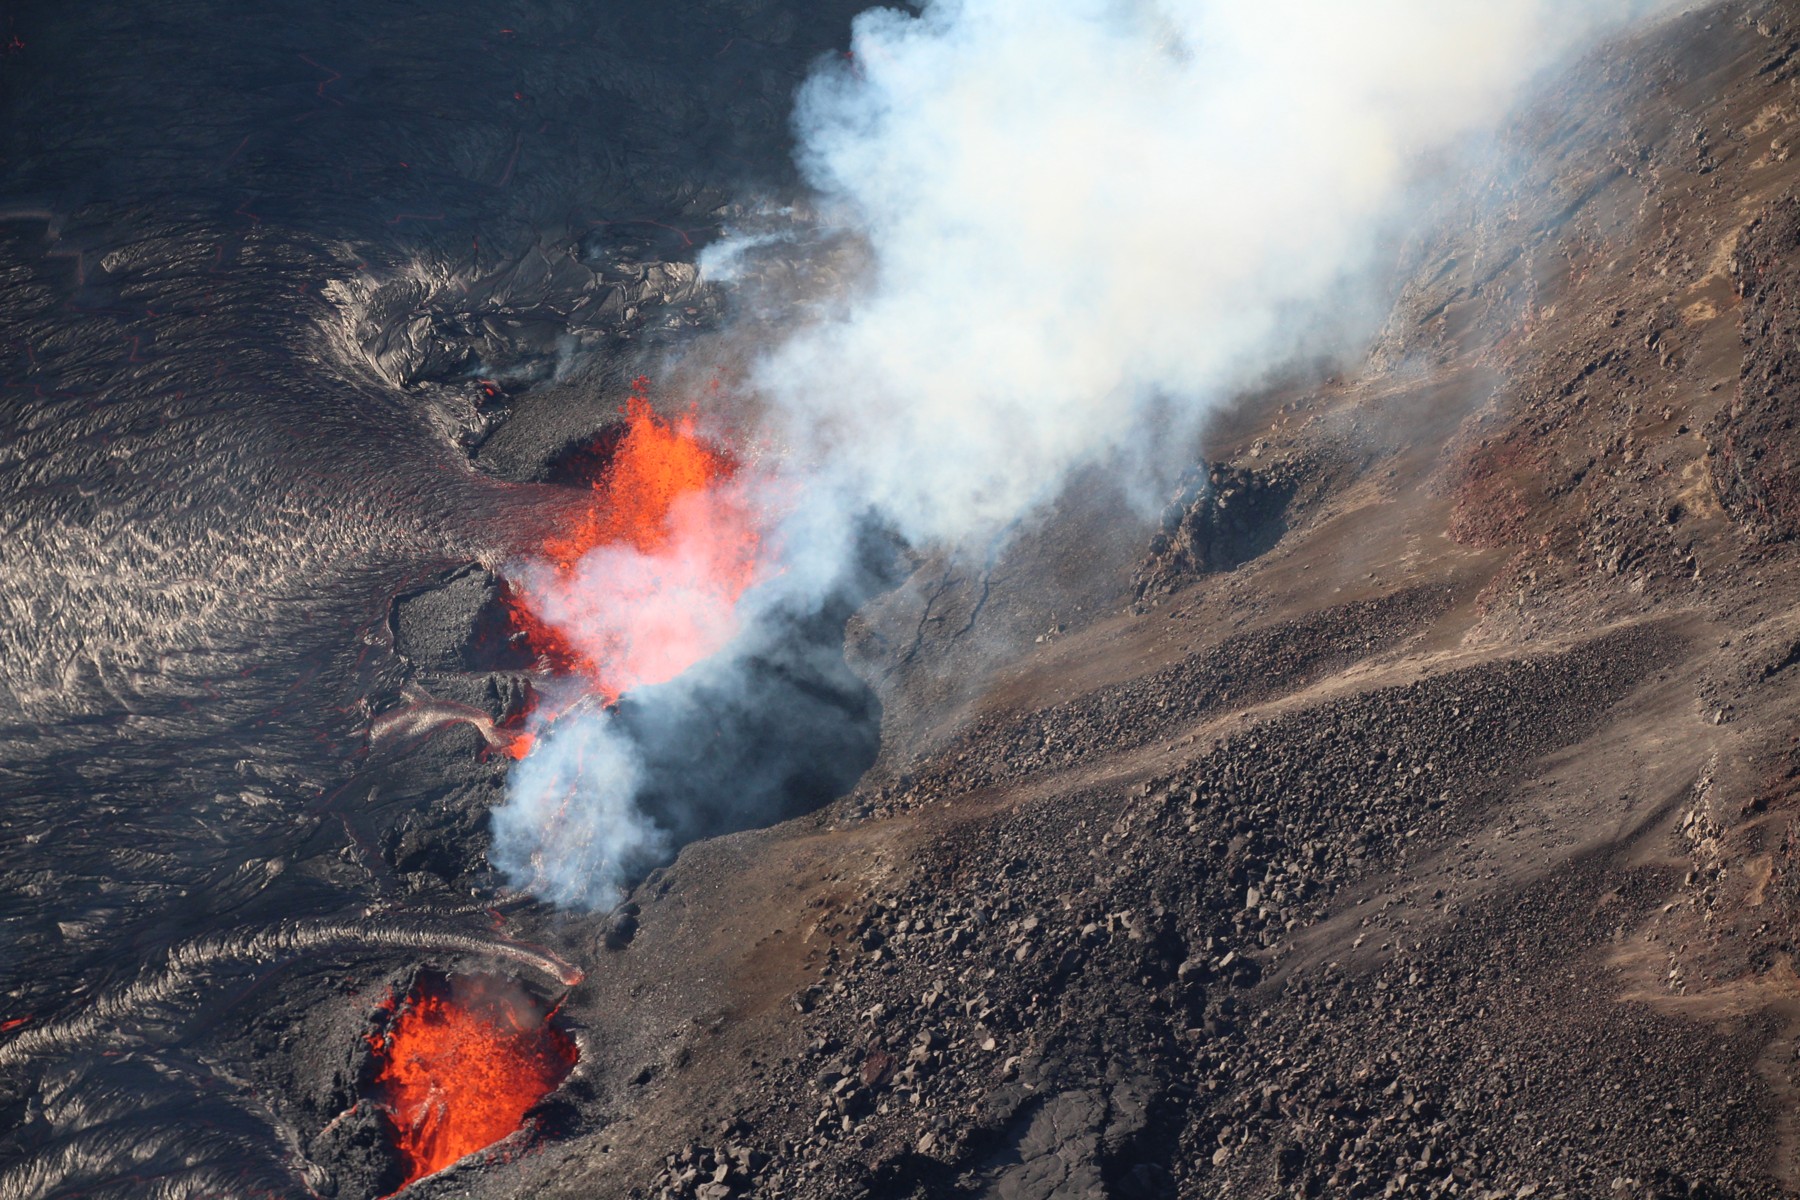
An aerial view of fountains during episode 3, December 30, 2024. Photo: N. Deligne / USGS (public domain).[11]
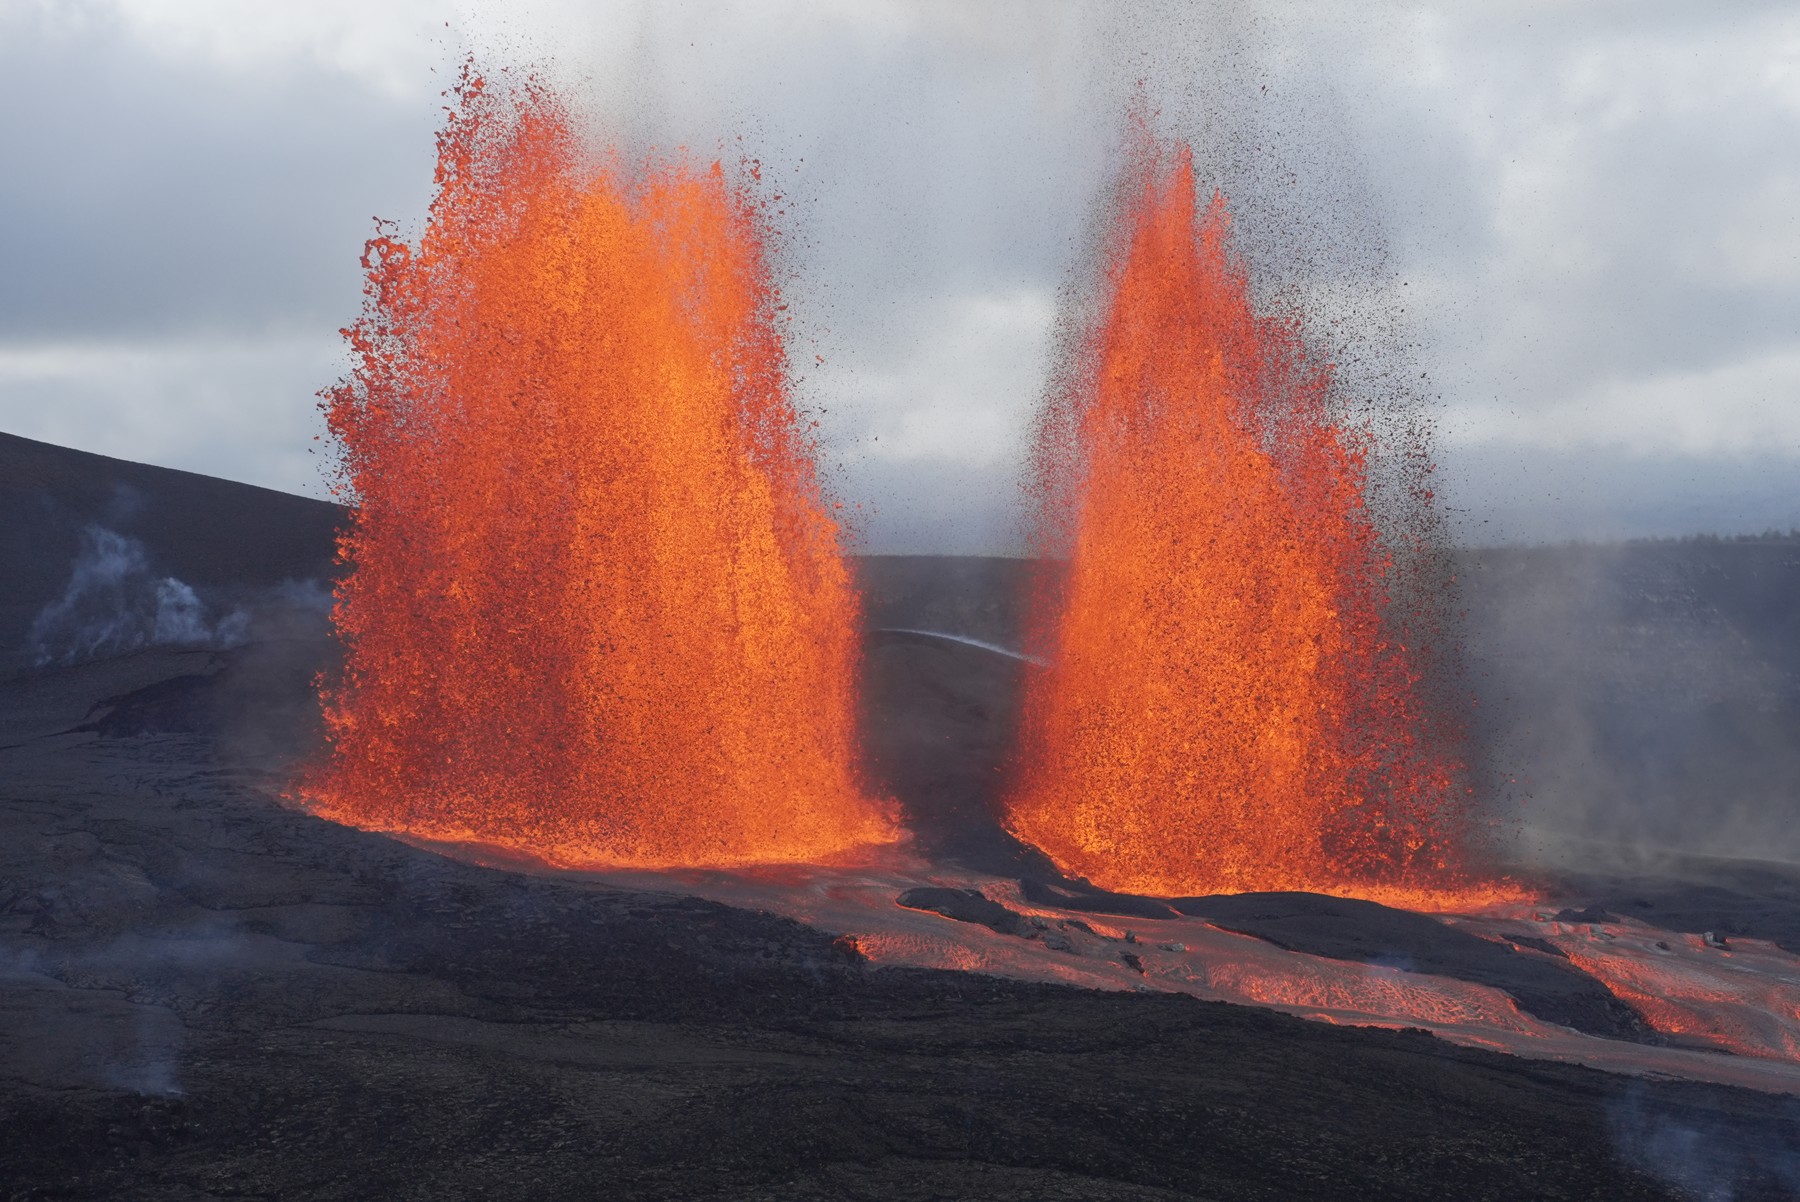
The south and north fountains during episode 43, March 10, 2026. Photo: M. Patrick / USGS (public domain). The two photographs differ in viewpoint and scale; heights and volumes in the text are episode-wide observations.[1][12]
An island can grow within its own outline
At the summit, repeated flows cover the crater floor and accumulate. An outline seen from above can remain similar while material builds up inside it. A coastline advancing into the sea is only one way a volcano changes the land.[1]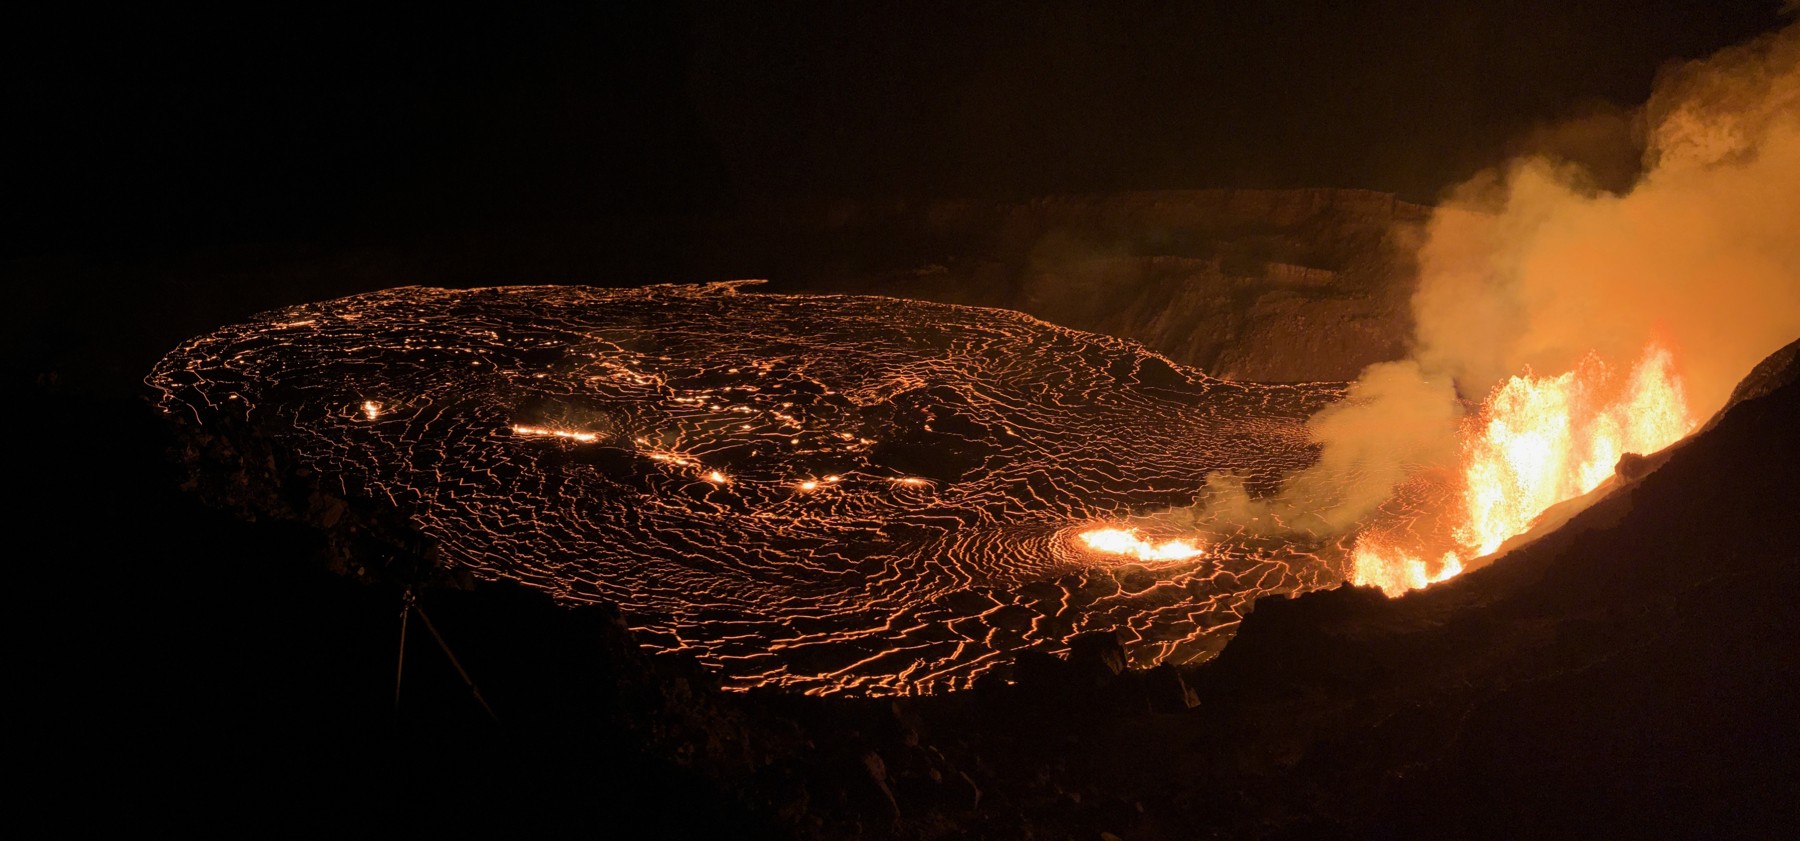
The first day of the summit eruption, December 23, 2024. Lava from western vents spreads across the floor of Halemaʻumaʻu. Photo: M. Zoeller / USGS (public domain).[13]
2018: lava moving toward the coast
In 2018, fissures in the lower East Rift Zone sent lava down the flank toward the ocean. At the summit, withdrawal of magma accompanied collapse. Lava spreading near the coast and ground subsiding at the summit were distant expressions of activity within the same volcano.[4]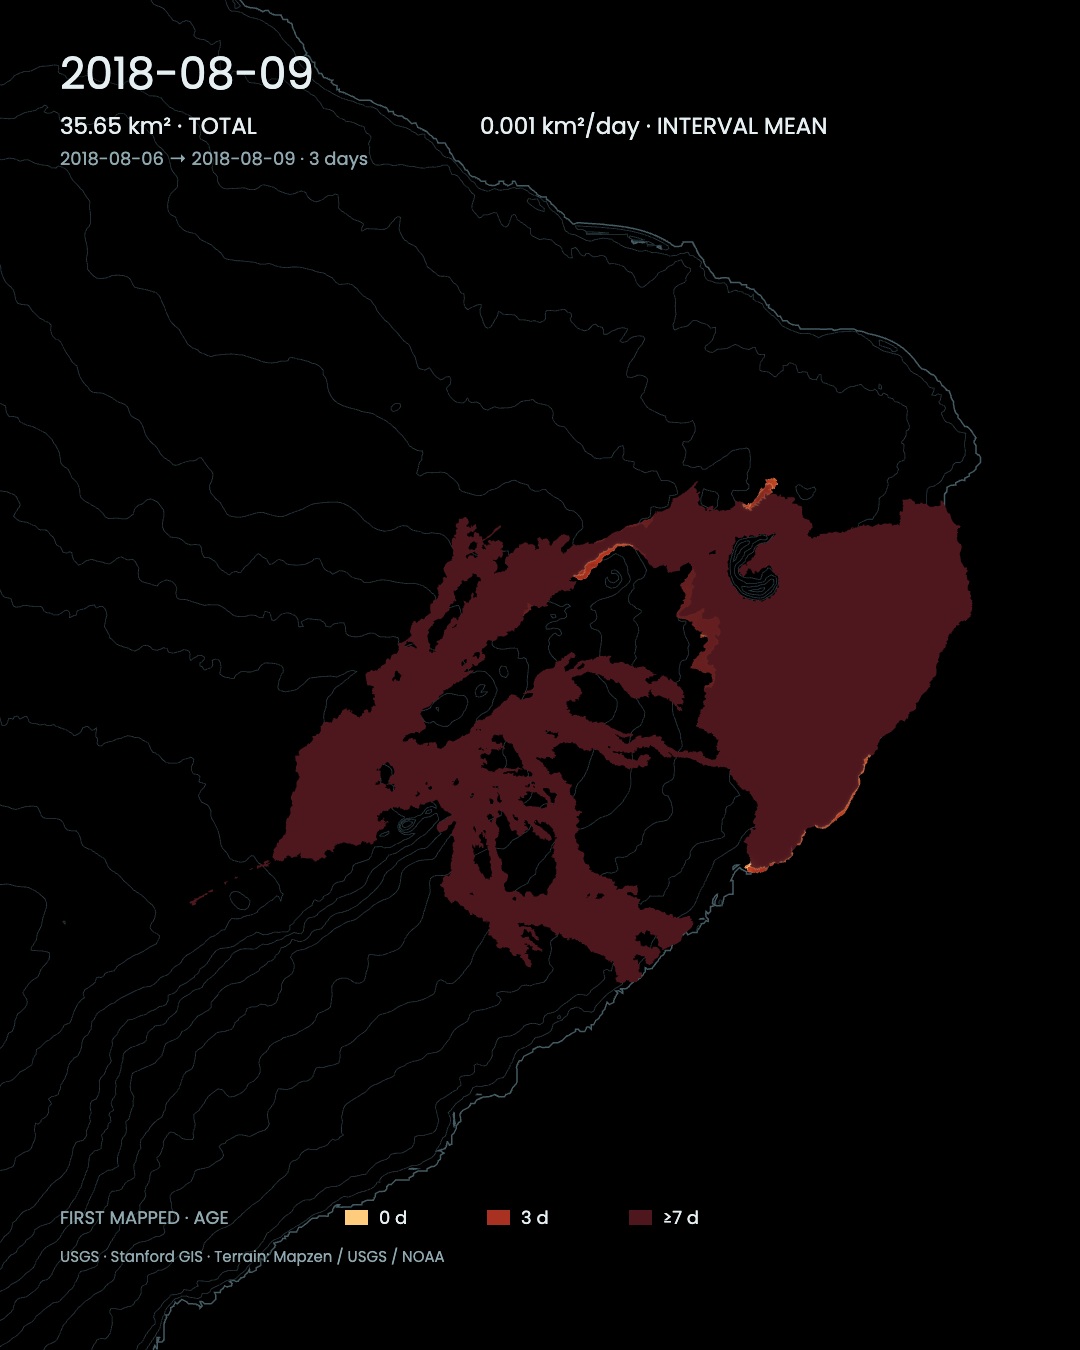
Comparison: cumulative lower East Rift Zone footprint through August 9, 2018. Location, scale and dates differ from the summit view. Colour represents elapsed time since first mapping.[5]
The new landscape also covered places where people lived. According to the U.S. National Park Service, the 2018 flows destroyed more than 700 homes. Land being created and lives being disrupted belonged to the same event. Today’s summit activity is taking place in a different location and reshaping the ground in a different way.[10] As a narrative parallel, that coexistence of destruction and creation recalls Moana (2016), in which the lava figure Te Kā becomes the life-giving Te Fiti again.[9]
The lava left at the coast in 2018 and the material accumulating at the summit in 2024–2026 belong to different chapters. Seen in an instant, an eruption is red light. Seen across years, it is also the ground that remains after the glow fades. Hawaiʻi’s landscape is still changing within the same span of time in which people watch it.
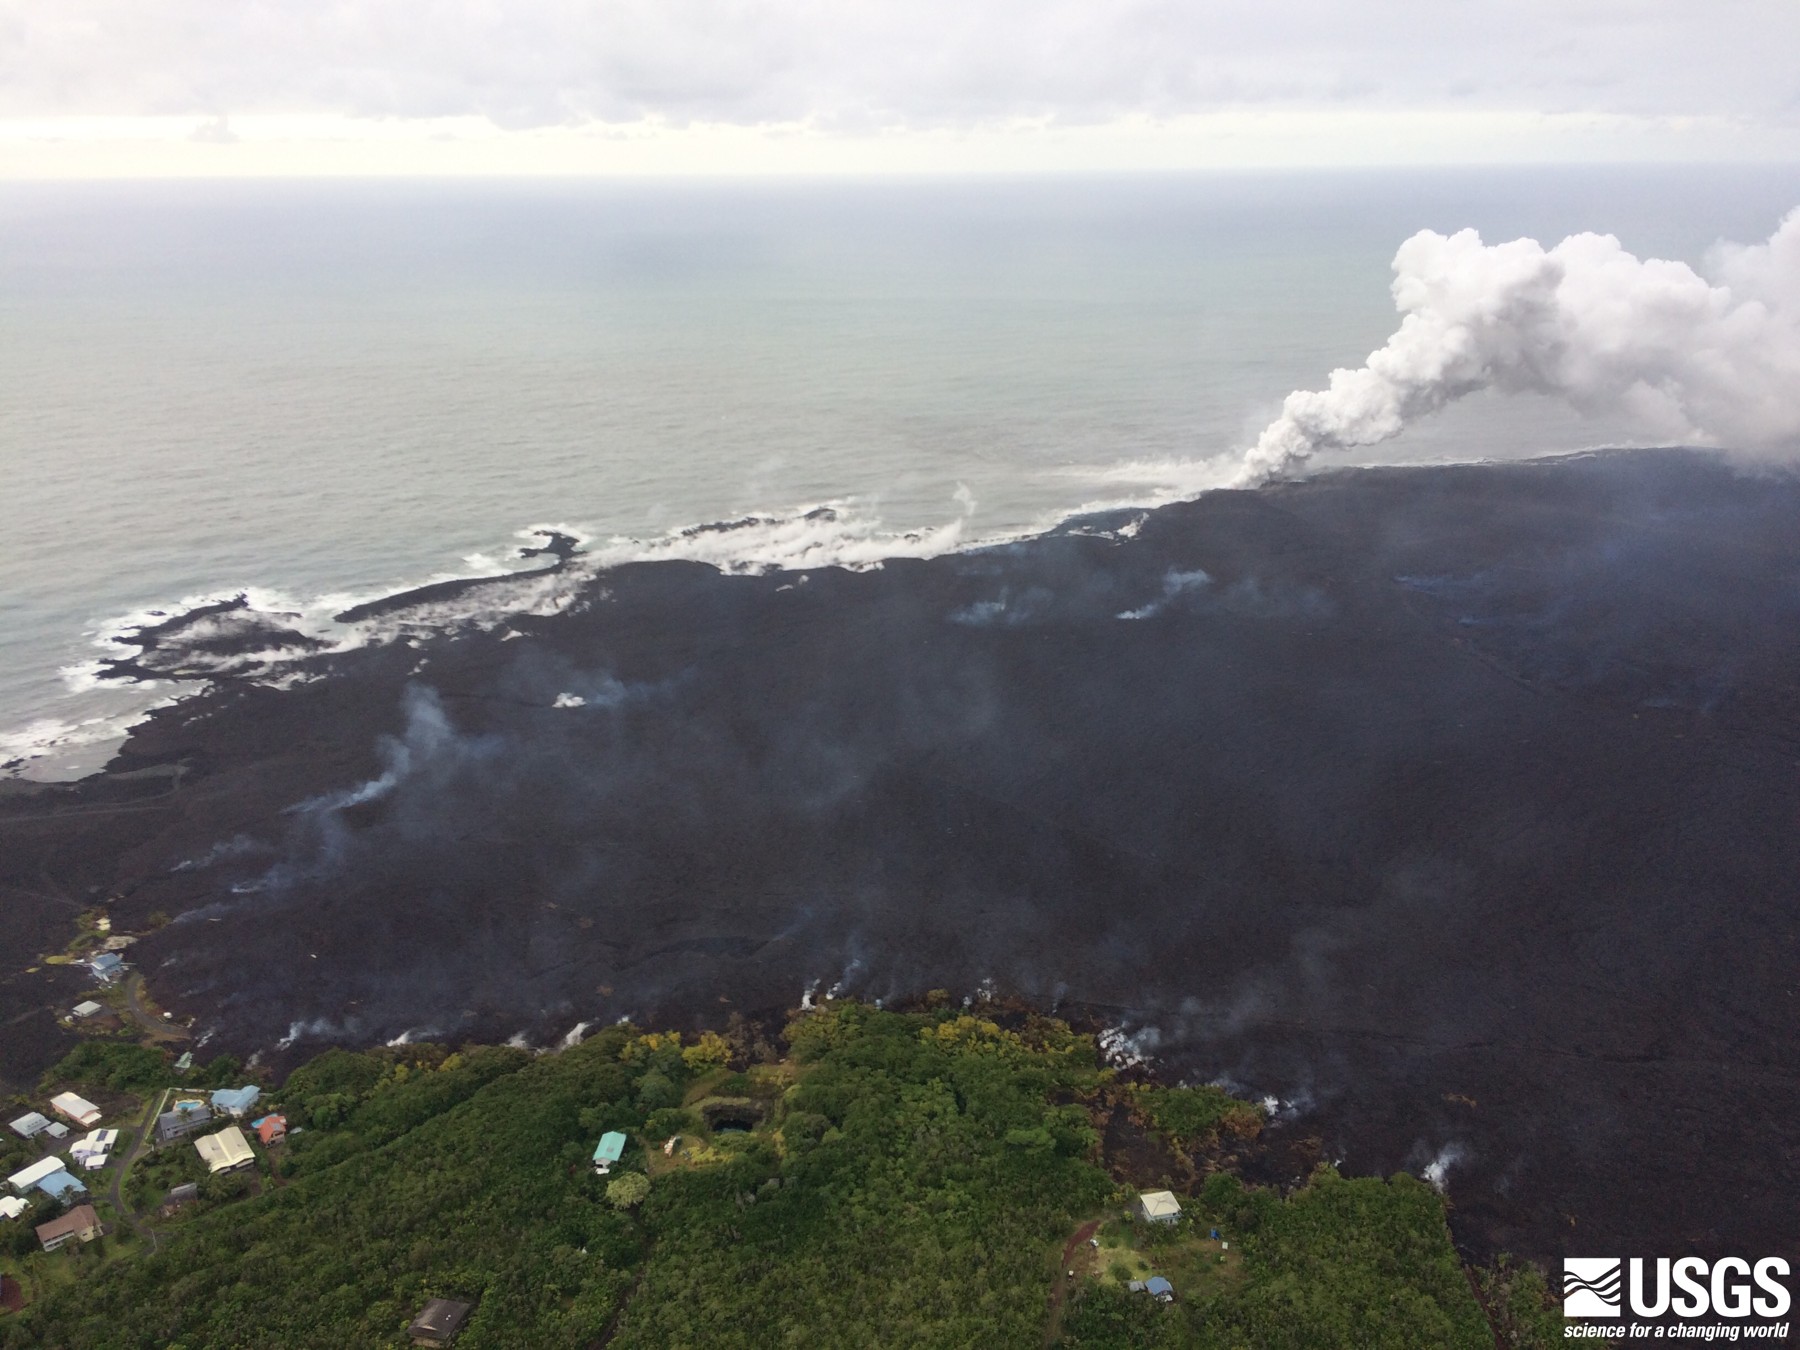
Kapoho Bay, June 10, 2018. Lava enters the ocean beneath white plumes as a new lava delta extends the coast. Photo: USGS Hawaiian Volcano Observatory (public domain).[14]
Note · Article maps and photographs The September summit map overlays the cumulative August 28 footprint and flows mapped September 16. Daily extents are unavailable, so daily spread and cooling are not interpolated. Overlapping polygons are not counted twice. Contours are fixed historical terrain, not current crater elevations. The 2018 map uses a separate observation series, with colour showing time since first mapping. Photographs document the scenes on their stated dates.[2][3][5][6][7][11][12][13][14]
Note · Data Scape · Data & method The following describes the summit animation in Data Scape. The main film shows the 2018 lower East Rift Zone. 54 fountain episodes from December 23, 2024 to August 25, 2026, followed by the unnumbered September 14–16 lava-flow record. The first 18 seconds give each numbered episode equal screen time; the final 2 seconds show September flows. This is an event sequence, not uniform calendar speed or actual durations. The August 28 footprint is fixed spatial context throughout, not each historical extent. Illustrative texture brightness follows the square root of reported event volume; it does not show temperature, velocity or the liquid area at that time. Bars show event volumes on a linear scale. The final scene overlays two September 16 GIS polygons without adding overlapping areas. GIS attributes call them episode 55, but the current HVO table lists the event without an episode number; we follow the table. Terrain contours are fixed historical context, not current crater elevations. Values are preliminary.[1][2][3][6][7]
Sources
- USGS HVO — Eruption information / episode table
- USGS — Dynamic eruption map / geographic layers
- USGS — September 23, 2026: vents and lava flows, September 14–16
- USGS — 2018 summit collapse and lower East Rift Zone eruption
- USGS — 2018 lava-flow chronology polygons
- Mapzen Terrain Tiles / USGS・NOAA
- Terrain Tiles attribution
- USGS HVO — 2026年10月2日 09:45 HSTの活動更新(2026年10月3日確認)
- Disney — Moana (2016), returning the heart of Te Fiti / 2024-10-28
- 米国国立公園局 / National Park Service — 2018 Eruption and Summit Collapse
- USGS HVO — Aerial view of lava fountains within Halemaʻumaʻu, December 30, 2024
- USGS HVO — March 10, 2026 — Kīlauea episode 43 dual lava fountains
- USGS HVO — December 23, 2024 — Kīlauea summit eruption
- USGS HVO — Kīlauea Volcano — Kapoho Bay ocean entry plume
Author
SORAH Editorial
October 3, 2026