Published on 03/October/2026 · Ice
An Antarctic iceberg returns to the sea after a 40-year odyssey
By SORAH Editorial
Calved from Antarctica in 1986, grounded for decades, then drifting into the South Atlantic: follow the forty-year life of the iceberg named A23a, ending in fragmentation in April 2026.
Calved from Antarctica in 1986, grounded for decades, then drifting into the South Atlantic: follow the forty-year life of the iceberg named A23a, ending in fragmentation in April 2026.
An iceberg’s journey does not necessarily begin with a long, uninterrupted drift. Parent iceberg A23 calved from the Filchner Ice Shelf in August 1986. Its principal remaining section later became A23a. The ice spent much of its life close to Antarctica before travelling into the South Atlantic.[4][5]
![August 1986 marks the calving event. The position series starts on September 28; no unobserved August coordinate is invented.[1][5]](/images/articles/a23a-iceberg/feed-0.jpg)
August 1986 marks the calving event. The position series starts on September 28; no unobserved August coordinate is invented.[1][5]
A point that holds decades
![November 10, 1986: parent Iceberg A23 and neighbouring bergs shortly after calving, recorded by Landsat 5 MSS. Image: NASA Earth Observatory / Michala Garrison, using USGS Landsat data. Resized.[4]](/images/articles/a23a-iceberg/a23a-1986.jpg)
November 10, 1986: parent Iceberg A23 and neighbouring bergs shortly after calving, recorded by Landsat 5 MSS. Image: NASA Earth Observatory / Michala Garrison, using USGS Landsat data. Resized.[4]
The Antarctic Iceberg Tracking Database at Brigham Young University (BYU), Utah, United States, combines satellite scatterometer observations with position reports from the U.S. National Ice Center (USNIC). Its records show both prolonged residence in the same waters and the later northward journey.[1]
The film compresses the long 1986–2020 residence and devotes more of its twenty seconds to later drift, especially the final months. Calendar time does not advance at a constant rate. Reading the date is essential to understanding the contrast between staying and moving.
![The later drift. Marker size encodes neither area nor volume.[1]](/images/articles/a23a-iceberg/feed-360.jpg)
The later drift. Marker size encodes neither area nor volume.[1]
Movement and loss on separate axes
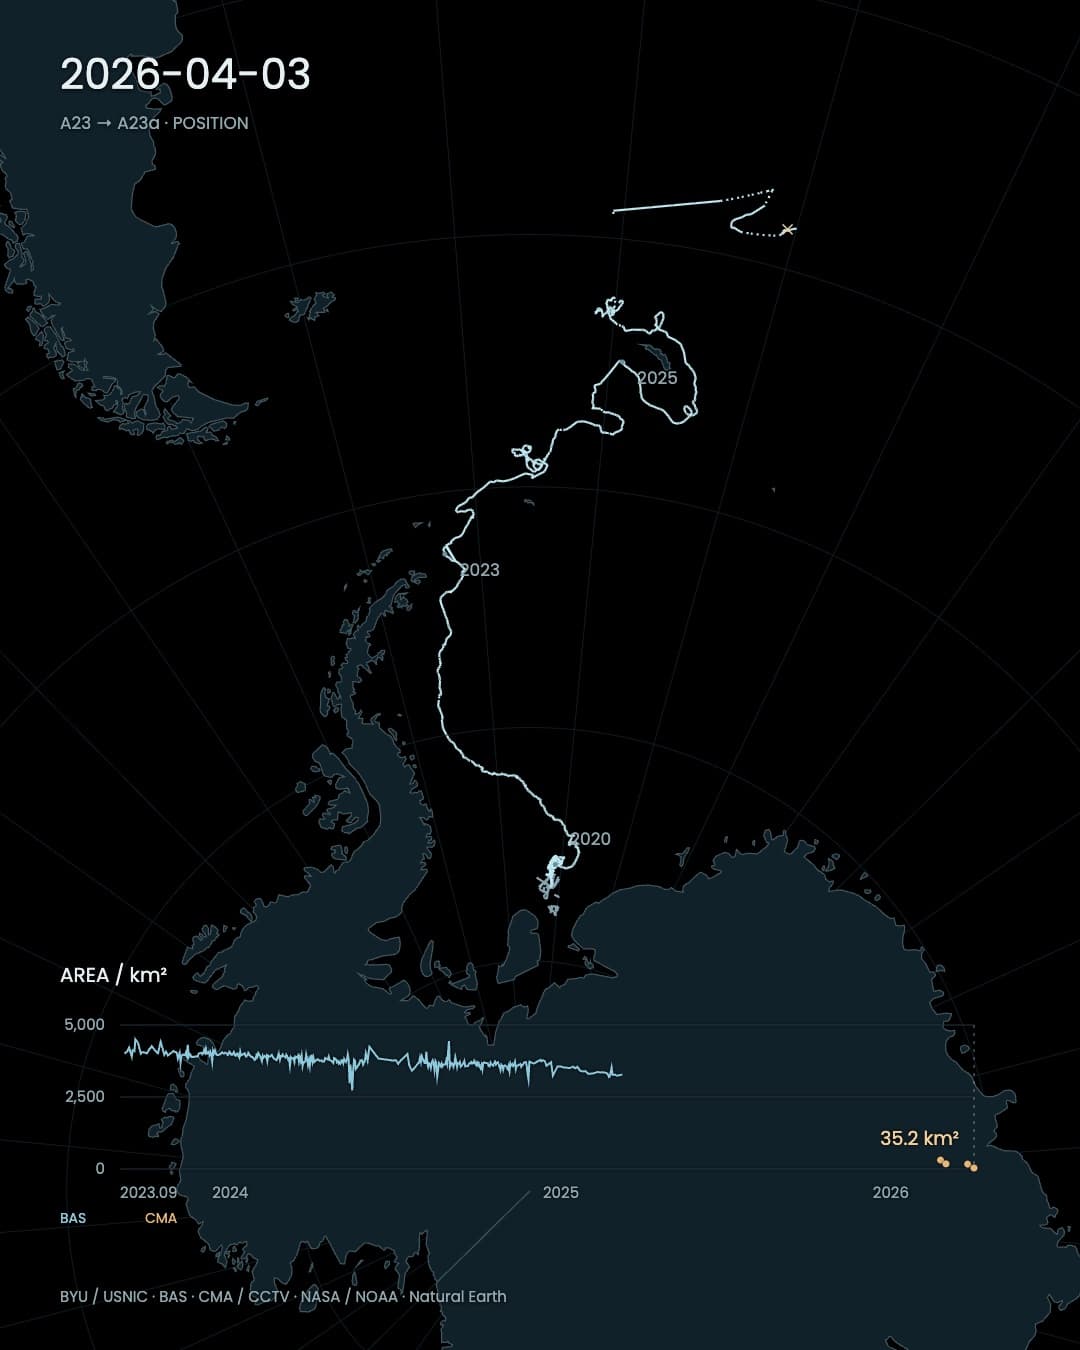
The area chart begins only when the available area observations begin. The UK’s British Antarctic Survey (BAS) polygon measurements and late-life estimates reported by a China Meteorological Administration specialist remain separate series. The latter fall from 310 km² on February 25, 2026 to 180 km² on March 3, 169 km² on March 27 and 35.2 km² on April 3. That last number represents remaining ice, not zero.[2][3]NOAA-21 imagery from April 3 records the fragmented ending. This is the end of the large iceberg’s journey, not proof that every remaining piece had melted. A named object can disappear from the map before its material disappears from the ocean.[4]
![April 3, 2026: A23a’s fragmented remains in the South Atlantic, recorded by NOAA-21 VIIRS. Image: NASA Earth Observatory / Michala Garrison, using NASA/NOAA data. Resized. Scale differs from the 1986 image.[4]](/images/articles/a23a-iceberg/a23a-2026.jpg)
April 3, 2026: A23a’s fragmented remains in the South Atlantic, recorded by NOAA-21 VIIRS. Image: NASA Earth Observatory / Michala Garrison, using NASA/NOAA data. Resized. Scale differs from the 1986 image.[4]
![April 3, 2026. The cross marks an approximate reported fragmentation region. Blue: BAS area; orange points: CMA estimates.[2][3][4]](/images/articles/a23a-iceberg/feed-479.jpg)
April 3, 2026. The cross marks an approximate reported fragmentation region. Blue: BAS area; orange points: CMA estimates.[2][3][4]
Nearly forty years after calving, A23a lost its identity as a single giant iceberg. Decades grounded on the seafloor were followed by drift into the South Atlantic and final fragmentation. The surviving pieces had not all melted, but the long life of the great named berg had ended.[4]
Note · データと表現 / Data & method Positions span September 28, 1986–March 31, 2026 and include provider interpolation. Gaps over fourteen days and jumps exceeding 150 km per day are disconnected. The approximate April endpoint is separate from the track. Missing area periods are not filled, different area methods are not joined, and volume is not inferred without thickness.[1][2][3]
Sources
Author
SORAH Editorial
October 3, 2026