City lights and sky brightness
Toward red and white, faint stars are harder to see.
Colour scale, sources and interpretation
Overlay satellite night-light imagery and a published map of modelled artificial zenith brightness.
Approximate reprojection of a published cartographic image, retaining its colours. Different sources and years, not a time trend. No underlying numeric model or point values, star counts or Bortle conversion. Model-map domain: 65°S–75°N; embedded-key footprint omitted.
Toward red and white, faint stars are harder to see.
Colours show modelled artificial brightness at zenith relative to natural sky brightness. Blue: 0.11–0.33×; green: 0.33–1×; yellow: 1–3×; orange: 3–9×; red: 9–27×; pale grey–white: 27× or more. Black–dark grey: below 0.11×.
Red does not mean all stars disappear. Actual visibility also depends on the Moon, weather and observing conditions. This is not a Bortle rating or a star count. White city-light points are the separate NASA satellite image.
Background stars are illustrative, not observed positions or visibility.
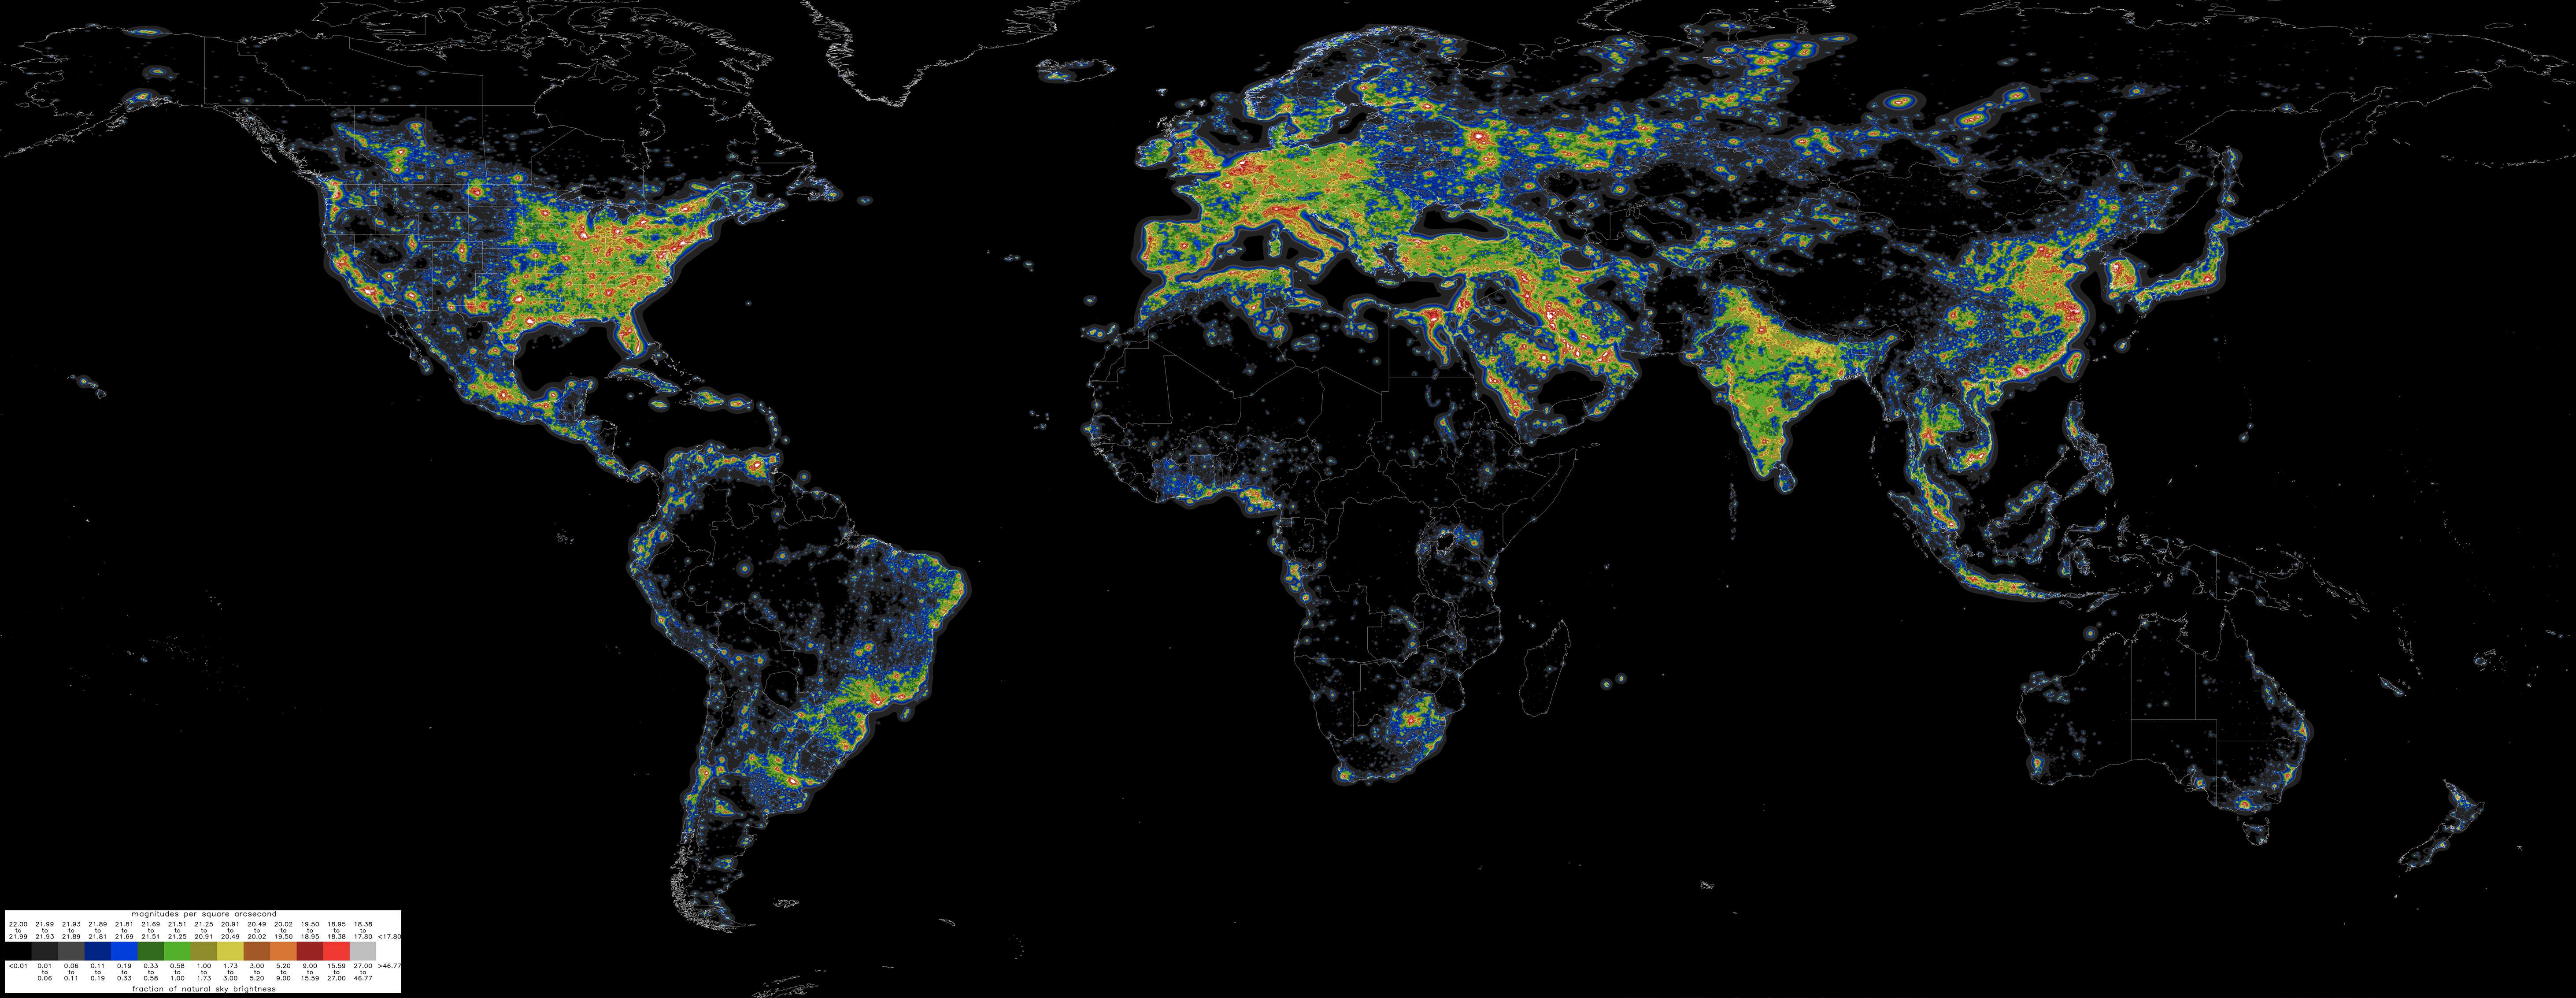
NASA Earth Observatory (2016). David Lorenz (2020 atlas; attribution-only permission, Wikimedia VRT 2021120610011763). Image reprojection by SORAH.
NASA Earth Observatory / David Lorenz · Reuse terms · Data provenance

